
Medical Protective Equipment Market Size and Share
Market Overview
| Study Period | 2020 - 2031 |
|---|---|
| Market Size (2026) | USD 46.29 Billion |
| Market Size (2031) | USD 62.94 Billion |
| Growth Rate (2026 - 2031) | 6.34 % |
| Fastest Growing Market | Asia Pacific |
| Largest Market | North America |
| Market Concentration | Low |
Major Players *Disclaimer: Major Players sorted in no particular order Image © Mordor Intelligence. Reuse requires attribution under CC BY 4.0. | |
Medical Protective Equipment Market Analysis by Mordor Intelligence
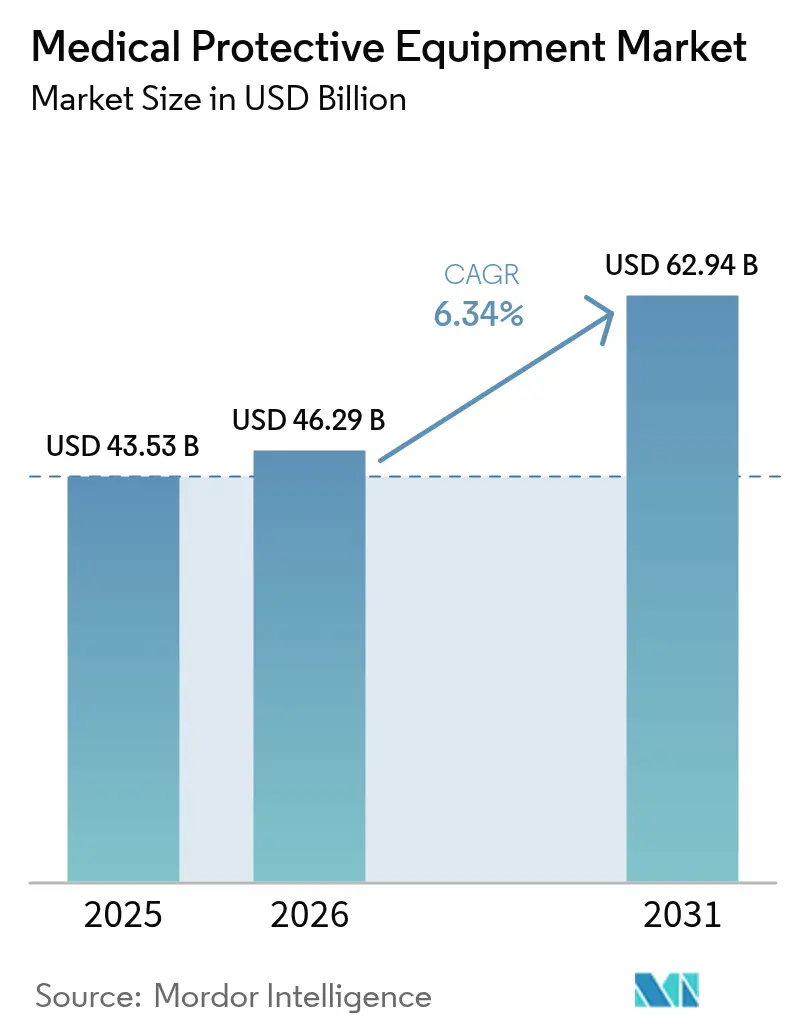
The medical personal protective equipment market size is expected to grow from USD 43.53 billion in 2025 to USD 46.29 billion in 2026 and is forecast to reach USD 62.94 billion by 2031 at 6.34% CAGR over 2026-2031. Elevated safety norms, institutionalized after COVID-19, have transformed episodic demand surges into a structural rise in baseline consumption, especially across surgical suites, laboratories, and home-care settings. Expanded ambulatory surgery volumes, mandated fit-testing, and sustainability-driven shifts toward reusable textiles further sustain growth. North America retains procurement leadership through stringent FDA oversight, while Asia-Pacific accelerates on the back of manufacturing capacity expansion. Supply chain strategies now emphasize dual sourcing and domestic production to buffer nitrile and polypropylene price swings, and advanced material science is unlocking lighter, more breathable fabrics that enhance wearer compliance without sacrificing protection. Heightened environmental scrutiny is simultaneously pushing manufacturers to integrate circular design principles, propelling research into biodegradable resins and multi-use barrier systems.
Key Report Takeaways
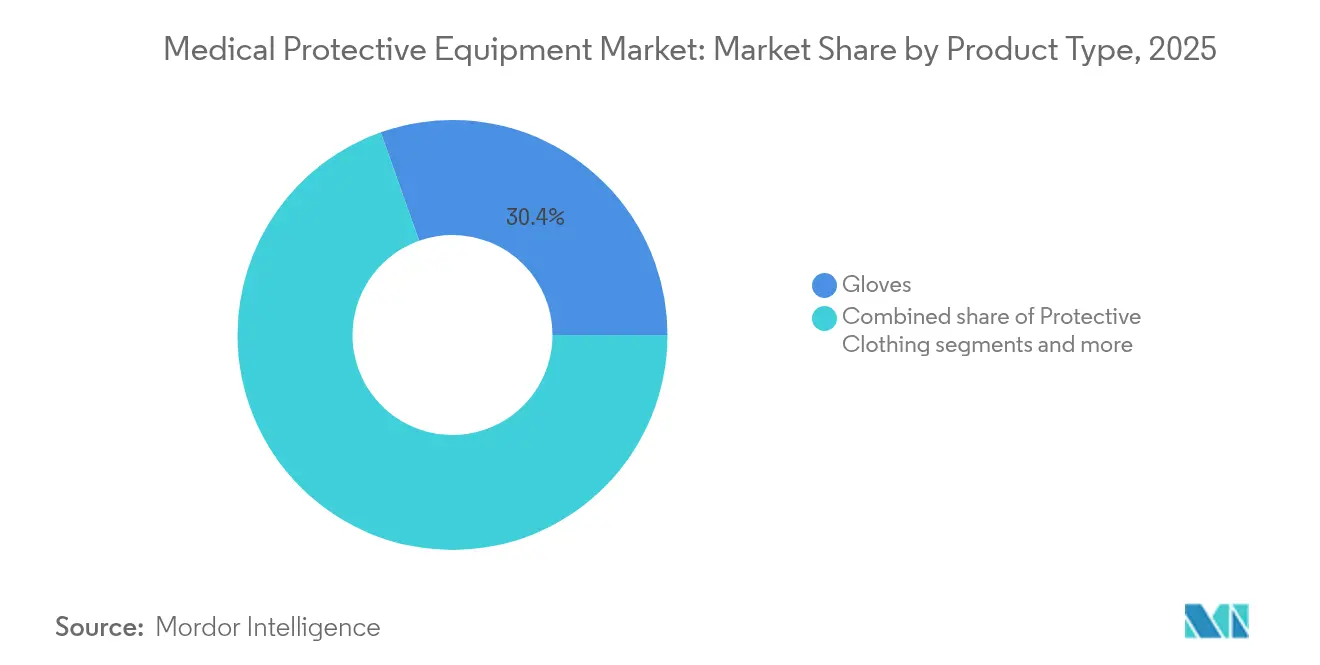
- By product type, gloves led with 30.42% of medical personal protective equipment market share in 2025, while protective clothing is forecast to expand at a 6.75% CAGR to 2031.
- By material, nitrile rubber accounted for 37.63% share of the medical personal protective equipment market size in 2025 and natural rubber/latex is advancing at a 6.98% CAGR through 2031.
- By usability, disposable variants captured 69.05% share of the medical personal protective equipment market size in 2025, whereas reusable options record the highest projected CAGR at 7.10% to 2031.
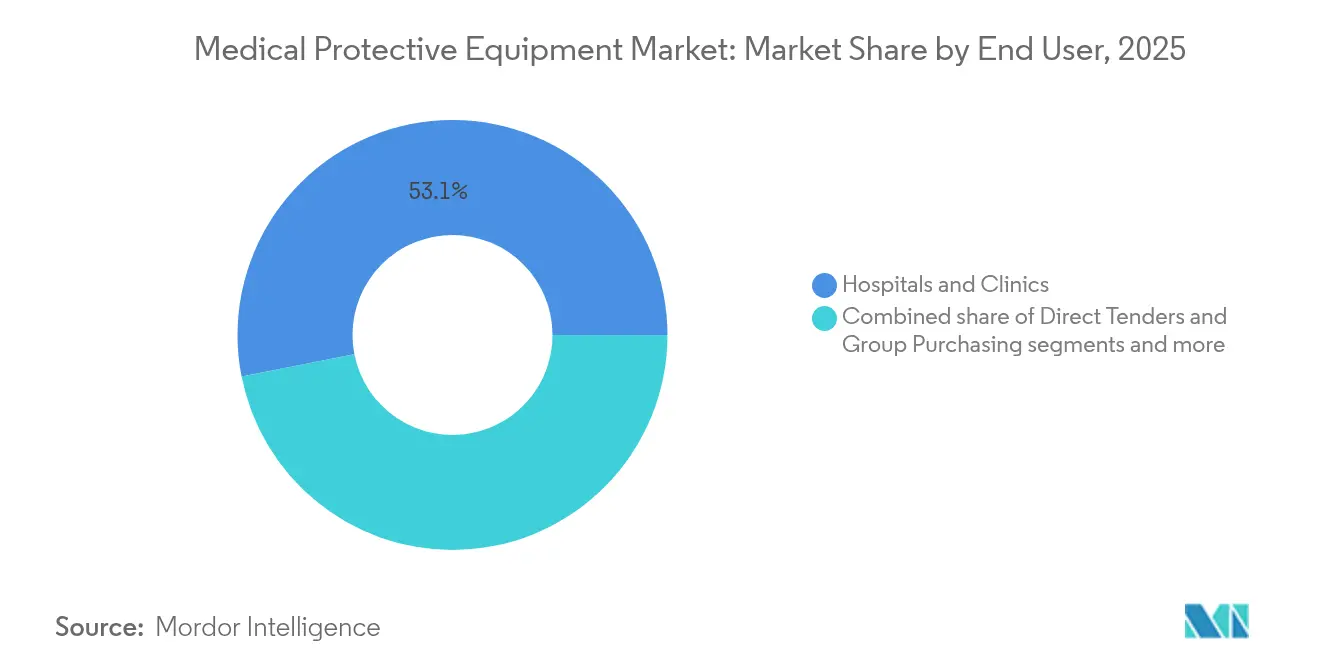
- By end user, hospitals and clinics held 53.10% of the medical personal protective equipment market share in 2025; diagnostic laboratories are set to grow at a 7.32% CAGR through 2031.
- By distribution channel, hospital pharmacies controlled 57.95% of the medical personal protective equipment market size in 2025, while direct tenders and group purchasing are projected to rise at 7.52% CAGR to 2031.
- By geography, North America led with 41.65% revenue in 2025 and Asia-Pacific is registering the fastest regional CAGR of 7.85% through 2031.
Note: Market size and forecast figures in this report are generated using Mordor Intelligence’s proprietary estimation framework, updated with the latest available data and insights as of 2026.
Market Trends and Insights
Drivers Impact Analysis of Medical Protective Equipment Market*
| Driver | (~) % Impact on CAGR Forecast | Geographic Relevance | Impact Timeline |
|---|---|---|---|
| Rising surgical procedure volumes | +1.2% | Global, with concentration in North America and Europe | Medium term (2-4 years) |
| Heightened infection-prevention mandates post-COVID-19 | +1.8% | Global, strongest in developed healthcare systems | Short term (≤ 2 years) |
| Shift toward reusable PPE to curb waste & cost | +0.9% | North America and Europe leading, expanding to APAC | Long term (≥ 4 years) |
| Advanced material science enabling lighter barrier fabrics | +0.7% | Global, with R&D centers in North America and Europe | Long term (≥ 4 years) |
| On-site 3-D printing of customized respirators | +0.4% | North America and Europe, pilot programs in APAC | Long term (≥ 4 years) |
| AI-driven demand-sensing boosting distributor inventory turns | +0.3% | Global, with early adoption in developed markets | Medium term |
| Source: Mordor Intelligence | |||


Rising Surgical Procedure Volumes
Growing backlogs of deferred electives and aging populations are pushing annual global surgical counts upward, especially in ambulatory surgery centers where volumes are forecast to rise 12% within five years. Each intervention demands multiple glove changes, fluid-resistant gowns, and splash shields, all of which directly enlarge the medical personal protective equipment market. Ambulatory centers operate on lean inventories, so suppliers able to guarantee frequent, small-lot deliveries are favored. Complex minimally invasive procedures now require specialty respirators and precision barrier drapes, further widening product breadth. As outpatient volumes climb, procurement models are integrating automated reorder points tied to procedure schedules, tightening distributor–provider collaboration.
Heightened Infection-Prevention Mandates Post-COVID-19
Updated CDC targets now compel even low-acuity settings—such as primary care clinics and home-health visits—to maintain baseline PPE stocks, embedding durable demand into the medical personal protective equipment market. Clinical laboratories must document biosafety risk assessments for every instrument, triggering higher-grade glove and goggle requirements. Fit-testing audits reveal that one in five staff cannot achieve a safe seal with legacy respirators, prompting demand for inclusive sizing and custom-fit solutions. Hospital accreditation bodies link reimbursement to adherence with these standards, incentivizing continuous inventory replenishment. Regulators are also tightening shelf-life monitoring, pushing facilities toward demand-sensing software that minimizes expiries without risking stockouts.
Shift Toward Reusable PPE to Curb Waste & Cost
Hospitals that substituted disposable gowns with reusable textiles cut solid-waste streams by up to 93% and reduced gown spend to 60% of prior levels. University Health Network now launders 120,000 gowns weekly, demonstrating scale viability. The National Academies notes that modern barrier fabrics endure 75 wash cycles while retaining fluid resistance. State policymakers are debating quotas mandating 50% reusable adoption, which would pivot procurement toward long-term service contracts covering laundering, quality checks, and RFID-based traceability. This inexorably directs investment into washing infrastructure, antimicrobial coatings, and closed-loop take-back programs, reshaping revenue streams for material suppliers and service providers.
Advanced Material Science Enabling Lighter Barrier Fabrics
Nanoparticle-infused cotton now blocks 99% of E. coli and S. aureus while remaining breathable. Graphene-oxide sprays deliver antiviral performance without hindering airflow, and electroless silver plating neutralizes SARS-CoV-2 within 60 minutes. Smart textiles can capture wearer biometrics and harvest kinetic energy for integrated sensors, hinting at gowns that alert staff to breaches or temperature spikes. These innovations are increasing user comfort—an attribute closely linked to compliance—thereby expanding adoption in settings that historically resisted full-barrier attire.
Restraints Impact Analysis of Medical Protective Equipment Market*
| Restraint | (~) % Impact on CAGR Forecast | Geographic Relevance | Impact Timeline |
|---|---|---|---|
| Raw-material price volatility (nitrile & polypropylene) | -1.4% | Global | Short term (≤ 2 years) |
| Environmental pushback on single-use plastics | -0.8% | Europe, North America | Medium term (2-4 years) |
| Counterfeit certification schemes eroding buyer trust | -0.5% | Emerging markets | Medium term (2-4 years) |
| Robotics-enabled “no-touch” surgery lowering PPE intensity | -0.3% | North America, Europe | Long term (≥ 4 years) |
| Source: Mordor Intelligence | |||
Raw-Material Price Volatility (Nitrile & Polypropylene)
Nitrile butadiene rubber costs can swing double digits within a quarter, with 2025 tariff chatter adding fresh uncertainty. Only 15% of TSA’s glove requirements are sourced domestically, underscoring exposure to geopolitical shocks. Glove makers are hedging via dual sourcing and derivative contracts, yet hospitals still confront quarterly catalog repricing. Polypropylene follows similar volatility, as refinery outages ripple into melt-blown fabric availability. These swings compress margins for fixed-price contracts and can delay capital upgrades when working capital is diverted to inventory buffers.
Environmental Pushback on Single-Use Plastics
The EU Single-Use Plastics Directive and forthcoming PFAS bans have spurred procurement teams to audit disposables and favor circular options. The NHS estimates USD 11 million annual savings from waste-reduction initiatives, solidifying economic arguments for reuse. Manufacturers must swiftly certify new bio-based polymers without compromising barrier performance, a costly R&D endeavor that smaller firms struggle to fund.
*Our forecasts treat driver/restraint impacts as directional, not additive. The impact forecasts reflect baseline growth, mix effects, and variable interactions.
Medical Protective Equipment Market Segment Analysis
By Product Type:
Gloves Maintain Scale, Protective Clothing Gains PaceGloves generated USD 13.24 billion, equivalent to 30.42% of the medical personal protective equipment market in 2025, underpinned by universal procedure use and rapid turnover. Nitrile substitutes for latex allergies lock in glove indispensability across emergent and elective care. Innovation centers on tactile-sensing coatings that allow clinicians to maintain instrument feel while adding puncture alerts. Protective clothing, buoyed by 6.75% CAGR, benefits from expanded isolation protocols and new material blends incorporating recycled polypropylene fibers. RadiciGroup’s Respunsible® fabric exemplifies momentum toward closed-loop supply. Integrated sensor threads that log donning duration signal when gowns should be replaced, adding aftermarket software revenue.
Second-tier categories such as masks and respirators stabilize after pandemic peaks but remain critical where fit-test compliance dictates higher‐spec SKUs. Face-and-eye protectors see incremental growth tied to splash guidelines, while foot covers preserve relevance in clean rooms. Collectively, these niches ensure product diversification for vendors seeking to hedge against glove price cycles, reinforcing competitive intensity within the medical personal protective equipment market.


By Material:
Nitrile Holds Lead, Natural Rubber ResurgesNitrile rubber retained 37.63% revenue share in 2025 thanks to strong chemical resistance and latex-free acceptance, supporting the medical personal protective equipment market size expansions. Yet supply shocks during COVID-19 triggered strategic sourcing pivots toward natural rubber, driving latex gloves to a 6.98% CAGR. Thailand forecasts a steady climb in latex exports as healthcare throughput rises with aging populations. Hybrid composites that blend nitrile on the patient side with biodegradable layers on the exterior seek to balance cost, comfort, and sustainability. Polypropylene remains fundamental in melt-blown masks and SMS gowns, although recyclate percentages inch higher each year. Silver-nanoparticle woven cotton enters pilot runs for reusable gowns, carving a growing slice of specialty demand.
By Usability:
Disposables Dominate, Reusables AccelerateSingle-use items still represent 69.05% of medical personal protective equipment market share, driven by sterility guarantees and historic guideline bias. However, reusable systems show 7.10% CAGR as compelling life-cycle analyses demonstrate cost and waste benefits. UCLA Health’s 28% energy savings via reusable gowns underscore operational value. Barrier fabrics now resist 75 autoclave cycles, and RFID tags track laundering history to assure integrity. Vendor revenue models evolve toward subscription services bundling textiles, collection bins, and disinfection audits—an annuity stream that buffers raw-material volatility typical in disposables.
By End User:
Hospitals Anchor, Laboratories SurgeHospitals and clinics consumed 53.10% of 2025 revenue, yet diagnostic labs post a brisk 7.32% CAGR that enlarges the medical personal protective equipment market size. CDC biosafety directives obligate lab directors to match PPE grades to agent risk—upscaling from basic gloves to triple-glove and powered-air respirator protocols. Contract testing growth in genomics and oncology further widens lab footprints. Ambulatory surgery centers continue outpacing inpatient theaters, demanding compact PPE storage and vendor-managed inventory. Home-care nursing relies on lightweight kits integrating masks, gloves, and shoe covers in single sealed pouches, a niche attracting private-label suppliers.
By Distribution Channel:
Hospital Pharmacies Rule, Direct Tenders RiseHospital pharmacies orchestrate 57.95% of distribution, leveraging centralized EMR-linked ordering portals that auto-populate replenishment based on actual use, keeping the medical personal protective equipment market fluid. Direct tenders and group purchasing organizations climb at 7.52% CAGR as systems bypass third-party redistributors to lock in capacity guarantees. Premier Inc.’s 20% stake in Prestige Ameritech exemplifies vertically integrated partnerships securing domestic glove lines. Online platforms, boosted by e-catalog APIs, handle tail-spend items for small clinics, offering consolidated drop-shipping to cut freight costs. Retail pharmacies retain niche share by serving walk-in vaccination sites and urgent-care chains.
Geography Analysis
North America Medical Protective Equipment Market
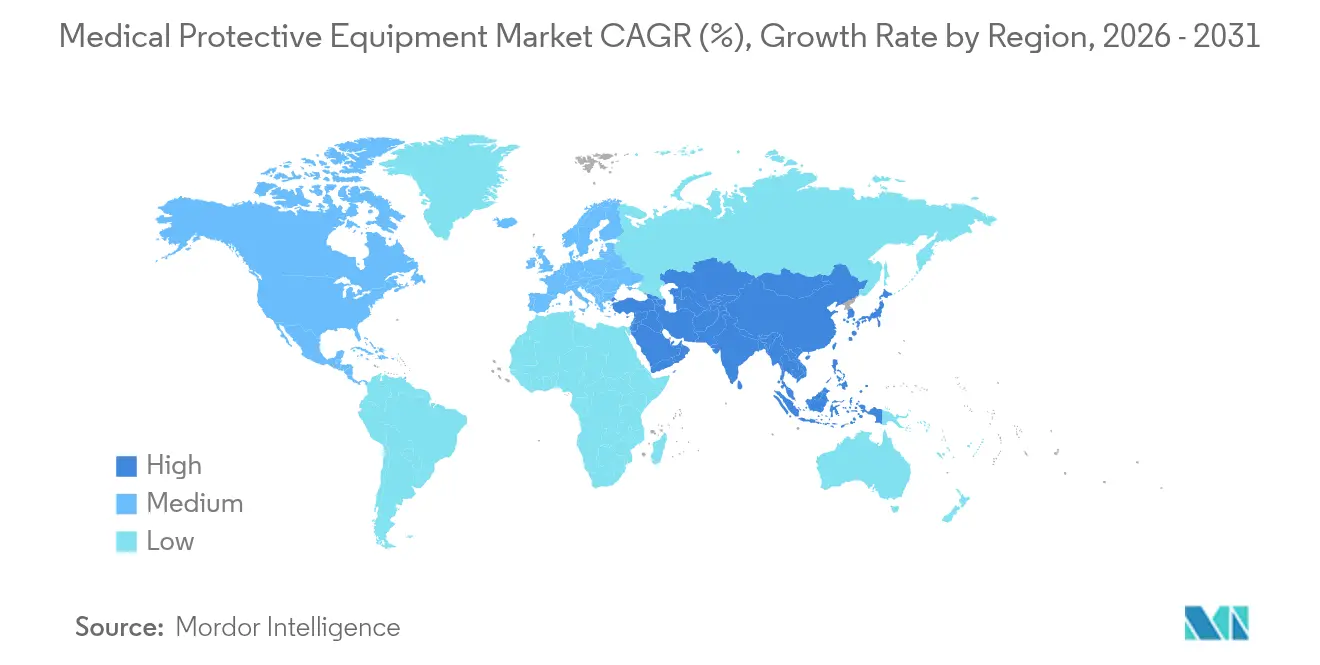
North America generated 41.65% of 2025 sales as FDA alignment with ISO 13485 demands elevated quality and spurred domestic re-shoring initiatives like the USD 510 million allocation to bolster regional production. The medical personal protective equipment market benefits from integrated health systems capable of multi-year offtake commitments that de-risk capital expenditure on advanced melt-blown lines. Education campaigns around reusable gowns tap into the U.S. climate agenda, nudging hospital purchasing committees toward sustainable SKUs.
APAC Medical Protective Equipment Market
Asia-Pacific is set for 7.85% CAGR to 2031 as governments boost healthcare capacity and OEMs expand nitrile glove factories. Malaysia’s tariff incentives and India’s PPE technical-textile parks anchor regional supply, while regulatory harmonization via ASEAN Medical Device Directive accelerates foreign entrant registration. Rising middle-class healthcare spend fuels surgical volumes, enlarging addressable demand and enticing multinational brands to establish joint ventures for localized fit testing.
EMEA and South America Medical Protective Equipment Market
Europe progresses steadily under the Medical Device Regulation, which now covers PPE. The CE-marking extension in the U.K. eases post-Brexit uncertainty and preserves intra-European trade flows. Sustainability imperatives, embodied in the Green Deal, prioritize reusables, pushing hospitals to trial sterilizable respirators. South America and Middle East & Africa trail in absolute value but register pockets of growth where private hospitals scale up infection-control standards, signaling future expansion corridors for the medical personal protective equipment market.

Regulatory Landscape
In the United States, regulatory and procurement policy changes are tightening quality-system and sourcing requirements that shape healthcare PPE supply. The FDA Quality Management System Regulation (QMSR) became effective on February 2, 2026, aligning device quality requirements more closely with ISO 13485 expectations and raising the compliance bar for manufacturers supplying regulated protective products to healthcare settings.
Federal buying rules are also reinforcing domestic sourcing for PPE. In May 2026, the US Department of Veterans Affairs issued a class deviation implementing the Make PPE in America Act under VAAR 825 and 852, embedding Made in America certification requirements into VA solicitations and award terms. In Europe, PPE continues to be governed under Regulation (EU) 2016/425, and the European Commission updated the harmonised standards list via Commission Implementing Decision (EU) 2026/1279 (June 16, 2026), which affects presumption-of-conformity pathways used by manufacturers and notified bodies.
Value Chain Analysis
The value chain begins with upstream feedstocks and specialty materials, notably nitrile butadiene rubber and non-woven polypropylene for gloves, masks, and gowns, along with additives, elastic components, and packaging. Manufacturers convert these inputs through dipping (gloves), melt-blown and spunbond non-woven conversion, garment fabrication, and final sterilization or cleanliness controls depending on end use. Quality assurance, test laboratories, and certification bodies are key nodes, since changes to a qualified raw material or production site can trigger lengthy revalidation and certification cycles that limit rapid supplier switching even when input prices move.
Downstream, the chain flows through global logistics providers and medical distributors into hospitals, clinics, laboratories, and group purchasing and tender channels, where inventory visibility and compliance documentation increasingly influence supplier selection. Trade and tariff uncertainty is a persistent operational constraint, highlighted by the US Department of Commerce Bureau of Industry and Security initiating a Section 232 national security investigation into imports of PPE and medical consumables in September 2025. Suppliers therefore balance dual sourcing, regionalized production footprints, and higher safety stocks to protect service levels, while maintaining global manufacturing networks to preserve cost competitiveness.
Competitive Landscape
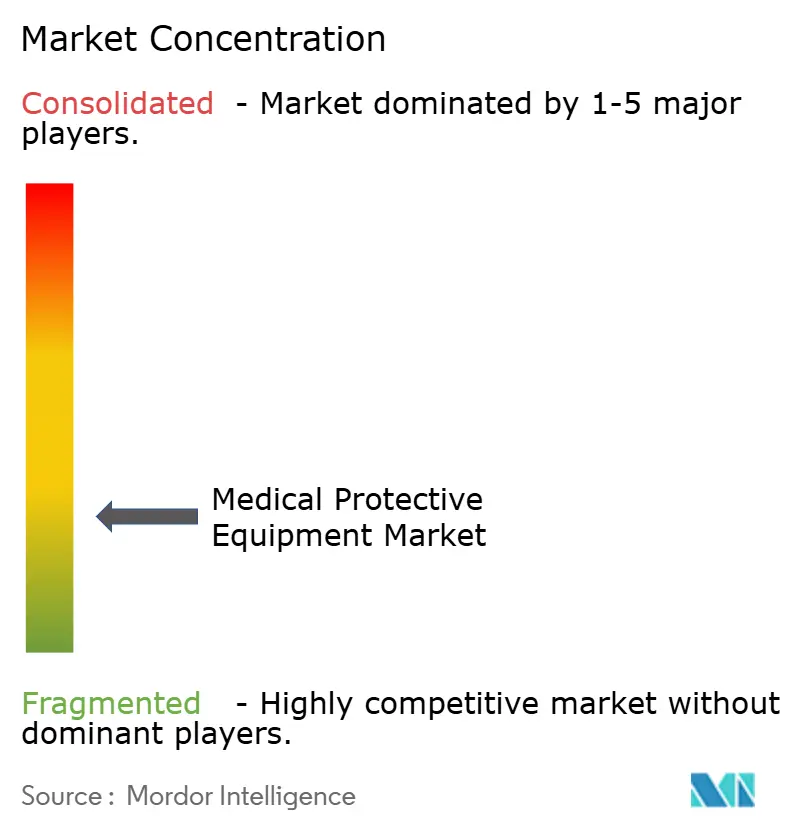
The sector remains moderately fragmented; the top five suppliers hold roughly half revenue, leaving room for agile regional players. Honeywell’s USD 1.325 billion PPE divestiture illustrates conglomerates sharpening focus on core verticals while specialized firms chase scale efficiencies. Ansell’s USD 640 million acquisition of Kimberly-Clark’s PPE unit deepens its healthcare glove portfolio and embeds recycling programs, reflecting a strategic bet on closed-loop offerings.
Technology is a decisive differentiator. GORE-TEX applies AI to iterate respirator geometries that fit broader face types, cutting failure rates and time-to-market. 3M’s solar-powered communication headset merges energy harvesting with hearing protection, broadening cross-selling into industrial safety. Regional challengers position on speed, branding themselves as “near-shore” alternatives able to restock hospitals within days versus weeks. As rebate pricing compresses margins, firms pivot toward outcome-based contracts bundling training, stock-monitoring software, and waste-take-back—deepening stickiness in the medical personal protective equipment market.
Regulatory agility further shapes rankings. Companies with ISO-aligned quality systems are already compliant with the FDA’s 2026 QMSR final rule, sidestepping costly remediation. Smaller rivals must invest or partner, prompting an expected second wave of consolidation by 2027.
Medical Protective Equipment Industry Leaders
Ansell Limited
Top Glove Corporation Bhd
DuPont de Nemours, Inc.
3M Company
Kimberly-Clark Corporation
- *Disclaimer: Major Players sorted in no particular order
Medical Protective Equipment Market Companies Covered in this Report
- 3M
- DuPont
- Ansell
- Cardinal Health
- Medline Industries
- Lakeland Industries, Inc.
- MSA Safety Incorporated
- Molnlycke Health Care
- Top Glove
- Supermax
- Hartalega Holdings
- Alpha Pro Tech, Ltd.
- Medtecs International Corp.
- Owens & Minor, Inc.
- Steris plc
- Dynarex

Market Opportunities and Future Outlook
Domestic-sourcing programs and supply-chain resilience initiatives are creating whitespace for manufacturers that can document origin, traceability, and quality performance at scale. In the United States, CMS opened a public input process in January 2026 on policies to strengthen domestic manufacturing of PPE and essential medicines, and the VA moved in May 2026 to operationalize Make PPE in America Act requirements through a class deviation affecting PPE procurement. These actions raise the bar for compliant, auditable supply and favor suppliers with established quality systems and procurement-ready documentation.
Capacity additions and regional hubs also offer near-term paths to win share in gloves and other high-throughput consumables, particularly where automation offsets higher labor costs. Fulflex completed an acquisition in July 2026 of a 300,000-square-foot automated medical products manufacturing facility in Jacksonville, Texas, pointing to continued investment in North American production footprints. In Asia, Mallcom India Limited announced in June 2026 a 100 crore rupee investment to expand PPE manufacturing at its Sanand, Gujarat facility, including a new NBR dipping line for PU coated gloves. Separately, Molnlycke Health Care announced a joint venture with Zhende Medical in May 2026 in China, underscoring how localized partnerships can support portfolio access and channel reach in regulated healthcare markets.
Recent Industry Developments in Medical Protective Equipment Market
- June 2026: DuPont launched Tyvek APX in the ASEAN market, expanding availability of its disposable protective garment fabric for applications requiring breathable barrier protection. The rollout strengthens DuPont's position in high-performance protective clothing materials and supports channel partners serving industrial and healthcare-adjacent infection-control needs.
- March 2025: Ansell expanded its healthcare and protective equipment portfolio through product and range updates communicated in company releases, targeting higher-specification use cases and compliance-driven buyers. The additions support cross-selling into hospitals and clinics where standardization and supplier consolidation influence tender outcomes.
- July 2024: Ansell completed its acquisition of Kimberly-Clark's Personal Protective Equipment business (KCPPE) for USD 640 million, adding brands such as Kimtech and KleenGuard to its portfolio. The integration broadened Ansell's presence across healthcare, cleanroom, and industrial segments and increased its ability to bundle products and sustainability programs in large institutional contracts.


Medical Protective Equipment Market Report Scope and Research Methodology
Market Definition and Coverage
This market covers the revenue earned from medical protective equipment used in healthcare settings to reduce exposure to infectious agents and bodily fluids, across routine care, procedures, and lab work, and counted at the point of sale for the equipment.
Scope exclusions: items such as non-medical industrial PPE used for construction or general workplace safety are excluded from this market sizing.
Segments Covered in This Report
- By Product Type
- Protective Clothing
- Masks & Respirators
- Gloves
- Face, Eye & Head Protection
- Foot & Shoe Covers
- Others
- By Material
- Non-woven Polypropylene
- Nitrile Rubber
- Natural Rubber/Latex
- Polyethylene & Other Plastics
- By Usability
- Disposable
- Reusable
- By End User
- Hospitals & Clinics
- Ambulatory Surgical Centers
- Diagnostic Laboratories
- Home Healthcare
- Research & Academic Institutes
- Others
- By Distribution Channel
- Hospital Pharmacies
- Retail Pharmacies & Drug Stores
- Direct Tenders & Group Purchasing
- Online Platforms
- By Geography
- North America
- U.S.
- Canada
- Mexico
- Europe
- Germany
- United Kingdom
- France
- Italy
- Spain
- Rest of Europe
- Asia-Pacific
- China
- India
- Japan
- South Korea
- Australia
- Rest of Asia-Pacific
- South America
- Brazil
- Argentina
- Rest of South America
- Middle East and Africa
- GCC
- South Africa
- Rest of Middle East and Africa
- North America
Data Sources, Market Sizing, and Validation
Desk Research
Desk research is used to build the starting structure for the model and to pressure test whether demand signals align with healthcare activity. We reviewed public sources such as the US FDA product and safety communications, the US CDC infection prevention guidance, the WHO technical guidance for PPE use, and trade data series published by UN Comtrade for relevant HS codes that often map to masks, gloves, and protective apparel.
To keep assumptions grounded, we also referenced sources such as national health statistics for procedure volumes, hospital utilization indicators, and public procurement portals where tender language clarifies specification shifts, for example, certification requirements for respirators. Company filings, investor presentations, and reputable press were used to understand capacity additions, price normalization, and channel mix, supported by paid subscriptions for company financials and an import and export shipment-level database when validation was needed. These desk sources are illustrative, and many other public references were used for data collection, cross-checks, and clarification during analysis.
Primary Interviews and Surveys
Primary work was used to confirm what gets purchased, how often it is replaced, and how pricing and shortages move across product types, with inputs gathered from manufacturers, distributors, group purchasing, and healthcare procurement and infection control roles. To avoid overcounting, we also spoke with experts across major regions so utilization patterns in hospitals, clinics, labs, and ambulatory centers could be compared, and the final totals could be reconciled with the desk-based demand signals.
Distribution of primary research fieldwork respondents
| Company type | Respondent position | Region |
|---|---|---|
| Top tier: 32% | CXOs: 13% | APAC: 37% |
| Mid tier: 53% | Functional/Unit leaders: 29% | EMEA: 37% |
| Smaller Players: 15% | Managers: 58% | Americas: 26% |
Market-Sizing & Forecasting
The core model is built using a top-down demand pool, where procedure volumes, inpatient and outpatient visits, and lab testing activity are converted into product usage using typical consumption rates and replacement cycles by care setting. Once the demand pool is formed, the value is calculated using average selling prices that are adjusted for product mix changes, for example, shifts between surgical masks and respirators, or disposable versus reusable gowns.
To keep the output realistic, we corroborate totals using selective bottom-up approximations, such as sampled supplier and distributor revenue splits, channel checks on institutional versus retail demand, and ASP x volume sanity checks for high-volume items like gloves. When gaps appear in bottom-up checks, assumptions are tightened using ranges from interviews and by linking them back to observable indicators like tender specifications, import intensity, and certification-driven product substitution. For forecasting, scenario analysis is applied around infection-control intensity, elective procedure growth, and supply capacity normalization, and the final trajectory is reviewed against expert expectations for pricing and utilization by region.
Data Validation & Update Cycle
Validation is done in several passes so the final market size does not rely on a single data stream. We compare model outputs with independent signals such as procedure trends, hospital occupancy patterns, trade flows, and public procurement activity, and then investigate variances before sign-off.
If an assumption moves materially, such as sudden price changes in gloves or a regulation-driven shift in respirator use, analysts re-contact sources to confirm direction and magnitude. The report is refreshed annually, with interim updates when major events affect demand or supply, and a final pre-delivery review is completed so the latest market view is reflected in the published numbers.
Mordor Intelligence's Medical Protective Equipment Market Size Compared With Other Published Estimates
Published numbers for medical protective equipment can look far apart even when they sound like the same topic, because included product families and end-use settings are not always consistent. Differences in base year timing, how prices are normalized after shock periods, and whether estimates are checked against hospital activity signals are also common drivers of divergence.
Key gap drivers are usually tied to what is counted as medical-grade protection and when it is counted. Some studies blend in broader workplace PPE or consumer retail protection, while others narrow the scope to healthcare-certified items only, and this shifts the revenue pool quickly for high-volume categories like gloves and masks. Pricing treatment matters as well, since aggressive price reversion assumptions can pull down near-term values, while slower normalization can inflate them.
Benchmark comparison
| Source | Market Size | Gaps in Research Methodology |
|---|---|---|
| Mordor Intelligence | USD 46.29 B (2026) | |
| Industry Publisher A | USD 27.90 B (2026) | Uses a narrower healthcare PPE revenue pool and appears to exclude several adjacent medical protection categories that are purchased in routine care, which lowers the counted volume and compresses the total value for the same year. |
| Industry Publisher B | USD 26.18 B (2025) | Anchors the model on a different base year and uses a smaller starting market value, which can happen when post-surge pricing and utilization are assumed to normalize faster, and when parts of outpatient and lab usage are captured at a lighter intensity. |
Industrial-grade protective wear sits outside Mordor Intelligence's scope, which helps explain why some broader safety equipment studies can land on different totals even before forecasting assumptions are compared. Taken together, the spread in published values is mostly explained by product inclusion, base-year alignment, and how ASPs are carried forward using observable demand signals and interview-checked ranges.


Key Questions Answered in the Report
How big is the Medical Protective Equipment Market?
The Medical Protective Equipment Market size is expected to reach USD 46.29 billion in 2026 and grow at a CAGR of 6.34% to reach USD 62.94 billion by 2031.
What is the current Medical Protective Equipment Market size?
In 2026, the Medical Protective Equipment Market size is expected to reach USD 46.29 billion.
Who are the key players in Medical Protective Equipment Market?
Ansell Limited, Top Glove Corporation Bhd, DuPont de Nemours, Inc., 3M Company and Kimberly-Clark Corporation are the major companies operating in the Medical Protective Equipment Market.
Which is the fastest growing region in Medical Protective Equipment Market?
Asia Pacific is estimated to grow at the highest CAGR over the forecast period (2026-2031).
Which region has the biggest share in Medical Protective Equipment Market?
In 2026, the North America accounts for the largest market share in Medical Protective Equipment Market.
What years does this Medical Protective Equipment Market cover, and what was the market size in 2025?
In 2025, the Medical Protective Equipment Market size was estimated at USD 46.29 billion. The report covers the Medical Protective Equipment Market historical market size for years: 2019, 2020, 2021, 2022, 2023 and 2024. The report also forecasts the Medical Protective Equipment Market size for years: 2026, 2027, 2028, 2029, 2030 and 2031.
Page last updated on:





