Marine Management Software Market Size and Share
Market Overview
| Study Period | 2020 - 2031 |
|---|---|
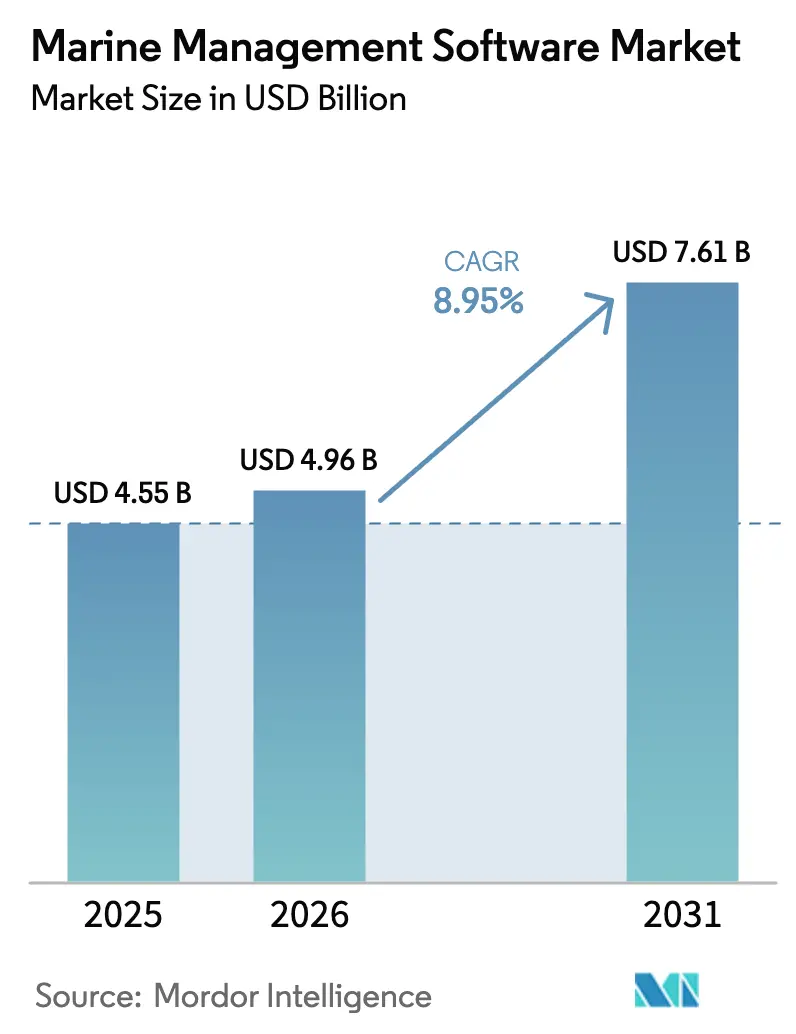
| Market Size (2026) | USD 4.96 Billion |
| Market Size (2031) | USD 7.61 Billion |
| Growth Rate (2026 - 2031) | 8.95% CAGR |
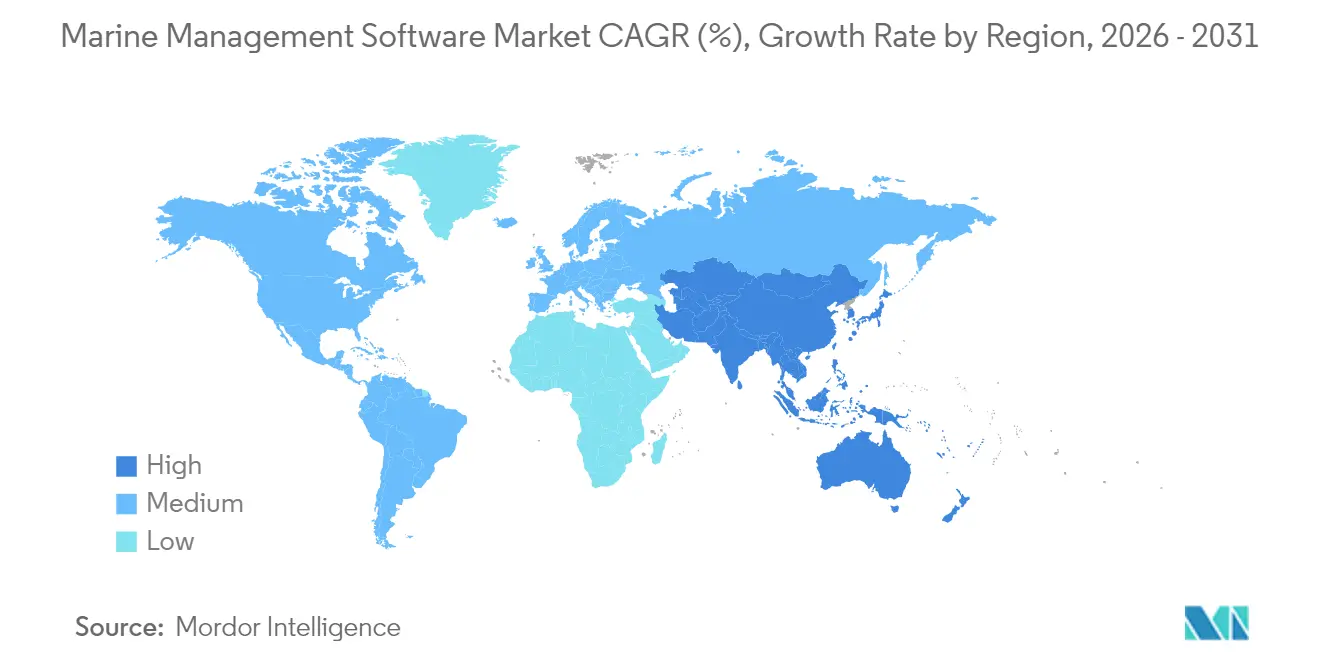
| Fastest Growing Market | Asia Pacific |
| Largest Market | North America |
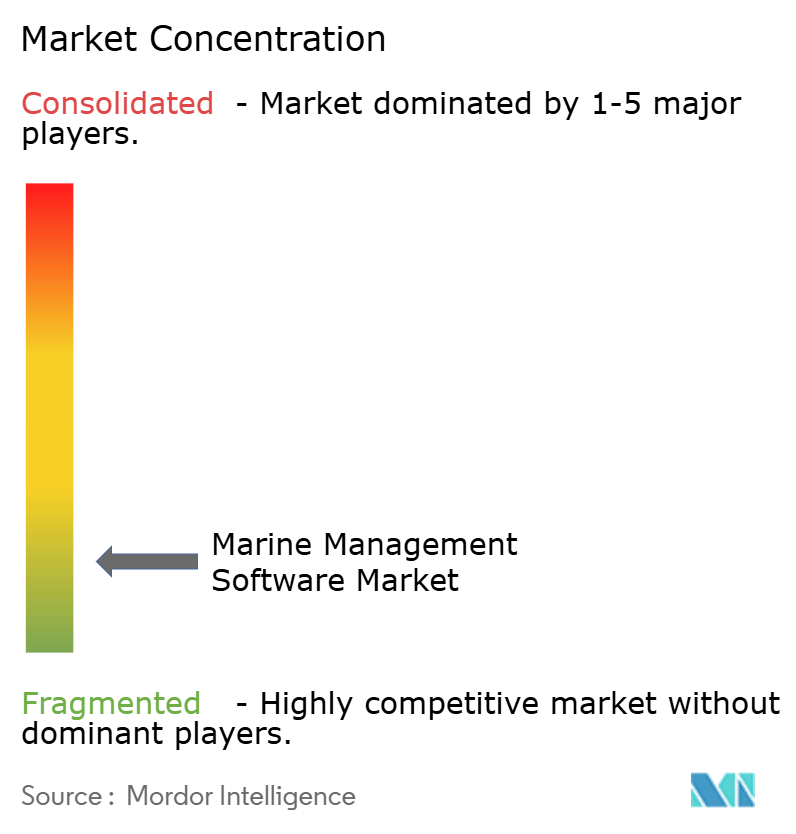
| Market Concentration | Low |
Major Players *Disclaimer: Major Players sorted in no particular order Image © Mordor Intelligence. Reuse requires attribution under CC BY 4.0. | |
Marine Management Software Market Analysis by Mordor Intelligence
The marine management software market size is expected to grow from USD 4.55 billion in 2025 to USD 4.96 billion in 2026 and is forecast to reach USD 7.61 billion by 2031 at 8.95% CAGR over 2026-2031. This growth is propelled by regulatory mandates that require near-real-time emissions monitoring, rising fuel-efficiency targets, and the need to synchronize dispersed fleet operations across oceans. Demand is strongest for cloud-based deployments that minimize on-premises hardware, while vessel and fleet management suites dominate current revenue. Integrated platforms able to combine voyage optimization, maintenance scheduling, and compliance reporting have become critical as operators confront tighter International Maritime Organization (IMO) rules on carbon intensit. Competitive momentum is reinforced by the European Union’s Emissions Trading System, which has accelerated software rollouts across European-flagged fleets. North America leads adoption today, but Asia-Pacific is rapidly catching up on the back of booming shipbuilding output, new digital port projects, and government-backed 5G maritime corridors.
Key Report Takeaways
- By solution type, vessel and fleet management held 41.85% of the marine management software market share in 2025, while compliance and risk reporting solutions are advancing at a 12.95% CAGR through 2031.
- By deployment mode, cloud platforms captured 54.88% of the marine management software market size in 2025; this segment is growing at 15.05% CAGR.
- By enterprise size, large operators retained 61.05% revenue share in 2025, yet small and medium enterprises are accelerating at 11.75% CAGR.
- By location, shore-side systems accounted for 63.35% of the marine management software market size in 2025, whereas onboard systems are rising at 11.30% CAGR.
- By end-user, commercial shipping led with 67.21% revenue share in 2025; offshore energy and offshore support vessels record the highest 13.75% CAGR.
- By geography, North America contributed 38.85% revenue in 2025, and Asia-Pacific is the fastest growing at 16.25% CAGR through 2031.
Note: Market size and forecast figures in this report are generated using Mordor Intelligence’s proprietary estimation framework, updated with the latest available data and insights as of 2026.
Global Marine Management Software Market Trends and Insights
Drivers Impact Analysis*
| Driver | (~) % Impact on CAGR Forecast | Geographic Relevance | Impact Timeline |
|---|---|---|---|
| Rising global maritime trade and fleet expansion | +2.1% | Global | Long term (≥ 4 years) |
| Regulatory push for digital reporting and emissions compliance | +2.8% | Global, EU leading | Medium term (2-4 years) |
| Cost savings via predictive analytics and route optimization | +1.7% | North America & EU | Short term (≤ 2 years) |
| 6G maritime-communication networks enable real-time data flows | +0.9% | APAC core, spill-over to MEA | Long term (≥ 4 years) |
| Technological advancements including integration of AI, IoT, and cloud computing | +1.4% | Global | Medium term (2-4 years) |
| Autonomous and unmanned vessels require integrated control suites | +0.7% | North America & EU | Long term (≥ 4 years) |
| Source: Mordor Intelligence | |||
Rising Global Maritime Trade and Fleet Expansion
Container volumes on East-West lanes have continued to swell, with Asia generating 42% of global seaborne exports in 2024.[1]United Nations Conference on Trade and Development, “Review of Maritime Transport 2024,” unctad.org Owners have responded by ordering 653 alternatively-fuelled ships, equal to 49% of the 2024 orderbook. Software capable of coordinating hybrid propulsion, LNG bunkering, and e-fuel logistics is now indispensable. Fleet managers increasingly favor modular platforms that standardize dashboards across vessel classes yet allow tweaks for specialized tonnage. As a result, the marine management software market is deepening its reach into newbuild specification stages, ensuring that digital twins and onboard sensors are embedded before a hull is launched.
Regulatory Push for Digital Reporting and Emissions Compliance
The EU Emissions Trading System and FuelEU Maritime rules oblige vessels above 5,000 GT to transmit fuel and emissions data continuously.[2]European Maritime Safety Agency, “The EU ETS and FuelEU Maritime Overview,” emsa.europa.eu Parallel IMO carbon-intensity ratings now determine operating limits, making automated reporting tools mission-critical. Software that consolidates voyage logs, engine telemetry, and bunker invoices into certified emissions statements shields operators from penalties that can exceed USD 100 per t of CO₂. As regulations stack, shipowners prefer single platforms that harmonize EU, IMO, and regional rules, propelling the marine management software market toward end-to-end compliance suites.
Cost Savings via Predictive Analytics and Route Optimization
Fuel still represents up to 60% of a vessel’s operating bill. Dynamic weather routing built into ABB’s OptimE module has cut bunker burn by as much as 8%, while predictive maintenance engines now intercept component failures days before a shutdown.[3]ABB Group, “OptimE Performance Savings White Paper,” abb.com These savings validate the rapid ROI message used by vendors and explain why cloud analytics modules enjoy double-digit growth inside the marine management software market. Digital twins let operators simulate a voyage, stress-test fuel mixes, and lock in cost-optimal speed profiles before lines are cast off.
Technological Advancements Including Integration of AI, IoT, and Cloud Computing
Kongsberg Digital has deployed AI agents that automate trim optimization, supported by IoT sensors funneling gigabytes of real-time hull data to Azure-based clouds. Machine-learning models now correlate engine load, sea-state, and weather to predict the most economical RPM. Software-as-a-Service pricing lowers entry barriers for smaller carriers, broadening the marine management software industry’s customer base. The network effect is tangible: as more vessels share anonymized data, algorithmic accuracy improves, giving early adopters a compounding efficiency edge.
Restraints Impact Analysis*
| Restraint | (~) % Impact on CAGR Forecast | Geographic Relevance | Impact Timeline |
|---|---|---|---|
| High integration costs and legacy system compatibility | -1.8% | Global | Short term (≤ 2 years) |
| Escalating cybersecurity vulnerabilities in OT/IT convergence | -1.2% | Global, higher in North America and EU | Medium term (2-4 years) |
| Lack of skilled personnel and training for advanced digital systems | -0.9% | Global | Long term (≥ 4 years) |
| Lack of common maritime data standards hindering interoperability | -0.7% | Global | Medium term (2-4 years) |
| Source: Mordor Intelligence | |||
High Integration Costs and Legacy System Compatibility
Retro-fitting a 20-year-old bulker with modern sensors can cost USD 50,000-200,000 per vessel. Proprietary engine-room interfaces often demand custom middleware that inflates project budgets. Many owners delay upgrades to avoid dry-dock downtime, which in peak charter markets can erode margin faster than digital tools recoup savings. Cloud APIs and plug-and-play edge gateways are easing this pain, but migration remains a hurdle that shades the marine management software market’s near-term growth.
Escalating Cybersecurity Vulnerabilities in OT/IT Convergence
The U.S. Coast Guard logged an 80% jump in ransomware incidents targeting maritime operations in 2024. As bridge systems, propulsion controls, and cargo manifests converge on the same IP backbone, malicious code can jump from a crew laptop to a dynamic positioning system in minutes. Pending U.S. rules effective July 2025 will force vessels to adopt strict cyber risk management plans, pushing security modules to the foreground of new software tenders but also escalating compliance costs.
*Our forecasts treat driver/restraint impacts as directional, not additive. The impact forecasts reflect baseline growth, mix effects, and variable interactions.
Segment Analysis
By Solution Type: Compliance Platforms Surge Ahead
Vessel and fleet management suites retained 41.85% revenue in 2025, anchoring the marine management software market. Compliance software, however, is expanding at 12.95% CAGR as operators wrestle with multi-jurisdictional carbon rules. These modules ingest fuel flowmeter signals, cross-match port call data, and output certified EU ETS statements, helping owners avoid cost-intensive manual audits. The marine management software market size for compliance solutions is projected to climb sharply as ETS coverage widens to methane and nitrous oxide after 2026.
Navigation and voyage optimization tools have gained momentum on the back of bunker-price volatility. Maintenance and spare-parts platforms round out spending as downtime avoidance remains a priority. Port and terminal authorities are deploying specialized berth-planning software to alleviate congestion, but the lion’s share of value still flows from ship-side licenses. Overall, integrated suites that blend fleet, compliance, and routing into a single UI are setting the pace in the marine management software industry.


By Deployment Mode: Cloud Acceleration Continues
Cloud deployments controlled 54.88% of 2025 revenue and are advancing at 15.05% CAGR, outpacing on-premises installations. Faster satellite links now synchronize sensor data with shoreside data lakes, enabling predictive algorithms to run continuously. This structural shift is pulling the marine management software market toward subscription pricing, flattening up-front capex and appealing to cash-constrained operators. The marine management software market size for cloud platforms is forecast to surpass on-premises revenue before 2027 if current adoption rates hold.
On-premises systems remain relevant where latency or sovereign-data rules dictate offline processing. Yet cloud vendors are rolling out edge devices that cache analytics onboard and sync during connectivity windows, closing functionality gaps. As IMO and EU cyber guidelines add auditing clauses, certified cloud environments may even outpace private servers on compliance grounds, reinforcing the pivot.
By Enterprise Size: SME Adoption Accelerates
Large carriers held 61.05% revenue in 2025 by deploying enterprise-wide platforms across extensive fleets. SMEs, however, represent the fastest-growing customer pool at 11.75% CAGR. Lower subscription thresholds, modular add-ons, and pay-as-you-sail billing help smaller owners access voyage analytics without hiring internal IT teams. As a result, the marine management software market is widening beyond its historic core of blue-chip container lines and tanker majors.
Vendor roadmaps now include packaged bundles targeting two-to-five-ship companies. Cloud marketplaces simplify procurement, while standardized APIs facilitate third-party chart, weather, and bunker-procurement integrations. This democratization aligns with regulators’ push to ensure that even small tonnage meets emissions reporting rules, injecting sustained momentum into the marine management software industry.
By Location: Onboard Systems Gain Momentum
Shore-side operations centers processed most data historically, reflecting 63.35% revenue in 2025. Improved onboard processors and edge analytics are shifting workloads back to the vessel, creating a hybrid architecture. Onboard modules are growing at 11.30% CAGR as real-time situational awareness becomes non-negotiable for autonomous trial voyages and DP-equipped offshore units. The marine management software market share for onboard analytics will continue to rise once 5G sea-lanes mature across Asia and Europe.
Edge setups analyze propulsion efficiency, hull fouling, and trim in seconds, issuing helm advisories without waiting for satellite round-trips. Critical functions such as collision-avoidance AI and remote engine diagnostics rely on this architecture. Ship-to-cloud synchronization then enriches the fleet data lake, feeding continuous model training.

By End-User: Offshore Energy Leads Growth
Commercial shipping captured 67.21% of revenue in 2025, but offshore energy vessels are the growth engine at 13.75% CAGR. Offshore wind projects require crew-transfer vessels, cable layers, and service operation ships that must hold precise station amid challenging weather, all of which elevates software needs. Consequently, the marine management software market size for offshore energy support is projected to double by 2030.
Cruise and ferry fleets deploy similar platforms but emphasize passenger safety, itinerary optimization, and hotel load management. Naval contracts demand hardened cybersecurity and bespoke mission-planning modules. Across segments, demand converges on integrated suites that merge navigation, asset health, and emissions reporting into a common dashboard.
Geography Analysis
North America generated 38.85% of global revenue in 2025, buoyed by stringent U.S. Coast Guard cyber rules and active vessel-retrofitting programs. Major container ports roll out digital twins to coordinate berths, while Arctic trade lanes spur Canadian investment in ice-navigation analytics. Ongoing public-private cybersecurity drills further encourage fleet managers to renew outdated software stacks.
Asia-Pacific is expanding at 16.25% CAGR through 2031, propelled by China’s shipbuilding scale, Japan’s autonomous ship consortia, and South Korea’s smart-yard programs. Government-subsidized 5G sea corridors allow continuous data streaming, elevating onboard system demand. Southeast Asian ports, racing to capture transshipment flows, adopt digital berth scheduling and emissions-accounting modules that feed regional growth in the marine management software market.
Europe sits between these poles, underpinned by far-reaching emissions regulation. The EU ETS widening to maritime from 2024 has driven rapid compliance platform uptake. Nordic operators pioneer zero-emission trials and hence require high-frequency data capture and AI-driven decision support. Southern European terminals invest in smart-gate and cargo-flow systems to stay competitive on Asia-Europe lanes, reinforcing regional demand.

Competitive Landscape
The market remains fragmented, featuring global IT groups and specialist maritime vendors. Oracle, ABB, Wärtsilä Voyage, and Kongsberg Digital promote platform breadth, whereas niche players refine modules such as bunkering optimization or crew planning. Consolidation is accelerating: Lloyd’s Register absorbed Ocean Technologies Group to marry training content with fleet analytics, and ABB added DTN’s weather-routing team to deepen its voyage optimization offer.
Integrated platform strategies now dominate boardroom agendas. Vendors embed AI engines that learn from cross-fleet datasets, convert raw sensor feeds into actionable alerts, and surface emissions dashboards that satisfy multiple regulators. Cybersecurity certifications—ISO 27001, IEC 62443—have become key differentiators as ransomware cases rise. Strategic alliances between satellite operators and software firms aim to guarantee low-latency data pipes, crucial for autonomous navigation pilots.
Competitive intensity is poised to heighten as Asia-based cloud giants eye the sector. Meanwhile, open-API ecosystems encourage third-party app development, locking customers into vendor marketplaces. The shift from perpetual licenses to scalable subscriptions reshapes revenue recognition but cements long-term client ties, supporting recurring cashflows for established incumbents.
Marine Management Software Industry Leaders
Oracle Corporation
ABB Ltd.
Wärtsilä Voyage
DNV – ShipManager
Navis (Kaleris)
- *Disclaimer: Major Players sorted in no particular order

Recent Industry Developments
- January 2025: BASS Software launched BASSnet Web 3.0, a cloud-based ship-management platform with AI analytics and enhanced cybersecurity.
- January 2025: The European Maritime Safety Agency activated full FuelEU Maritime requirements for vessels over 5,000 GT, mandating greenhouse-gas tracking. European Maritime Safety Agency
- December 2024: FTV Capital agreed to acquire Windward’s maritime intelligence unit for USD 271 million to bolster predictive risk analytics.
- June 2024: ABB completed its purchase of DTN’s weather-routing business, adding 85 specialists to expand voyage optimization services.


Global Marine Management Software Market Report Scope
The marine management software helps the boatyards, marinas, and boat dealers to manage complex supply chain operations efficiently and results in boosting performance. The software provides ship management data to the ship owners and managers and helps them make the operations leaner and more efficient.
The marine management software market is segmented by type (solution, services), by deployment (cloud, on-premises), by enterprise size (SMEs, large enterprises), by location (onboard, onshore), by end-user (defense, commercial), by geography (North America, Europe, Asia-Pacific, Latin America, Middle East and Africa). The market sizes and forecasts are provided in terms of value (USD) for all the above segments.
| Vessel/Fleet Management Software |
| Port and Terminal Management |
| Compliance and Risk / ESG Reporting |
| Navigation and Voyage Optimisation |
| Maintenance, Repair and Spare-Parts |
| Cloud |
| On-Premises |
| Small and Medium-sized Enterprises (SMEs) |
| Large Enterprises |
| Onboard Systems |
| Onshore / Shore-Side Systems |
| Commercial Shipping |
| Offshore Energy and OSVs |
| Cruise and Ferry |
| Marinas, Boatyards and Rental Operators |
| Defense / Naval |
| North America | United States | |
| Canada | ||
| Mexico | ||
| South America | Brazil | |
| Argentina | ||
| Rest of South America | ||
| Europe | United Kingdom | |
| Germany | ||
| France | ||
| Italy | ||
| Spain | ||
| Russia | ||
| Rest of Europe | ||
| Asia-Pacific | China | |
| Japan | ||
| India | ||
| South Korea | ||
| Australia and New Zealand | ||
| Rest of Asia-Pacific | ||
| Middle East and Africa | Middle East | Saudi Arabia |
| UAE | ||
| Turkey | ||
| Rest of Middle East | ||
| Africa | South Africa | |
| Nigeria | ||
| Kenya | ||
| Rest of Africa | ||
| By Solution Type | Vessel/Fleet Management Software | ||
| Port and Terminal Management | |||
| Compliance and Risk / ESG Reporting | |||
| Navigation and Voyage Optimisation | |||
| Maintenance, Repair and Spare-Parts | |||
| By Deployment Mode | Cloud | ||
| On-Premises | |||
| By Enterprise Size | Small and Medium-sized Enterprises (SMEs) | ||
| Large Enterprises | |||
| By Location | Onboard Systems | ||
| Onshore / Shore-Side Systems | |||
| By End-user | Commercial Shipping | ||
| Offshore Energy and OSVs | |||
| Cruise and Ferry | |||
| Marinas, Boatyards and Rental Operators | |||
| Defense / Naval | |||
| By Geography | North America | United States | |
| Canada | |||
| Mexico | |||
| South America | Brazil | ||
| Argentina | |||
| Rest of South America | |||
| Europe | United Kingdom | ||
| Germany | |||
| France | |||
| Italy | |||
| Spain | |||
| Russia | |||
| Rest of Europe | |||
| Asia-Pacific | China | ||
| Japan | |||
| India | |||
| South Korea | |||
| Australia and New Zealand | |||
| Rest of Asia-Pacific | |||
| Middle East and Africa | Middle East | Saudi Arabia | |
| UAE | |||
| Turkey | |||
| Rest of Middle East | |||
| Africa | South Africa | ||
| Nigeria | |||
| Kenya | |||
| Rest of Africa | |||


Key Questions Answered in the Report
What is the current value of the marine management software market?
The market stands at USD 4.96 billion in 2026 and is set to rise to USD 7.61 billion by 2031 at a 8.95% CAGR.
Which solution type is growing the fastest?
Compliance and risk-reporting platforms are expanding at 12.95% CAGR, driven by EU ETS and IMO carbon rules.
Why are cloud deployments gaining traction?
Cloud platforms cut hardware costs, enable predictive analytics, and already hold 54.88% of market revenue with 15.05% CAGR growth.
Which region will grow the quickest through 2031?
Asia-Pacific leads with a projected 16.25% CAGR thanks to large shipbuilding programs and digital port initiatives.
Page last updated on:


