
Market Overview
| Study Period | 2021 - 2031 |
|---|---|
| Market Size (2026) | USD 40.28 Billion |
| Market Size (2031) | USD 52.33 Billion |
| Growth Rate (2026 - 2031) | 5.68 % |
| Fastest Growing Market | Asia-Pacific |
| Largest Market | Europe |
| Market Concentration | Low |
Major Players *Disclaimer: Major Players sorted in no particular order Image © Mordor Intelligence. Reuse requires attribution under CC BY 4.0. | |
Nuts Market Analysis by Mordor Intelligence
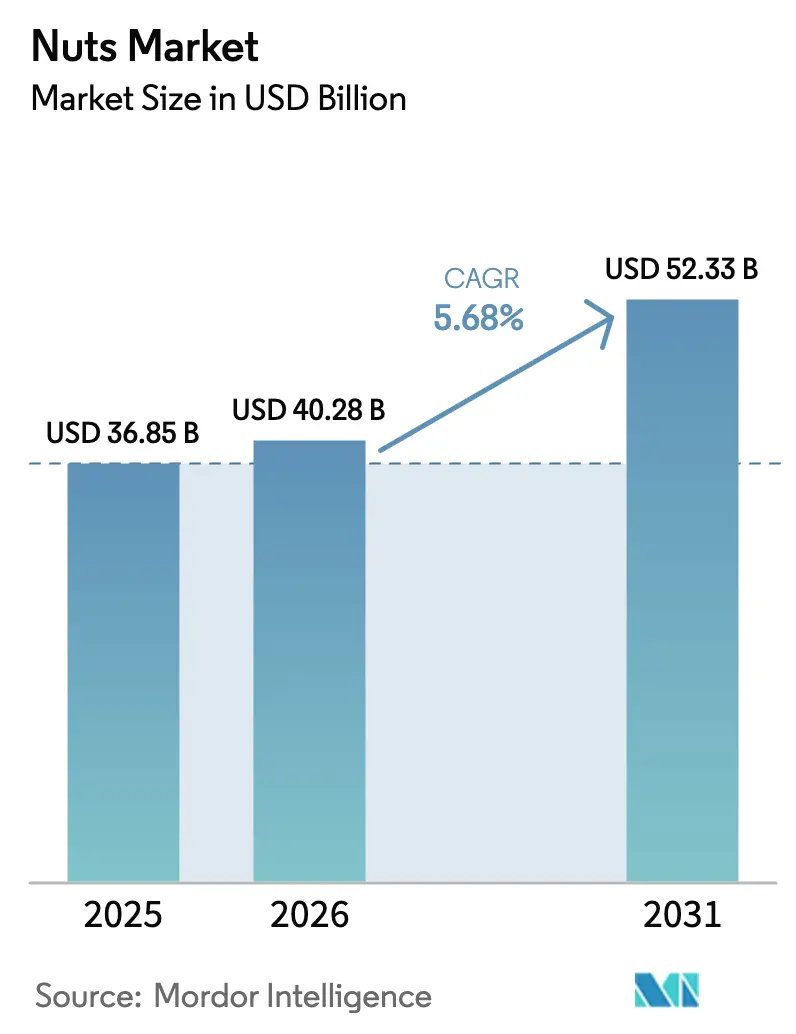
The Nuts Market size is projected to expand from USD 36.85 billion in 2025 and USD 40.28 billion in 2026 to USD 52.33 billion by 2031, registering a CAGR of 5.68% between 2026 to 2031. Accelerating demand for protein-dense snacks, the 2025 FDA “healthy” claim revision that explicitly covers tree nuts, and the 2025-2030 Dietary Guidelines for Americans positioning nuts as a core protein source are lifting retail visibility and institutional procurement. Policy tailwinds converge with tightening California water allocations that curbed 2024 almond output by 8% and sustained spot-price strength. Premiumization is evident in the rapid uptake of organic, flavored, and functional extensions, while e-commerce broadens the assortment beyond what physical shelves can support. Vertical integration among leading growers insulates supply chains yet raises industry entry barriers, keeping competitive intensity moderate.
Key Report Takeaways
- By type, almonds led with 28.28% of the nuts market share in 2025, while pistachios are forecast to post the highest CAGR at 6.45% through 2031.
- By category, conventional offerings held 75.22% of the Nuts market size in 2025, and organic products are projected to grow at 7.03% CAGR to 2031.
- By flavor, plain and salted formats captured 68.75% revenue in 2025; flavored variants are advancing at a 6.63% CAGR to 2031.
- By distribution channel, supermarkets and hypermarkets accounted for 48.23% of 2025 sales, whereas online retail is expanding at 7.02% CAGR over 2026-2031.
- By geography, Europe commanded 40.28% nuts market share in 2025, and Asia-Pacific is projected to be the fastest-growing region with a 6.89% CAGR to 2031.
Note: Market size and forecast figures in this report are generated using Mordor Intelligence’s proprietary estimation framework, updated with the latest available data and insights as of 2026.
Market Trends and Insights
Drivers Impact Analysis of Nuts Market*
| Driver | (~) % Impact on CAGR Forecast | Geographic Relevance | Impact Timeline |
|---|---|---|---|
| Nutritional Benefits Associated with Nuts Consumption | +0.8% | Global, with peak adoption in North America and Europe | Medium term (2-4 years) |
| Convenience and On-the-Go Snacking | +0.7% | Global, strongest in urban centers across Asia-Pacific and North America | Short term (≤ 2 years) |
| Product Innovation and Flavor Diversification | +0.6% | North America and Europe lead; Asia-Pacific following | Medium term (2-4 years) |
| Increased Interest in Organic and Natural Products | +0.5% | North America and Europe core; emerging in Asia-Pacific | Long term (≥ 4 years) |
| Technological Advancements in Packaging | +0.4% | Global, with regulatory push in EU and North America | Medium term (2-4 years) |
| Rising Demand for Raw and Minimally Processed Nuts | +0.5% | North America and Europe; niche adoption in Asia-Pacific | Long term (≥ 4 years) |
| Source: Mordor Intelligence | |||
Nutritional Benefits Associated with Nuts Consumption
Peer-reviewed meta-analyses published in 2024 and 2025 demonstrate that daily consumption of 28 grams of tree nuts reduces low-density lipoprotein cholesterol by 4% to 6% and lowers cardiovascular event risk by approximately 20% over five years, prompting cardiologists to recommend nuts as a first-line dietary intervention before statin therapy. The FDA's 2025 revision of its "healthy" claim criteria now permits manufacturers to highlight nuts' unsaturated fat profile on front-of-pack labels, a regulatory shift that elevates shelf appeal and justifies premium pricing[1]Source: U.S. Food and Drug Administration, “Use of the Term ‘Healthy’ in Food Labeling,” fda.gov. The 2025-2030 Dietary Guidelines for Americans explicitly list nuts among preferred protein sources, embedding them into school lunch programs and institutional foodservice contracts that collectively serve over 30 million meals daily. This policy endorsement creates a halo effect, as consumers perceive nuts as government-sanctioned health foods rather than indulgent snacks. Emerging research links pistachio consumption to improved glycemic control in pre-diabetic adults, opening pathways into clinical nutrition channels and diabetes-management programs. The convergence of regulatory approval, clinical evidence, and institutional adoption positions nuts as functional foods, driving sustained volume growth across demographic segments.
Convenience and On-the-Go Snacking
Urbanization and longer commute times have compressed meal occasions, with 42% of United States consumers reporting they skip breakfast at least twice weekly, creating demand for portable, nutrient-dense alternatives, according to the USDA Economic Research Service. Single-serve nut packs, typically 28 to 42 grams, fit into car cup holders, laptop bags, and gym lockers, aligning with micro-snacking behaviors that fragment traditional three-meal patterns. Retailers have responded by expanding checkout and impulse zones dedicated to grab-and-go formats, which command 15% to 20% price premiums over bulk packaging yet turn inventory faster. The rise of hybrid work schedules in 2025 further accelerates this trend, as employees stock home offices with shelf-stable snacks that require no refrigeration or preparation. Manufacturers are investing in resealable pouches and portion-control packaging that preserves freshness across multiple consumption occasions, addressing the key friction point of stale product after opening. Convenience stores in Asia-Pacific markets, particularly Japan and South Korea, now dedicate entire aisles to nuts and seeds, reflecting their integration into daily routines rather than occasional indulgence.
Product Innovation and Flavor Diversification
Flavor innovation has migrated beyond salt and honey-roasted to include sriracha-lime, truffle-parmesan, and Korean gochugaru blends, targeting millennials and Gen Z consumers who prioritize novel taste experiences over brand heritage. Blue Diamond's 2025 launch of a bold-flavored almond line featuring globally inspired seasonings achieved distribution in over 15,000 United States retail outlets within six months, demonstrating retailers' appetite for differentiated SKUs. The Wonderful Company introduced a pistachio-based protein powder in early 2026, extending the ingredient into smoothie and baking categories and capturing incremental occasions beyond snacking. Flavor diversification also serves a strategic purpose: it fragments the market, making it harder for private-label competitors to replicate entire portfolios and thereby protecting branded players' shelf space. Smaller producers leverage co-manufacturing relationships to test limited-edition flavors, matcha-wasabi, and maple-bourbon, using social media pre-orders to validate demand before committing to full production runs. This agile approach reduces inventory risk and generates buzz among food influencers, who amplify reach at minimal cost.
Increased Interest in Organic and Natural Products
USDA-certified organic nut acreage in California expanded by 12% between 2024 and 2025, driven by grower premiums that average 30% to 40% above conventional pricing and consumer willingness to pay retail premiums of 25% to 35%[2]Source: U.S. Department of Agriculture and U.S. Department of Health and Human Services, “Dietary Guidelines for Americans 2025-2030,” dietaryguidelines.gov. Organic certification prohibits synthetic pesticides and fertilizers, appealing to health-conscious buyers who perceive these products as safer and more environmentally sustainable. Retailers such as Whole Foods Market and Trader Joe's allocate disproportionate shelf space to organic nuts, reinforcing the perception that organic is the default choice for discerning shoppers. The European Union's Farm to Fork strategy, which targets 25% of agricultural land under organic management by 2030, is accelerating organic nut imports from Turkey and the United States to meet rising European demand. Clean-label trends intersect with organic growth, as consumers scrutinize ingredient lists and reject products containing artificial flavors, colors, or preservatives. Brands that combine organic certification with minimal processing, dry-roasted without oil, and lightly salted capture the intersection of health, transparency, and environmental stewardship, a positioning that commands loyalty and reduces price sensitivity.
Restraints Impact Analysis of Nuts Market*
| Restraint | (~) % Impact on CAGR Forecast | Geographic Relevance | Impact Timeline |
|---|---|---|---|
| Supply Chain Disruptions and Raw Material Shortages | -0.6% | North America (California), Middle East (Iran), Vietnam | Short term (≤ 2 years) |
| Tree Nut Allergies | -0.5% | Global, most acute in North America and Europe | Long term (≥ 4 years) |
| Competition from Fresh Nuts | -0.3% | North America and Europe with robust cold-chain infrastructure | Medium term (2-4 years) |
| Processing Complexity and Cost | -0.4% | Global, with margin pressure most severe in fragmented markets | Medium term (2-4 years) |
| Source: Mordor Intelligence | |||
Supply Chain Disruptions and Raw Material Shortages
California produces approximately 80% of the world's almonds and 50% of the United States pistachios, yet the state's 2024 almond harvest fell 8% below the five-year average due to drought-induced water allocations that restricted irrigation during the critical bloom period. The California Department of Water Resources projects that 2026 allocations will remain 20% below historical norms, compelling growers to fallow marginal acreage and prioritize high-value pistachio orchards over almonds. Iran, the world's largest pistachio exporter, faced export disruptions in 2024 due to geopolitical tensions and banking sanctions that delayed shipments and elevated freight costs by 15% to 25%. Vietnam's cashew processing sector, which handles 60% of global raw cashew imports, experienced labor shortages in 2025 as workers migrated to higher-wage manufacturing jobs, raising processing costs and extending lead times, according to the Vietnam Cashew Association[3]Source: Vietnam Cashew Association, “Industry Statistics,” vinacas.org.vn. These supply-side shocks compress processor margins and force brands to either absorb cost increases or pass them to consumers, risking volume declines in price-sensitive segments.
Tree Nut Allergies
Tree nut allergies affect 0.5% to 1.0% of the United States population, with prevalence rising among children born after 2010, and reactions range from mild hives to anaphylaxis requiring emergency epinephrine administration. The Food Allergen Labeling and Consumer Protection Act mandates that manufacturers declare tree nuts on ingredient panels and implement rigorous cleaning protocols to prevent cross-contact in shared facilities, adding compliance costs estimated at 5% to 8% of production expenses. Schools and daycare centers increasingly ban nuts to protect allergic children, eliminating a significant consumption occasion and reducing household purchase frequency. Foodservice operators face liability exposure, prompting many to remove nuts from menus or confine them to isolated prep areas, which shrinks the addressable market. Emerging immunotherapy treatments show promise in desensitizing allergic individuals, yet widespread adoption remains years away, leaving allergen concerns as a persistent headwind that constrains category penetration and innovation in multi-ingredient products.
*Our forecasts treat driver/restraint impacts as directional, not additive. The impact forecasts reflect baseline growth, mix effects, and variable interactions.
Nuts Market Segment Analysis
By Type:
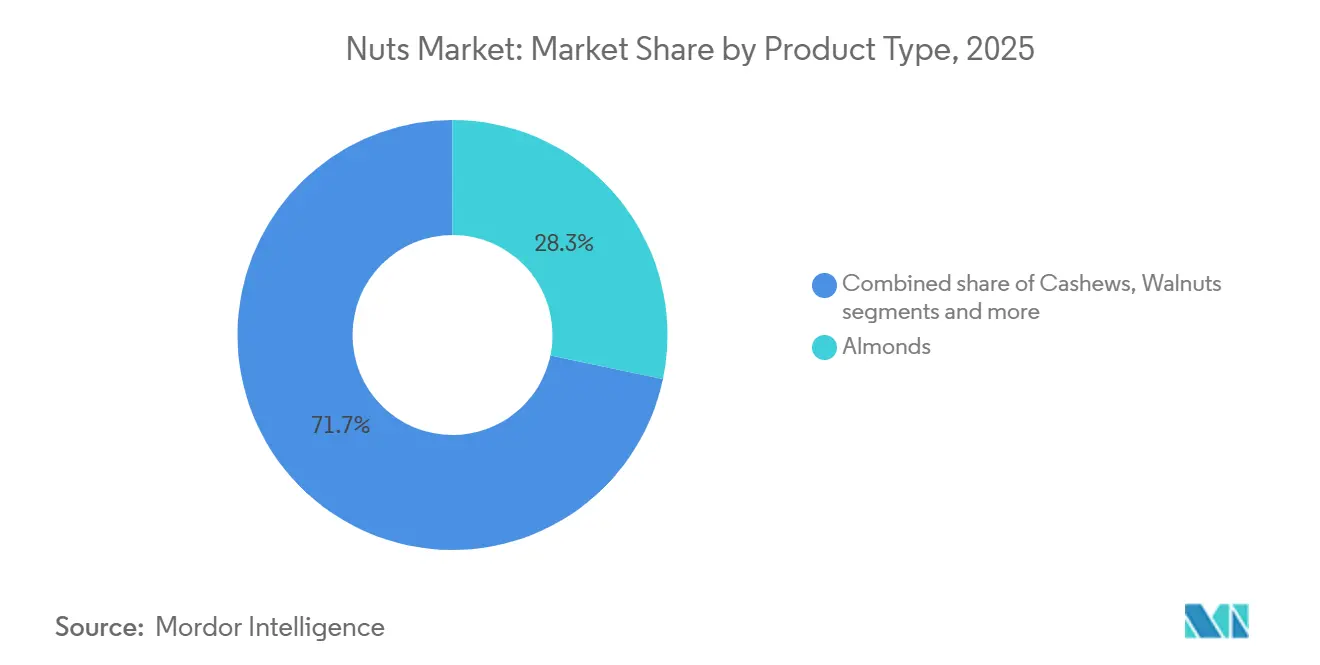
Pistachios Outpace Almonds on Health HaloIn 2025, almonds accounted for 28.28% of the market share, driven by their adaptability in snacking, baking, and plant-based milk. However, pistachios are expected to lead growth among all nuts, with a projected CAGR of 6.45% through 2031. Recent studies, including one published in the Journal of Nutrition, associate pistachios with benefits such as enhanced glycemic control and reduced inflammation markers, positioning them as a preferred functional snack for health-conscious and pre-diabetic consumers. The Wonderful Company leverages its vertically integrated operations, from California orchards to retail packaging, to drive innovation, as demonstrated by its planned 2026 launch of a pistachio-based protein powder, which expands pistachio applications into smoothies and baking. Walnuts appeal to older consumers seeking omega-3 fatty acids for cardiovascular health, but their shorter shelf life and susceptibility to rancidity limit their distribution in warmer regions without cold-chain infrastructure. Peanuts, though technically legumes, are perceived as tree nuts by consumers and dominate value-driven segments due to their lower production costs.
However, they face challenges from allergen concerns and a perception of lower nutritional value compared to tree nuts. Other nuts, such as hazelnuts, pecans, and macadamias, occupy niche markets: hazelnuts are prominent in European confectionery, pecans are popular in U.S. holiday baking, and macadamias are favored in Asia-Pacific premium gifting. California's 2024 pistachio harvest reached a record 1.6 billion pounds, reflecting a 10% increase from 2023, supported by favorable weather and maturing orchards planted in the early 2010s. This supply growth coincides with increasing consumer awareness of pistachios' protein content, 6 grams per ounce compared to 4 grams for cashews, creating a balanced demand-supply dynamic that supports volume growth without significant price increases. At the same time, almond processors, facing tighter margins due to drought-related yield declines, are shifting toward almond flour and almond butter to target higher-value applications. This strategic move helps stabilize revenue even as whole-nut sales stagnate. The contrasting trends of abundant pistachio supplies and limited almond availability are reshaping competitive dynamics, with brands reallocating marketing budgets to the rapidly growing pistachio segment to optimize returns.



By Category:
Organic Premiums Justify Certification CostsConventional nuts held 75.22% of market share in 2025, reflecting their price accessibility and ubiquity across retail channels, yet organic variants are expanding at 7.03% CAGR through 2031 as consumers prioritize transparency and environmental stewardship. USDA-certified organic nut acreage in California grew 12% between 2024 and 2025, driven by grower premiums averaging 30% to 40% above conventional pricing, which offset the higher labor and input costs associated with organic farming. Retailers such as Whole Foods Market allocate disproportionate shelf space to organic nuts, reinforcing consumer perception that organic is the default choice for health-conscious shoppers. The European Union's Farm to Fork strategy, targeting 25% of agricultural land under organic management by 2030, is accelerating organic nut imports from Turkey and the United States to meet rising European demand. Organic certification prohibits synthetic pesticides and fertilizers, appealing to buyers who perceive these products as safer and more environmentally sustainable, even as peer-reviewed studies find minimal nutritional differences between organic and conventional nuts. The willingness to pay retail premiums of 25% to 35% for organic nuts signals that purchasing decisions are driven by values and identity as much as by functional benefits, a dynamic that insulates organic players from price-based competition.
Clean-label trends intersect with organic growth, as consumers scrutinize ingredient lists and reject products containing artificial flavors, colors, or preservatives. Brands that combine organic certification with minimal processing, dry-roasted without oil, and lightly salted capture the intersection of health, transparency, and environmental stewardship. Conventional nuts remain dominant in foodservice and industrial channels, where cost considerations outweigh certification, yet even these segments are witnessing gradual organic penetration as institutional buyers respond to sustainability mandates and consumer pressure. The organic-conventional price gap has narrowed from 40% in 2020 to 30% in 2025, driven by scale economies as more acreage converts and processing infrastructure expands, suggesting that organic could approach parity in select categories by 2030.
By Flavor:
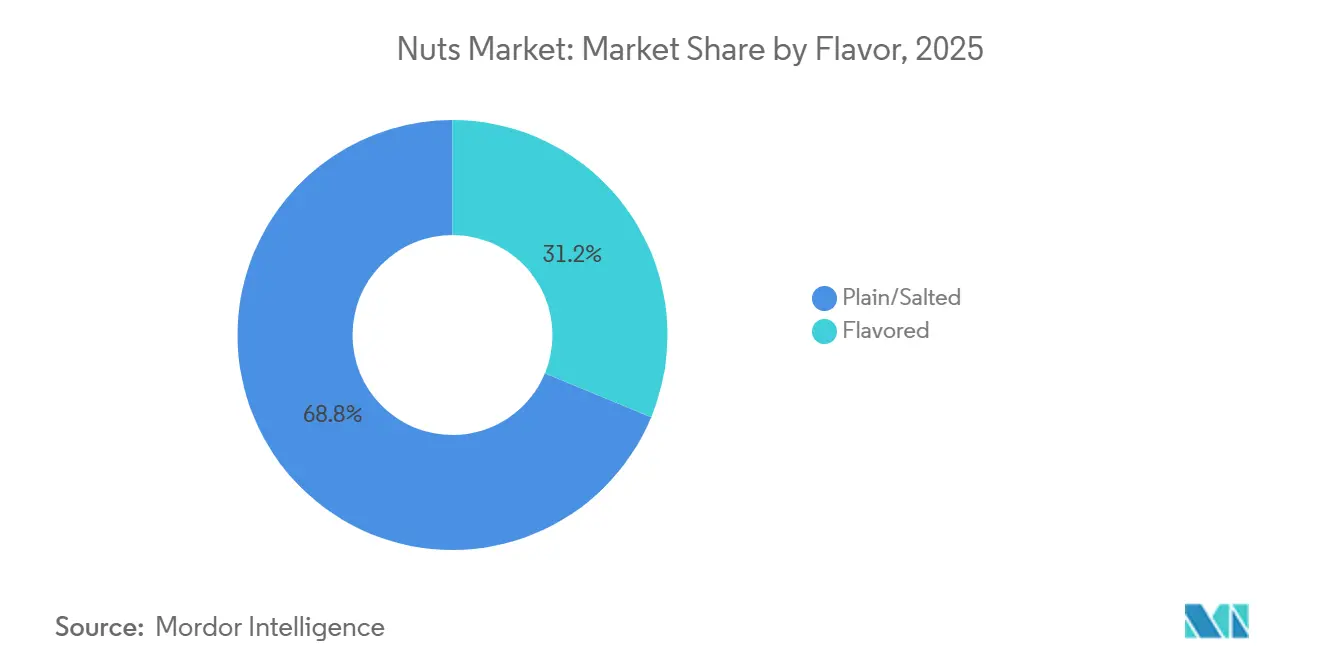
Plain leads while spicy and sweet coatings penetratePlain and salted nuts commanded 68.75% of market share in 2025, anchored by their versatility and broad demographic appeal, yet flavored varieties are projected to grow at 6.63% CAGR through 2031 as brands target millennials and Gen Z consumers who prioritize novel taste experiences. Flavor innovation fragments the market, making it harder for private-label competitors to replicate entire portfolios and thereby protecting branded players' shelf space and pricing power. Smaller producers leverage co-manufacturing relationships to test limited-edition flavors, matcha-wasabi, and maple-bourbon, using social media pre-orders to validate demand before committing to full production runs, an agile approach that reduces inventory risk and generates buzz among food influencers. Honey-roasted variants remain popular in North America, yet their higher sugar content conflicts with clean-label trends, prompting reformulations that use date syrup or monk fruit as natural sweeteners.
Globally inspired flavors reflect increasing culinary diversity and travel exposure, with consumers seeking authentic taste profiles that evoke specific cuisines or regions. Tandoori-spiced cashews, za'atar almonds, and chili-lime peanuts bridge snacking and meal occasions, positioning nuts as accompaniments to craft beer or charcuterie boards rather than standalone snacks. This repositioning elevates nuts from commodity to premium, justifying price points 20% to 30% above plain varieties. Plain and salted formats retain dominance in foodservice and industrial channels, where cost and versatility outweigh flavor differentiation, yet even these segments are witnessing gradual flavor penetration as operators seek menu differentiation. The flavor-plain price gap has widened from 15% in 2020 to 25% in 2025, driven by higher ingredient costs and smaller production runs, suggesting that flavored nuts will remain a premium tier rather than mass-market default.
By Distribution Channels:
E-Commerce Disrupts Shelf AllocationSupermarkets and hypermarkets accounted for 48.23% of distribution in 2025, leveraging their scale to negotiate favorable terms with suppliers and offer competitive pricing, yet online retail is expanding at 7.02% CAGR through 2031 as consumers prize convenience and assortment breadth. Amazon's Subscribe & Save program, which offers 5% to 15% discounts on recurring nut deliveries, has captured an estimated 12% of United States online nut sales, creating predictable revenue streams for brands and reducing customer acquisition costs. Direct-to-consumer brands such as NatureBox and Thrive Market bypass traditional retail, using subscription models to build customer databases and gather zero-party data that inform product development and personalized marketing. E-commerce platforms enable long-tail assortment, heirloom walnut varieties, single-origin cashews, and rare macadamias that physical stores cannot economically stock, appealing to enthusiasts willing to pay premiums for provenance and uniqueness.
Convenience and grocery stores captured a smaller share but serve critical impulse and top-up occasions, particularly in urban centers where consumers shop multiple times weekly. These channels prioritize single-serve formats and high-turnover SKUs, limiting assortment but achieving higher sales per square foot than larger formats. Other distribution channels, including specialty stores, health food outlets, and vending machines, cater to niche segments and premium positioning, often featuring organic, raw, or exotic nut varieties. Vending machines in gyms and office buildings have increasingly stocked nuts as healthier alternatives to chips and candy, reflecting institutional wellness initiatives and consumer demand for protein-rich snacks. Supermarkets and hypermarkets retain advantages in price competitiveness and immediacy, yet their share erosion to online and convenience channels signals a fragmentation of shopping behaviors that requires omnichannel strategies to maintain market presence.
Geography Analysis
Europe Nuts Market
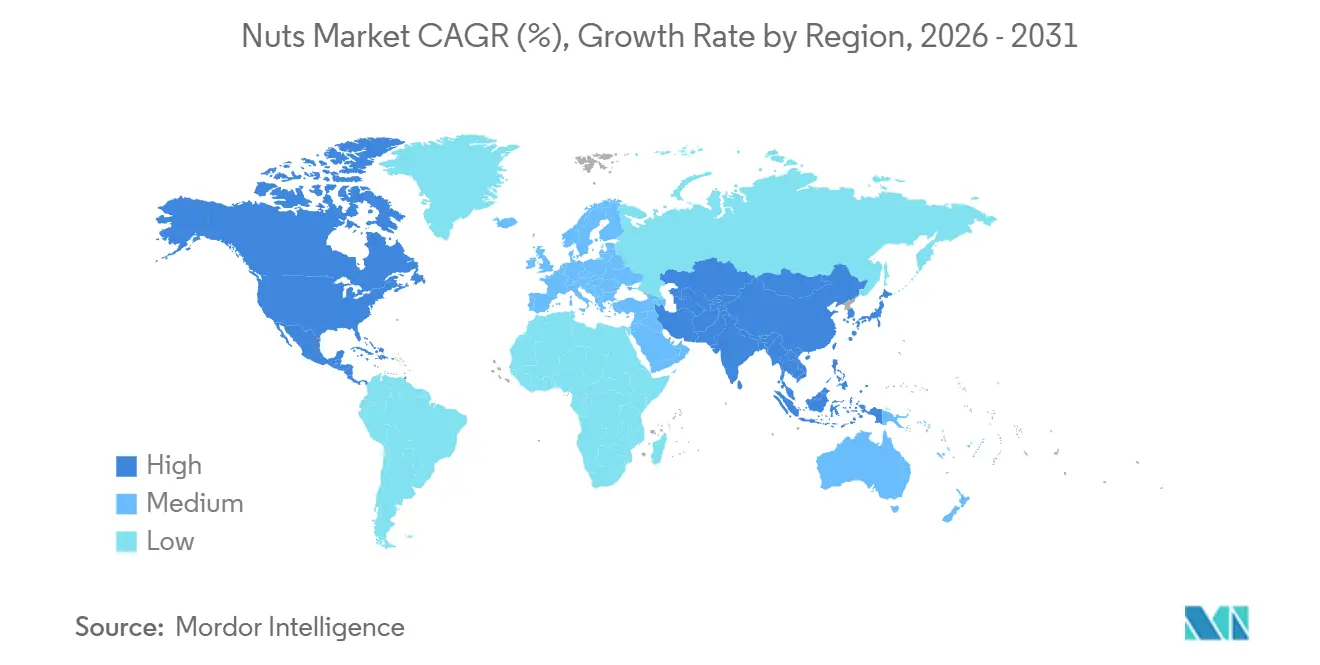
In 2025, Europe accounted for 40.28% of global revenue, with Germany and the UK surpassing an annual intake of 3 kilograms per capita. The EU's 'Farm to Fork' strategy is driving an increase in organic imports from Turkey and the U.S., aiming to promote sustainable food systems. Additionally, France's strong demand for protected-designation hazelnuts sustains a significant 30-40% price premium, reflecting the value placed on quality and origin. Spain's extensive almond orchards play a crucial role in supporting intra-EU trade, while the Netherlands has established itself as a vital re-export hub, facilitating the distribution of nuts across Europe.
APAC Nuts Market
Asia-Pacific, led by China's expanding middle class and India's cultural tradition of festive gifting, is experiencing the fastest growth with a 6.89% CAGR. Chinese e-commerce giants are leveraging holiday seasons by bundling nuts with dried fruits in promotional packages, enhancing consumer appeal. In India, cashew processing not only anchors local employment but also presents untapped potential for increased household consumption. Japan's aging population is driving demand for walnuts due to their omega-3 health benefits, while South Korea's preference for honey-butter almonds highlights the growing importance of flavor localization in the region. Australia's macadamia exports cater to the premium gifting market in Asia, and Vietnam's large-scale processing capabilities remain a cornerstone of the global cashew supply chain, ensuring consistent supply to international markets.
The Americas and Middle East Nuts Market
North America, with a stable per-capita consumption of 2.5 kilograms, continues to achieve mid-single-digit growth, fueled by the rising popularity of organic products and innovative flavor options. Canada remains a net importer of nuts, while Mexico's young and urban demographic is increasingly adopting nuts as a healthier snacking alternative, reflecting a shift in dietary preferences. In South America, although overall consumption remains modest, it is steadily increasing. Brazil is leveraging its native Brazil nuts to strengthen its position in the market, while Argentina is showing a growing inclination toward almonds and walnuts. In the Middle East, the hospitality sector demonstrates a strong preference for premium pistachios and almonds, driven by consumer demand for high-quality products. Furthermore, Saudi Arabia's Vision 2030 initiative is actively investing in domestic roasting capacities, aiming to enhance value retention and reduce reliance on imports.

Regulatory Landscape
Regulation in the nuts market centers on food labeling, allergen management, and contaminant limits that shape how packaged nut snacks and nut-based ingredients are formulated and sold across borders. In the United States, the FDA revised the definition of the voluntary "healthy" nutrient content claim in 2025, explicitly enabling eligible nuts to carry the claim when they meet updated criteria. Mandatory allergen disclosure also remains a core compliance requirement for tree nuts in finished foods, driving investments in segregation, sanitation validation, and supplier assurance across shared facilities.
In Europe, contaminants and pesticide-residue compliance is tightening, with the European Commission progressing work on maximum levels for mineral oil aromatic hydrocarbons (MOAH), with adoption targeted for October 2026 and industry guidance tracked by the International Nut and Dried Fruit Council (INC). Exporters shipping into the EU also face a shifting residue-control environment as implementing regulations for pesticide residues in food and feed and coordinated control activity for 2027-2029 move into effect from January 1, 2027. On trade and phytosanitary controls, Turkiye published a revised Regulation on Plant Quarantine in its Official Gazette (No. 33245) on May 6, 2026, effective August 4, 2026, affecting documentation and inspection expectations for nuts moving through Turkiye-linked supply chains.
Value Chain Analysis
The global nuts value chain runs from orchard and farm production, including almonds and pistachios in California, cashews tied to Vietnam processing flows, and pistachios linked to Iran export channels, through primary handling, shelling, sorting, roasting or seasoning, and packaging, then into wholesale, retail, and foodservice. Upstream economics are shaped by agronomic inputs and water availability, with growers highlighting electricity for irrigation pumping and fertilizer as key cost drivers that affect yield potential and harvest quality. Supply volatility in major origins can transmit quickly into processor margins and contract pricing, reinforcing the role of long-term grower relationships and forward buying for branded packers.
Midstream consolidation and automation influence competitiveness, as larger players use integrated processing and packaging to control quality and reduce labor intensity. Blue Diamond Growers consolidating manufacturing operations into its Turlock and Salida, California plants while exiting its historic Midtown Sacramento facility concentrates throughput in fewer sites and can simplify quality systems, logistics, and SKU changeovers. Downstream, supermarkets and hypermarkets remain the largest channel by value, while online subscriptions and direct-to-consumer models expand assortment and accelerate feedback loops on flavor innovation, increasing the importance of packaging performance and traceability documentation to satisfy retailer and platform requirements.
Competitive Landscape
The nuts market, marked by its high level of fragmentation, presents significant opportunities for both market consolidation and the development of specialized strategies across various product categories and geographic regions. This fragmentation arises primarily from the agricultural nature of the industry, where production occurs across a wide range of climatic zones and farming operations, making centralized control and standardization a complex endeavor. Furthermore, the processing and distribution stages demand a nuanced understanding of local market dynamics and supply chain intricacies, which further amplifies the fragmented structure of the market.
Prominent industry players such as Blue Diamond Growers, Hormel Foods Corporation, and Wonderful Company capitalize on vertical integration to maintain product quality, manage operational costs, and streamline their processes. In contrast, numerous regional processors and niche brands establish their market presence by focusing on differentiation, leveraging innovation, and implementing strategies that cater to specific consumer demands and preferences.
In this competitive and evolving landscape, the integration of advanced technology has emerged as a critical factor in driving operational efficiency and ensuring superior product quality. Companies are increasingly investing in state-of-the-art automated processing systems designed for grading, sorting, roasting, seasoning, and packaging. These technological advancements not only help reduce labor costs but also ensure consistent product quality, which is vital for building consumer trust and complying with stringent regulatory requirements. By adopting such innovations, companies are better positioned to meet the growing demand for high-quality nuts while maintaining a competitive edge in the market.
Nuts Industry Leaders
Blue Diamond Growers
Hormel Foods Corporation
The Wonderful Company
Baja Food Industries Company
Mariani Nut Company
- *Disclaimer: Major Players sorted in no particular order

Nuts Market Companies Covered in this Report
- Blue Diamond Growers
- Hormel Foods Corporation
- The Wonderful Company
- Baja Food Industries Company
- John B. Sanfilippo & Son Inc.
- Mariani Nut Company
- Royal Nut Company
- Savola Group
- Tierra Farm
- Severn Peanut Company, Inc. (Hampton Farms)
- HBS Natural Choice
- Ludlow Nut Co. Ltd.
- Sun Organic Farms
- Best Food Company LLC
- Germack Pistachio Company
- Hines Nut Company
- Three Squirrels Inc.
- Synder's-Lance, Inc.
- Mount Franklin Foods, LLC
- Best Food Company LLC

Market Opportunities and Future Outlook
Opportunities are widening where nuts intersect with functional nutrition, ingredient expansion, and omnichannel merchandising. Product-line moves into adjacent use cases, including Blue Diamond Growers launching a Blue Diamond Almondmilk line in February 2026 and the Wonderful Company introducing a pistachio-based protein powder in early 2026, show how branded nut players are pursuing beverage and powder formats that add consumption occasions beyond traditional snacking. This creates additional room for nut-based inclusions and ingredients such as protein, flour, and butters in breakfast and smoothie routines, alongside better-for-you reformulations that align with the FDA "healthy" claim update from 2025.
A second opportunity area is compliance-led differentiation in export markets, where digital traceability and tiered certifications, including GFSI-recognized schemes and organic, function as an entry ticket for multinational retail and food manufacturing supply. Regulatory momentum in Europe around MOAH maximum levels targeted for October 2026 and evolving pesticide-residue controls from 2027 increases demand for strengthened supplier verification, testing, and packaging barrier performance, rewarding processors that can document controls at lot level. Brand investment in demand creation also remains active, illustrated by Blue Diamond Growers refreshing its brand identity in June 2026 after more than 20 years, which provides a platform for premiumization and portfolio expansion across flavors and formats in high-visibility retail sets and e-commerce.
Recent Industry Developments in Nuts Market
- May 2026: Blue Diamond Growers issued a 2026 almond crop estimate of 2.69 billion pounds. The announced figure informs procurement planning and price dynamics across retail and institutional channels, reinforcing supply visibility. The update strengthens the company's ability to align production with growing demand for premium almonds.
- February 2026: Blue Diamond Growers launched Blue Diamond Almondmilk line in four varieties. The direct product expansion in the almond milk category extends the brand's portfolio and taps into the premiumization trend in plant-based beverages. The move broadens retail presence and supports higher margin opportunities through category diversification.
- January 2026: Blue Diamond Growers announced BD Almond Breeze partnership with Jonas Brothers. The collaboration increases consumer visibility and access through entertainment aligned marketing. The partnership can boost almond product engagement and drive demand through cross promotional channels.


Nuts Market Report Scope and Research Methodology
Market Definition and Coverage
For this study, the nuts market covers packaged edible nuts sold for direct consumption and for ingredient use, across common nut types, flavors, and organic or conventional positioning, with values tracked at the point of sale into trade channels.
Scope exclusions: This sizing excludes nut-based beverages, nut oils, and nut-derived spreads where the primary value comes from downstream processing rather than whole or processed nut products.
Segments Covered in This Report
- By Type
- Almonds
- Cashews
- Walnuts
- Peanuts
- Pistachios
- Other Product Types
- By Category
- Conventional
- Organic
- By Flavor
- Plain/Salted
- Flavored
- By Distribution Channels
- Supermarkets/Hypermarkets
- Convenience/Grocery Stores
- Online Stores
- Other Distribution Channels
- By Geography
- North America
- United States
- Canada
- Mexico
- Rest of North America
- Europe
- Germany
- United Kingdom
- France
- Italy
- Spain
- Netherlands
- Sweden
- Poland
- Belgium
- Rest of Europe
- Asia-Pacific
- China
- India
- Japan
- Australia
- South Korea
- Vietnam
- Indonesia
- Rest of Asia-Pacific
- South America
- Brazil
- Argentina
- Chile
- Peru
- Colombia
- Rest of South America
- Middle East and Africa
- United Arab Emirates
- Saudi Arabia
- South Africa
- Nigeria
- Rest of Middle East and Africa
- North America
Data Sources, Market Sizing, and Validation
Desk Research
Desk research was used to build the demand and supply context first, and then to create guardrails for the model so the totals stayed realistic by region and by major nut types. We relied on public production and trade series to understand the available supply pool, and then cross-checked them against consumption and retail indicators where they were published.
Key public sources included items such as USDA FAS tree nuts and peanuts reports, UN Comtrade trade statistics, FAOSTAT production and yield series, and International Nut and Dried Fruit Council statistical summaries. Additional context was taken from government food agencies and customs releases, along with peer reviewed nutrition and food science articles that help explain consumer shifts toward nuts. Company filings, investor presentations, and reputable press were also reviewed, and a paid subscription database for company financials and another for shipment level import export signals were used selectively to sanity check volumes and price direction. These sources are illustrative rather than exhaustive, and many other references were also used for data collection, validation, and research clarification.
Primary Interviews and Surveys
Primary work was carried out through expert interviews and structured surveys with stakeholders across growing, processing, trading, and retail facing roles, so the assumptions on prices, mix shifts, and channel movement could be checked. Our questions focused on recent pricing behavior, contract timing, packaging and flavor premium, and how demand moved between retail and foodservice, which then helped close gaps left by public statistics across regions.
Distribution of primary research fieldwork respondents
| Company type | Respondent position | Region |
|---|---|---|
| Top tier: 38% | CXOs: 19% | APAC: 42% |
| Mid tier: 43% | Functional/Unit leaders: 32% | EMEA: 32% |
| Smaller Players: 19% | Managers: 49% | Americas: 26% |
Market-Sizing & Forecasting
Market size was built using a top-down and bottom-up blend, where production, trade flows, and apparent consumption signals were used to reconstruct the demand pool for major nut types, and then converted into value using region-appropriate pricing and mix assumptions. To keep the totals realistic, we corroborated the output with selective bottom-up approximations, such as sampled price per kg by channel, export price checks, and a supplier and distributor roll-up in markets where public coverage is thinner.
Inputs that mattered in the model included harvested area and yield trends for major nut crops, export and import volumes for key consuming regions, shifting shares of salted versus flavored packs, organic versus conventional price gaps, and channel mix between supermarkets, convenience retail, and online. Where primary responses showed short-term price spikes or contract resets, those were reflected as phased price changes rather than a single step change. Forecasting was done using scenario analysis supported by simple time-series smoothing for stable variables, followed by expert-led adjustments for weather-driven supply swings and demand elasticity by region. If a data series was missing, proxy ratios were applied (for example, using trade as a share of supply in similar markets) and later rechecked through interviews.
Data Validation & Update Cycle
Results were validated through triangulation across supply side totals, trade values, and channel level price checks, and then reviewed for outliers like sudden volume jumps without matching price movement. We also compared the final outputs with independent signals such as crop year outlook revisions and changes in major importing regions, and any large variance triggered a re-check of assumptions and, when needed, follow-up calls.
Before sign-off, the model goes through multi-step analyst review where calculations, unit conversions, and currency timing are re-verified. Reports are refreshed annually, with interim updates when material events affect supply, trade, or pricing. Right before delivery, a fresh validation pass is completed so clients receive the latest updated view.
Mordor Intelligence's Nut Market Size Compared With Other Published Estimates
Published market sizes for nuts often do not match because each publisher chooses its own product scope, pricing basis, and year definitions, and then applies different checks to reconcile production, trade, and consumption. Differences also come from how flavored and premium packs are priced, how peanuts are treated versus tree nuts, and whether the value is captured at bulk trade or at packaged retail.
The main gap comes from whether bulk peanuts and industrial ingredient volumes are counted at commodity trade prices or filtered toward packaged, consumer-facing nut sales, and Mordor Intelligence keeps the scope tied to defined nut products across retail channels with price and mix refreshed against recent trade and category movement before forecasting.
Benchmark comparison
| Source | Market Size | Gaps in Research Methodology |
|---|---|---|
| Mordor Intelligence | USD 40.28 B (2026) | |
| Industry Association A | USD 35.65 B (2020) | Uses supply value built from production multiplied by an average unit price on a customs paid basis, which can undercount retail margins and packaged premiumization and also reflects an earlier pricing cycle. |
| Trade Journal B | USD 7.10 B (2024) | Captures only imported tree nuts for a single region in value terms, so it excludes domestic production, non-import channels, and peanuts, which makes it structurally smaller than a global market view. |
The comparison shows that the widest swings are explained by scope and pricing basis first, and only then by forecasting style. When supply-at-customs values or single-region import totals are treated as the whole market, the number naturally comes out lower than a packaged, channel-tracked view. By keeping assumptions traceable to production and trade signals and then validating pricing and mix through primary checks, the estimate stays consistent and repeatable even when individual nut crops have volatile seasons.


Key Questions Answered in the Report
What is the projected value of the nuts market in 2031?
The market is forecast to reach USD 52.33 billion by 2031.
Which nut type is expected to grow fastest to 2031?
Pistachios are projected to advance at a 6.45% CAGR through 2031.
How large is the organic share within the category?
Organic products represented 24.78% of 2025 sales and are expanding at a 7.03% CAGR.
Which region shows the highest growth outlook?
Asia-Pacific is set to grow at a 6.89% CAGR between 2026-2031.
Page last updated on:


 Your data is secure and never sold or shared.


