
Market Overview
| Study Period | 2021 - 2031 |
|---|---|
| Forecast Data Period | 2026 - 2031 |
| Base Year Market Size (2025) | USD 4.21 Billion |
| Market Size (2026) | USD 4.38 Billion |
| Market Size (2031) | USD 5.31 Billion |
| Growth Rate (2026 - 2031) | 3.96 % |
| Market Concentration | Medium |
Major Players
*Disclaimer: Major Players sorted in no particular order Image © Mordor Intelligence. Reuse requires attribution under CC BY 4.0. |
|
North America Jam, Jelly, And Preserve Market Analysis by Mordor Intelligence
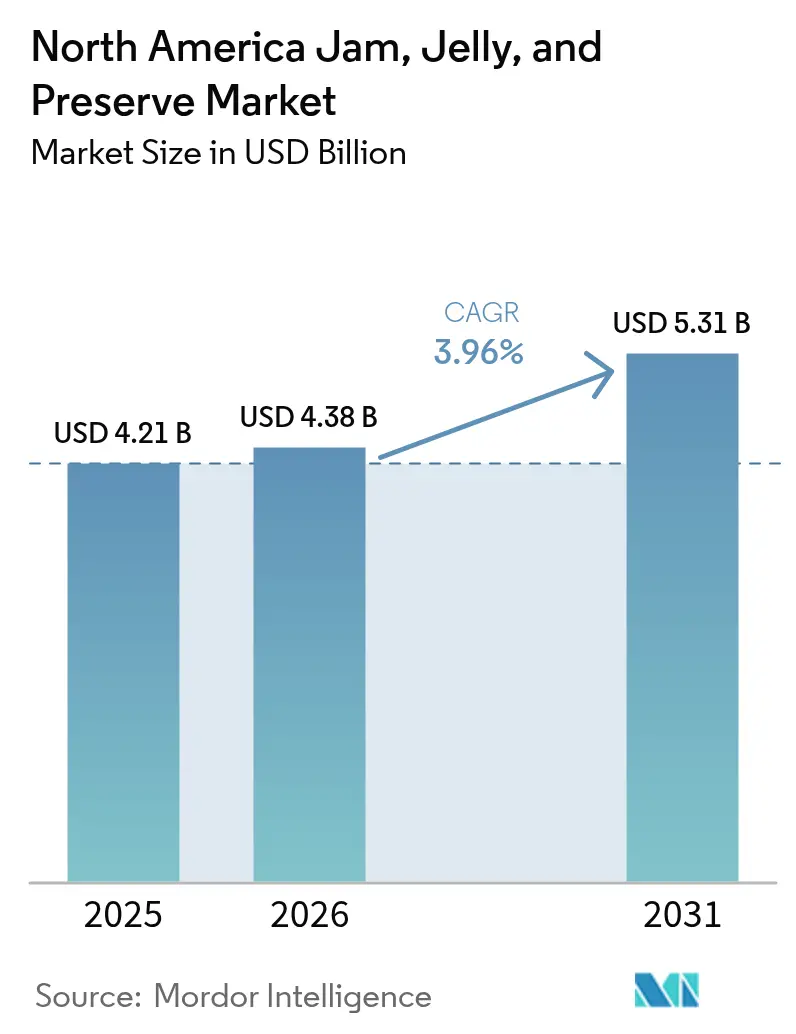
The jam, jelly, and preserve market size in North America is expected to grow from USD 4.21 billion in 2025 to USD 4.38 billion in 2026 and is forecast to reach USD 5.31 billion by 2031 at 3.96% CAGR over 2026-2031. Heightened demand for organic, reduced-sugar, and premium artisanal variants is steering consumers away from legacy sugar-laden offerings, while regulatory frameworks such as FDA 21 CFR Part 150 and USDA 7 CFR 205 continue to shape formulation boundaries. Private-label pressure, ingredient-cost inflation, and shifting breakfast routines are intensifying competition, yet packaging innovation and flavor diversification are unlocking incremental occasions across retail, e-commerce, and foodservice channels. Geographically, the United States dominates value contribution, but Mexico is the fastest-growing territory as rising disposable incomes and NOM-051 labeling rules boost demand for imported, health-positioned spreads. Overall, the market is navigating a structural pivot toward wellness-centric, traceability-backed offerings that command price premiums and defend margins amid commodity volatility.
Key Report Takeaways
- By product type, jam and jelly captured 63.68% of the jam, jelly, preserve market share in 2025, while preserves are expanding at a 5.25% CAGR through 2031.
- By packaging type, bottles and jars held 80.75% of 2025 revenue; pouches and sachets are growing at a 5.55% CAGR through 2031.
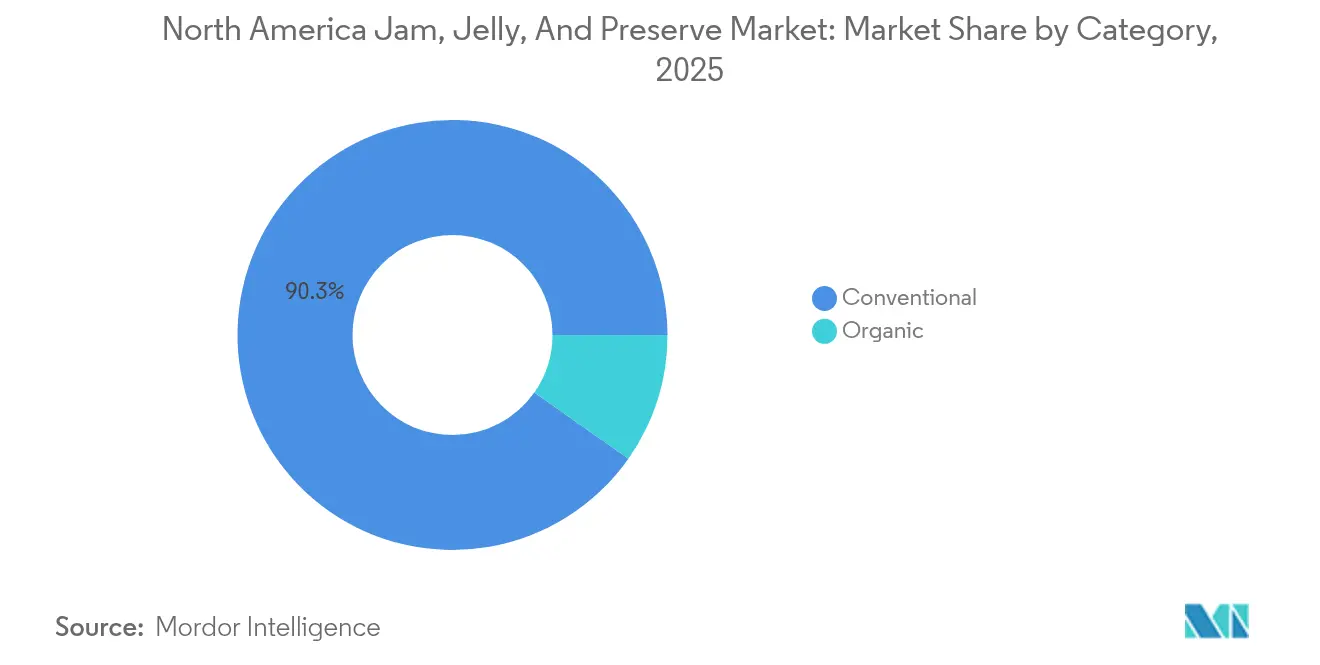
- By category, conventional items accounted for 90.25% of 2025 value; organic offerings are rising at a 6.01% CAGR through 2031.
- By distribution channel, off-trade commanded 67.50% of 2025 sales, whereas on-trade is rebounding at a 5.39% CAGR through 2031.
- By geography, the United States contributed 72.85% of 2025 revenue, while Mexico is advancing at a 4.93% CAGR to 2031.
Note: Market size and forecast figures in this report are generated using Mordor Intelligence’s proprietary estimation framework, updated with the latest available data and insights as of 2026.
North America Jam, Jelly, And Preserve Market Trends and Insights
Drivers Impact Analysis*
| Driver | (~) % Impact on CAGR Forecast | Geographic Relevance | Impact Timeline |
|---|---|---|---|
| Rising consumer demand for natural and organic fruit spreads | +0.9% | United States, Canada; spillover to Mexico premium segments | Medium term (2-4 years) |
| Growing preference for healthier alternatives with reduced sugar or no added preservatives | +0.8% | United States, Canada; accelerating in Mexico due to NOM-051 | Short term (≤ 2 years) |
| Increasing popularity of premium, artisanal, and gourmet jams and preserves | +0.7% | United States (coastal urban centers), Canada (Toronto, Vancouver) | Medium term (2-4 years) |
| Innovations in flavor profiles and product variety | +0.6% | North America-wide, with early adoption in United States specialty retail | Short term (≤ 2 years) |
| Increase in consumer awareness regarding the benefits of fruit-based products | +0.5% | United States, Canada; emerging in Mexico urban markets | Long term (≥ 4 years) |
| Growth of the health and wellness trend influencing the demand for fruit spreads | +0.4% | United States, Canada; Mexico following with 2-3 year lag | Long term (≥ 4 years) |
| Source: Mordor Intelligence | |||
Rising consumer demand for natural and organic fruit spreads
Rising consumer demand for natural and organic fruit spreads is a key driver of the North American jam, jelly, and preserve market. Health-conscious consumers increasingly prefer products made with clean-label ingredients, minimal processing, and no artificial additives. According to the Organic Trade Association, 90% of Generation Z consumers (ages 13–28) identify as committed or new organic consumers, accelerating this trend through their purchasing influence and social media advocacy[1]Source: Organic Trade Association, “2024 U.S. Organic Industry Survey,” ota.com. Growing awareness of the benefits of natural fruit sugars and plant-based diets further fuels demand. In response, manufacturers are innovating with organic certifications, sustainably sourced fruits, and reduced-sugar formulations. Premium and artisanal brands are expanding preservative-free and functional flavor offerings to align with wellness preferences. Retailers, meanwhile, are dedicating greater shelf space to organic and specialty spreads, reinforcing their strong market momentum.
Growing preference for healthier alternatives with reduced sugar or no added preservatives
The growing preference for healthier alternatives with reduced sugar or no added preservatives is a significant driver of the North American jam, jelly, and preserve market. Consumers are becoming increasingly aware of the health risks associated with excessive sugar intake and artificial ingredients. In 2024, the United States had an adult population of about 245.5 million, with diabetes affecting 13.7% of adults, equivalent to roughly 38.5 million adult cases [2]Source: International Diabetes Federation, "Diabetes in the United States of America (2024)", idf.org.This shift in perception has led to a strong demand for natural, fruit-based spreads with clean labels. Manufacturers are reformulating products using natural sweeteners like stevia and agave to meet evolving health standards. The trend is particularly prominent among millennials and Gen Z, who actively seek transparency and nutritional value. Premium and artisanal brands are leveraging this demand to introduce low-sugar, preservative-free innovations. As a result, healthier variants are capturing greater market share and redefining category growth in the region.
Increasing popularity of premium, artisanal, and gourmet jams and preserves
Increasing popularity of premium, artisanal, and gourmet jams and preserves is a key driver of the North America jam, jelly, and preserve market. Health- and quality-conscious consumers are trading up from mass-market spreads to products featuring high fruit content, unique flavor combinations, and minimal additives. Fast-paced lifestyles in the U.S. are driving demand for such convenient yet indulgent options, particularly among dual-income households that can afford to pay more for quality. The U.S. Census Bureau reported a 4.0% rise in real median household income to USD 80,610 in 2023 from USD 77,540 in 2022, further supporting willingness to spend on premium spreads [3] Source: U.S. Census Bureau, "Income in the United States: 2023", census.gov . Premium and artisanal producers emphasize authenticity, origin stories, and traditional preparation methods to differentiate their offerings. Gourmet variants incorporating exotic fruits, spice infusions, and organic ingredients are gaining traction in urban and affluent segments.
Innovations in flavor profiles and product variety
Innovations in flavor profiles and product variety are strongly propelling the North America jam, jelly, and preserve market. Brands are moving beyond traditional strawberry and grape to introduce exotic fruits, superfruit blends, and botanical or spice-infused variants. Hybrid formats, such as jams with chia seeds, nuts, or functional ingredients, cater to consumers seeking both taste and added health benefits. Limited-edition, seasonal flavors help create excitement and drive repeat purchases. Manufacturers also increasingly offer differentiated formats such as squeezable packs, single-serve portions, and baking-specific fruit fillings. These innovations appeal particularly to younger consumers who value experimentation and novelty in their food choices. Collectively, expanded flavor portfolios and versatile usage occasions are boosting category penetration and enhancing value growth.
Restraints Impact Analysis*
| Restraint | (~) % Impact on CAGR Forecast | Geographic Relevance | Impact Timeline |
|---|---|---|---|
| High sugar content in traditional jams and jellies limiting appeal to health-conscious consumers | -0.6% | United States, Canada; Mexico accelerating due to NOM-051 | Short term (≤ 2 years) |
| Seasonal availability of key ingredients (fruits) affecting production and pricing | -0.5% | North America-wide, with acute impacts in United States Southeast (Florida drought) and Mexico (sugar cane) | Medium term (2-4 years) |
| High production and raw material costs for premium and organic variants | -0.3% | United States and Canada, Mexico | Short term (≤ 2 years) |
| Short shelf life of certain fruit-based spreads compared to other packaged foods | -0.2% | United States and Canada, pronounced in Mexico | Medium term (2-4 years) |
| Source: Mordor Intelligence | |||
High sugar content in traditional jams and jellies limiting appeal to health-conscious consumers
High sugar content in traditional jams and jellies is a major restraint for the North America jam, jelly, and preserve market. Rising awareness of links between excessive sugar intake, obesity, and diabetes is prompting consumers to scrutinize labels and avoid high-sugar spreads. Health-conscious segments, including diabetics and weight‑management consumers, increasingly perceive standard jams as incompatible with their dietary goals. This perception drives trade-down to smaller portion sizes, reduced consumption frequency, or substitution with nut butters, fresh fruit, and low-sugar yogurt. Parents are also limiting sugary spreads in children’s diets, further constraining household demand. As a result, conventional high-sugar formulations face stagnating or declining volumes in mature retail channels. This restraint is pushing manufacturers to reformulate and reposition products toward reduced-sugar, no-added-sugar, and naturally sweetened alternatives.
Seasonal availability of key ingredients (fruits) affecting production and pricing
Seasonal availability of key fruit ingredients acts as a significant restraint for the North America jam, jelly, and preserve market. Limited harvesting windows for berries, stone fruits, and other core inputs expose producers to supply volatility and short-term shortages. Weather-related disruptions, such as frosts, droughts, or heavy rains, can further impact yields and quality, tightening raw material supply. These fluctuations often lead to higher procurement costs, which either compress manufacturer margins or translate into retail price increases. Inconsistent quality or limited availability of certain fruits can also restrict innovation in flavor portfolios. Smaller and artisanal producers are particularly vulnerable, as they rely more heavily on local or single-source suppliers. Overall, seasonal dependence on fruit harvests introduces cost and supply risks that can dampen market growth and pricing stability.
*Our forecasts treat driver/restraint impacts as directional, not additive. The impact forecasts reflect baseline growth, mix effects, and variable interactions.
Segment Analysis
By Product Type: Preserves Gain as Authenticity Signals Intensify
Jam and jelly accounted for the largest share of revenue in North America’s jam, jelly, and preserve market in 2025, contributing approximately 63.68% of total sales. This dominance stems from their deep-rooted presence in breakfast consumption habits and widespread household familiarity. The segment continues to benefit from its affordable pricing and broad product availability across both retail and foodservice channels. However, its growth trajectory is moderating as evolving consumer preferences shift toward more natural and less processed alternatives. Increasing health awareness and scrutiny over added sugars are encouraging consumers to explore products with cleaner ingredient profiles.
Preserves are projected to register the highest growth rate within the category, expanding at a CAGR of 5.25% through 2031. This acceleration reflects consumers’ rising appreciation for products that emphasize authenticity, visible fruit content, and minimal processing. The perception of preserves as more “artisanal” and closer to homemade recipes has enhanced their appeal among health-conscious and premium-oriented shoppers. Higher fruit-to-sweetener ratios and texture-rich formulations align with clean-label trends and the growing preference for natural, wholesome foods. Market players are actively innovating to capture this momentum through premium positioning, transparent labeling, and local fruit sourcing.




By Packaging Type: Flexible Formats Disrupt Glass Hegemony
Bottles and jars continued to dominate the North American jams, jellies, and preserves market in 2025, capturing 80.75% of total revenue. Their long-standing prevalence is reinforced by strong consumer associations between glass packaging and product quality, longevity, and visual appeal. Glass jars, in particular, are perceived as indicators of authenticity and freshness, offering a premium image that aligns with both traditional and gourmet product lines. The recyclability and reusability of glass further enhance its relevance among environmentally conscious consumers. Despite the material’s higher weight and shipping costs, brand owners continue investing in classic jar designs to preserve brand heritage and consumer trust.
Pouches and sachets represent the fastest-growing packaging segment, projected to expand at a CAGR of 5.55% through 2031. Their rapid growth reflects rising consumer demand for portability and ease of use. These lightweight formats cater well to modern, on-the-go lifestyles and the increasing influence of e-commerce, where durability and shipping efficiency are critical. Brands are leveraging flexible packaging to introduce single-serve options and resealable packs tailored to small households and travel-friendly consumption. Moreover, advances in recyclable and bio-based films are aligning pouches and sachets with sustainability expectations, enhancing their appeal among eco-aware consumers. As these formats evolve in functionality and design, they are expected to capture a larger share of future market expansion and challenge the long-standing dominance of traditional glass packaging.
By Category: Organic Premiumization Outpaces Conventional Volume
Conventional products dominated the market in 2025, representing 90.25% of total market value. This strong position is underpinned by their widespread availability across mass retail channels and their competitive pricing compared to organic alternatives. Established consumer familiarity with conventional brands and consistent product quality has further reinforced their market leadership. The segment continues to benefit from high household penetration and bulk purchasing behaviors, particularly among middle-income consumers. However, growth within this category is stabilizing as sustainability awareness and ingredient scrutiny influence purchasing decisions. To maintain relevance, manufacturers are expanding “better-for-you” conventional lines that emphasize reduced sugar, natural flavors, and recognizable ingredients.
Organic products represent the fastest-growing category, forecast to expand at a CAGR of 6.01% through 2031. Consumer interest in clean-label and minimally processed foods continues to propel this segment’s momentum across premium retail and online channels. Shoppers increasingly associate organic labeling with health, environmental responsibility, and authenticity, driving willingness to pay premium prices. Brands are capitalizing on this shift by highlighting non-GMO ingredients, reduced additives, and sustainable sourcing practices on packaging. Although the segment currently contributes a smaller share of market value, its growth potential is substantial as more mainstream retailers integrate organic options into their assortments.
By Distribution Channel: E-Commerce Reshapes Off-Trade Economics
Off-trade channels dominated the market in 2025, accounting for 67.50% of overall sales. This segment encompasses supermarkets, hypermarkets, convenience stores, online platforms, and other retail outlets that collectively serve as the primary point of purchase for household consumers. The broad product assortment, frequent promotional activity, and widespread accessibility of these retail formats continue to reinforce their leadership. Supermarkets and hypermarkets remain especially significant, offering extensive product visibility and encouraging impulse purchases through strategic shelf placement. Online retail has additionally strengthened the off-trade structure, catering to digital-savvy consumers seeking convenience and direct-to-home delivery.
On-trade distribution, comprising restaurants, hotels, cafés, and other foodservice establishments, is emerging as the fastest-growing sales channel, projected to expand at a CAGR of 5.39% through 2031. This rebound reflects the post-pandemic recovery of the hospitality sector and the resurgence of dining-out culture across North America. Increased institutional procurement of premium and portion-controlled jam and preserve formats is supporting category demand within foodservice. Operators are integrating these products into both traditional breakfast menus and upscale culinary applications such as desserts and bakery fillings. Manufacturers are also partnering with restaurants and hotels to introduce co-branded offerings and customized packaging suited to professional use.
Geography Analysis
The United States dominates the North American jams, jellies, and preserves market, commanding 72.85% of total revenue in 2025. Its market strength is founded on deeply ingrained breakfast traditions, high per-capita consumption of spreadable fruit products, and an extensive retail infrastructure. Well-established supermarket and club store networks ensure broad product visibility, while robust e-commerce penetration continues to expand consumer access to both mainstream and premium offerings. The United States market also benefits from a strong domestic production base and continual product innovation driven by established brands and private labels alike. Ongoing consumer interest in reduced-sugar, natural ingredient, and functional variants is shaping new product development strategies.
Canada represents a smaller yet mature segment of the North American jams, jellies, and preserves market, characterized by steady, value-driven growth. The market is experiencing a gradual shift toward premium, health-oriented, and environmentally responsible products. Consumers increasingly favor options that align with evolving dietary preferences such as plant-based formulations, lower-sugar content, and higher fiber levels. Convenience also remains a notable driver, with demand rising for portion-controlled and on-the-go packaging formats suitable for busy lifestyles. Canadian shoppers display heightened interest in locally sourced and sustainably packaged items, reflecting strong cultural alignment with environmental awareness and ethical consumption.
Mexico is emerging as the fastest-growing market within North America, projected to expand at a CAGR of 4.93% through 2031. Growth is underpinned by a rising middle-class population, rapid urbanization, and increasing exposure to international food trends. Higher disposable incomes are enabling consumers to trade up from traditional homemade spreads to branded and premium imported varieties. Imported jams and preserves particularly those positioned around natural ingredients and distinct flavor profiles are finding growing acceptance among urban consumers. Retail modernization and the expansion of organized grocery chains are further boosting product availability and awareness across the country.
Regulatory Landscape
In the United States, the FDA regulates standards of identity for fruit preserves and jams under 21 CFR 150.160, which sets minimum soluble solids for finished products. In Canada, Health Canada and the Canadian Food Inspection Agency regulate processed fruit products, enforcing labeling requirements and standards for ingredient and allergen declarations under the Food and Drug Regulations. Mexico's NOM-051 front-of-pack labeling rules continue to influence how high-sugar spreads are presented at shelf, reinforcing the role of sugar-reduction messaging in cross-border strategies.
Together, these frameworks define formulation boundaries and labeling governance across the region, pushing reformulation toward cleaner labels while keeping fruit-content targets in place.
Competitive Landscape
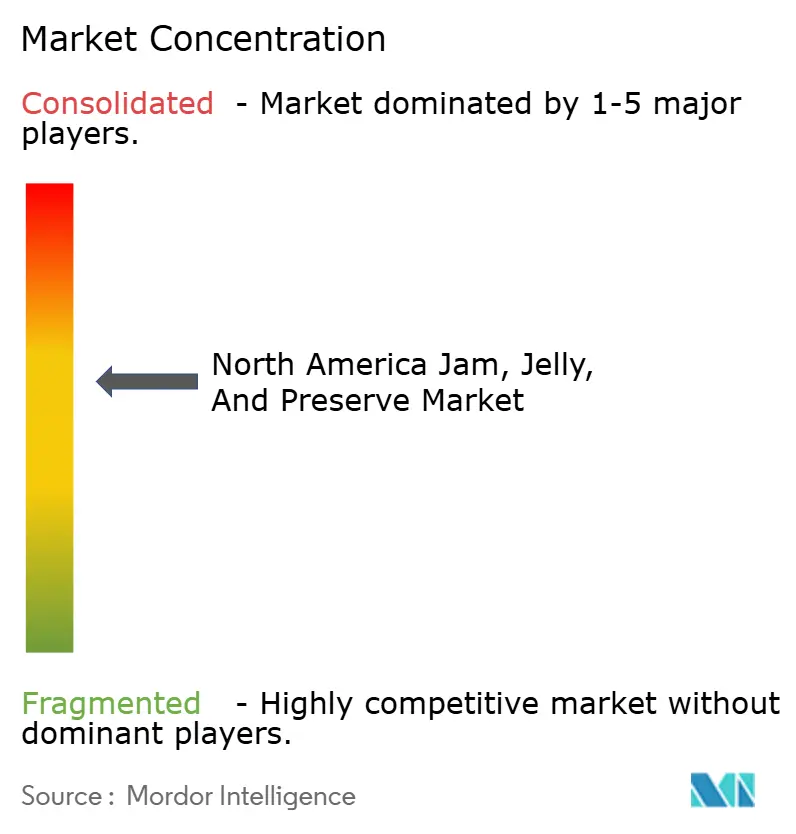
The North American Jams, Jelly, And Preserve market displays moderate fragmentation, with a mix of dominant global corporations, strong regional brands, and a growing base of niche producers. Established market leaders hold significant retail presence and brand recognition, yet the competitive intensity remains elevated due to the broad availability of lower-cost alternatives and private-label offerings. The landscape reflects a mature yet dynamic market environment where innovation, flavor diversification, and ingredient transparency drive differentiation. Consolidation activities and strategic partnerships occasionally occur among key players seeking scale advantages and extended distribution reach.
Prominent companies such as The J.M. Smucker Company, Kraft Heinz, and B&G Foods continue to anchor category performance with their extensive product portfolios and deep-rooted consumer trust. These players maintain strong visibility across major supermarkets, club stores, and e-commerce channels through continuous brand marketing and product innovation. Their focus areas include reduced-sugar variants, squeezable packaging formats, and fruit-forward flavor profiles intended to align with changing consumer preferences. The scale of their supply chains and distribution networks provides a competitive advantage in maintaining volume leadership and price stability.
The competitive dynamics are being reshaped by the entry of emerging organic and artisanal producers capitalizing on health, authenticity, and sustainability trends. Smaller brands are differentiating themselves through limited-ingredient formulations, locally sourced fruit, and handcrafted positioning that appeals to premium and eco-conscious segments. Private-label manufacturers are also strengthening their role, leveraging pricing competitiveness and improved quality perception to capture value-conscious consumers. As consumer interest shifts toward natural, minimally processed spreads, innovation pipelines are expanding to include fruit blends, exotic varieties, and functional fortifications.
North America Jam, Jelly, And Preserve Industry Leaders
-
The J. M. Smucker Company
-
B&G Foods, Inc.
-
The Kraft Heinz Company
-
Andros Group
-
Conagra Brands, Inc.
- *Disclaimer: Major Players sorted in no particular order

Market Opportunities and Future Outlook
Reformulation and portfolio architecture around sugar reduction and organic positioning remain key opportunities, anchored by US FDA 21 CFR Part 150 and Health Canada/FDR. Under this environment, manufacturers are expanding reduced-sugar, fruit-forward preserves and USDA Organic lines (7 CFR 205), while also diversifying pack formats such as squeezable pouches to address e-commerce durability needs and portion-control use cases.
On the company side, the Kraft Heinz Company announced a new global operating structure effective July 1, 2026, consolidating procurement and supply chain functions to improve efficiency in North American jam and preserve categories. The J. M. Smucker Company projects approximately USD 1.0 billion in free cash flow for fiscal 2027, intended to fund core-brand investments in fruit spreads. B&G Foods continues to focus on higher-margin core categories and divests lower-margin assets, widening room for private-label and focused spread brands to win distribution, particularly in Mexico where NOM-051 labeling supports health-forward positioning.
Recent Industry Developments
- June 2026: Announced fiscal year 2026 fourth quarter results and provided full year fiscal 2027 outlook. The update reinforces category leadership through continued cash generation and deliberate brand investment across the core fruit spreads portfolio. The disclosure points to ongoing commitment to growth and margin discipline in the jam and preserve segment.
- March 2026: Announced a brand redesign for Smucker's fruit spreads, marking the first update in nearly 30 years. The new design modernizes shelf presence with larger fruit cues and a refreshed brand identity, supporting premium positioning amid private-label pressure. The refresh also aligns with Smucker's broader portfolio modernization and category leadership messaging.
- October 2024: Introduced Squeeze-able Pouches for organic fruit spread in 13 oz formats, expanding beyond traditional jars. The packaging shift targets family-friendly, mess-free usage and online-friendly shipping economics. It also supports flexible-format adoption in the category.


Research Methodology Framework and Report Scope
Market Definition and Coverage
This market covers the value of packaged jam, jelly, marmalade, and fruit preserves sold for household and foodservice use across North America, measured at manufacturer to retailer pricing levels and then normalized to USD for comparison.
Scope exclusions: We exclude fresh fruit spreads made in-store without branded packaging, and we also exclude nut-based spreads, honey, and chocolate spreads that do not meet jam and jelly style definitions.
Segmentation Overview
-
By Product Type
- Jam and Jelly
- Marmalade
- Preserves
-
By Packaging Type
- Bottles/Jars
- Pouches/Sachets
- Others
-
By Category
- Conventional
- Organic
-
By Distribution Channel
-
Off-Trade
- Supermarkets/Hypermarkets
- Convenience Stores/Grocery Stores
- Online Retail Stores
- Other Distribution Channels
- On-Trade
-
Off-Trade
-
By Country
- United States
- Canada
- Mexico
- Rest of North America
Data Sources, Market Sizing, and Validation
Desk Research
Desk work starts by fixing boundaries and identifiers so the model stays consistent across the United States, Canada, Mexico, and the Rest of North America. We referenced public standards and definitions that shape what can be labeled and sold as jam, jelly, and related products, including the US FDA Code of Federal Regulations for fruit spreads, and organic rules under USDA National Organic Program materials.
To estimate demand signals and category direction, we used public data points and time series such as national food consumption and price indicators, plus trade and cross-border movement where it is relevant for fruit preparations. Examples include US Bureau of Labor Statistics CPI food series for shelf-stable spreads, USDA Economic Research Service releases, Statistics Canada tables on food price and retail trends, and UN Comtrade-style trade statistics for fruit preparations and related HS categories. We also reviewed company filings and investor presentations for packaged food businesses, along with reputable press and retailer announcements to track pack size changes and pricing resets. In addition, we used paid subscriptions for company financials and news, plus a paid import and export shipment-level database where it helped validate trade flow direction. The sources listed here are not exhaustive, and many other public references were checked to fill gaps and confirm assumptions.
Primary Interviews and Surveys
Primary inputs were collected through structured expert interviews and short surveys with packaged food stakeholders, including brand-side commercial teams, distributors, category managers, and a few ingredient and co-manufacturing contacts. Since price and mix shift matter in this category, these discussions were used to confirm typical promotional intensity, private label pressure, and how organic and reduced-sugar lines are priced relative to conventional products across major North American markets.
Distribution of primary research fieldwork respondents
| Company type | Respondent position |
|---|---|
| Top tier: 39% | CXOs: 15% |
| Mid tier: 41% | Functional/Unit leaders: 33% |
| Smaller Players: 20% | Managers: 52% |
Market-Sizing & Forecasting
Sizing starts with a top-down build where production and trade cues, paired with retail category signals, are used to reconstruct the addressable pool for jam, jelly, marmalade, and preserves across North America. That pool is then split using practical fingerprints that interviewees can verify, such as conventional versus organic positioning, typical pack sizes, private label presence, and the observed channel mix between supermarkets and hypermarkets, convenience stores, and online stores.
After that, results are checked with selective bottom-up approximations so totals do not drift from reality. We roll up a sampled set of supplier and brand revenues where public disclosures exist, and we also sanity-check value by using an ASP times volume view built from common shelf prices, promotion cadence, and consumption frequency assumptions. When visibility is weaker (for example, smaller regional brands and foodservice packs), gaps are handled through peer benchmarks and distributor-level mix estimates, then stress-tested with follow-up calls.
For forecasting, we rely mainly on scenario analysis supported by simple regression checks, because category demand is influenced by a few repeatable drivers that do not always move in a straight line. Inputs typically include fruit input cost direction, sugar price and sweetener substitution, household penetration of breakfast and snack routines, share shift to reduced-sugar claims, and changes in retailer promotional depth. Assumptions are reviewed with primary respondents so the forward view stays aligned with what buyers and sellers expect to happen, not only what the historical series suggests.
Data Validation & Update Cycle
Before sign-off, we run variance checks across the model so country totals reconcile with the regional roll-up and so channel splits do not exceed realistic retail structures. Analysts compare the output to independent signals, such as food price indices, trade flow direction, and major packaging and label changes that usually show up in public news.
If a value looks out of range, we revisit the ASP logic first, then re-check mix assumptions like organic share and online penetration, and then we re-contact selected experts when needed. Reports are refreshed annually, with interim updates triggered by material events like sharp commodity inflation, major label rule changes, or unusually large pricing resets in retail. Before delivery, a fresh final review is completed so clients receive an up-to-date estimate and consistent assumptions.
Mordor Intelligence's North America Jam Jelly and Preserve Market Sizing Compared With Other Published Estimates
Published numbers for the North America jam, jelly, and preserve space often do not match, mainly because groups set different category boundaries and they also do not refresh pricing and currency assumptions at the same time. Even when product names look similar, the included geographies, organic treatment, and whether foodservice is counted can shift the total by a lot.
A key gap driver is timing, because recent label-led price moves and promotion intensity can change average selling prices within a few quarters, which then changes the value estimate even if volumes are stable. Another common gap is scope, where some figures fold in adjacent spreads or exclude Mexico and the Rest of North America, and a few also mix retail and wholesale price points without clearly stating the conversion. By re-checking ASP steps close to publication and locking FX timing consistently for the region, the 2025 value stays traceable to what buyers pay in-market, a refresh choice applied by Mordor Intelligence.
Benchmark comparison
| Source | Market Size | Gaps in Research Methodology |
|---|---|---|
| Mordor Intelligence | USD 4.21 B (2025) | |
| Trade Journal A | USD 1.88 B (2024) | Uses an earlier base year and appears to cover a narrower geography (primarily the United States and Canada), which can understate the North America total versus a full regional roll-up. The value also looks sensitive to retail price timing, since recent pricing resets are not clearly reflected. |
| Regional Consultancy B | USD 3.48 B (2025) | The definition is framed as fruit jam, jelly, and preserves, which may treat marmalade, non-fruit variants, or some channel coverage differently. The higher long-range growth rate suggests a more aggressive price or volume trajectory, which can lift the current-year implied value depending on how the back-cast is done. |
The table shows that most of the spread comes from scope decisions and from how quickly pricing and geography assumptions are updated. When the market is built from clearly stated product boundaries, consistent country coverage, and a repeatable ASP approach, the resulting number is easier to reconcile against visible category signals and to update as conditions change.


Key Questions Answered in the Report
How large is the North American jam, jelly, and preserve market in 2026?
The market is valued at USD 4.38 billion in 2026 and is forecast to reach USD 5.31 billion by 2031.
Which product type is growing fastest?
Preserves lead growth at a 5.25% CAGR through 2031 due to consumer preference for visible fruit pieces and artisanal cues.
What packaging innovation is reshaping distribution?
Lightweight pouches and squeeze packs, growing at a 5.55% CAGR, reduce breakage and freight costs while appealing to on-the-go users.
Why is Mexico the fastest-growing geography?
Rising disposable incomes, NOM-051 sugar-warning labels, and supply shortages are propelling a 4.93% CAGR in Mexican demand for premium imports.
How are brands responding to sugar-reduction pressures?
Producers are adopting juice concentrates, stevia, and modified pectins while reformulating to meet FDA added-sugar rules without sacrificing taste.
Page last updated on:


 Your data is secure and never sold or shared.



