Market Overview
| Study Period | 2021 - 2031 |
|---|---|
| Forecast Data Period | 2026 - 2031 |
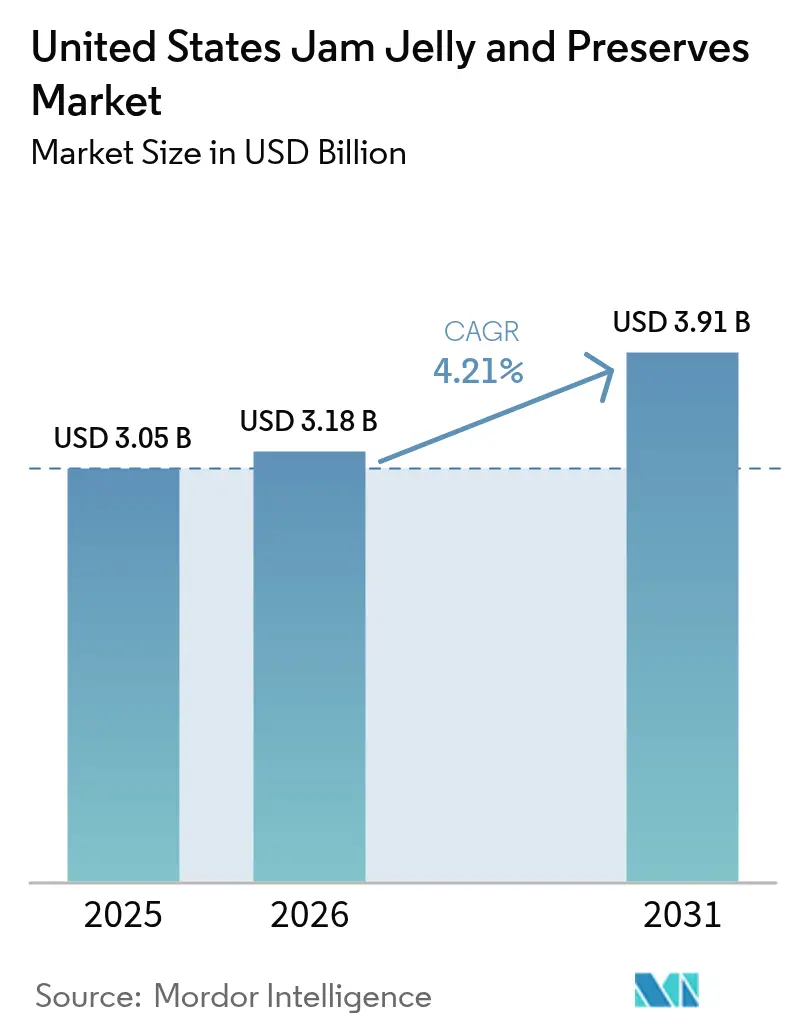
| Base Year Market Size (2025) | USD 3.05 Billion |
| Market Size (2026) | USD 3.18 Billion |
| Market Size (2031) | USD 3.91 Billion |
| Growth Rate (2026 - 2031) | 4.21% CAGR |
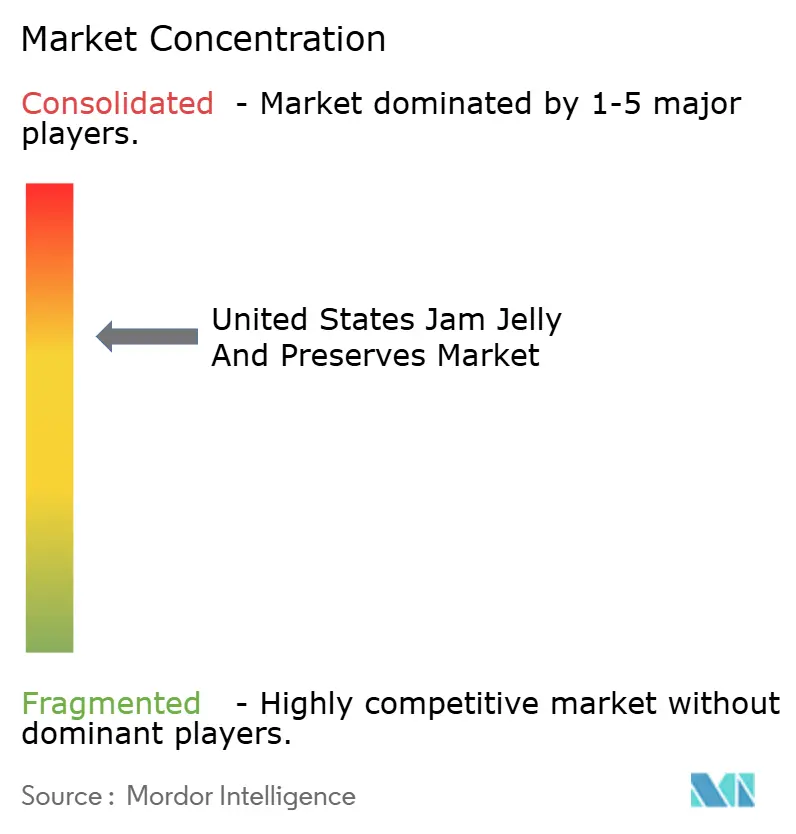
| Market Concentration | Medium |
Major Players*Disclaimer: Major Players sorted in no particular order Image © Mordor Intelligence. Reuse requires attribution under CC BY 4.0. |
|
United States Jam Jelly And Preserves Market Analysis by Mordor Intelligence
The United States jam, jelly, and preserves market size is expected to grow from USD 3.05 billion in 2025 to USD 3.18 billion in 2026 and is forecast to reach USD 3.91 billion by 2031 at 4.21% CAGR over 2026-2031. The market growth is driven by increasing demand for convenient breakfast options, product innovation in flavors, and expanded distribution networks, including e-commerce platforms. Manufacturers are implementing advanced shelf-life extension technologies, enhanced packaging solutions, and reduced-sugar formulations to meet the preferences of approximately two-thirds of American consumers who actively monitor their sugar consumption. The market sees upward price movement through premium and artisanal offerings, which helps buffer against fluctuating raw material costs due to seasonal fruit availability. The market structure remains concentrated, with three major companies - Smucker's, KraftHeinz, and B&G Foods - maintaining their market positions through economies of scale and extensive distribution networks, despite increasing competition from specialty brands and private-label products.
Key Report Takeaways
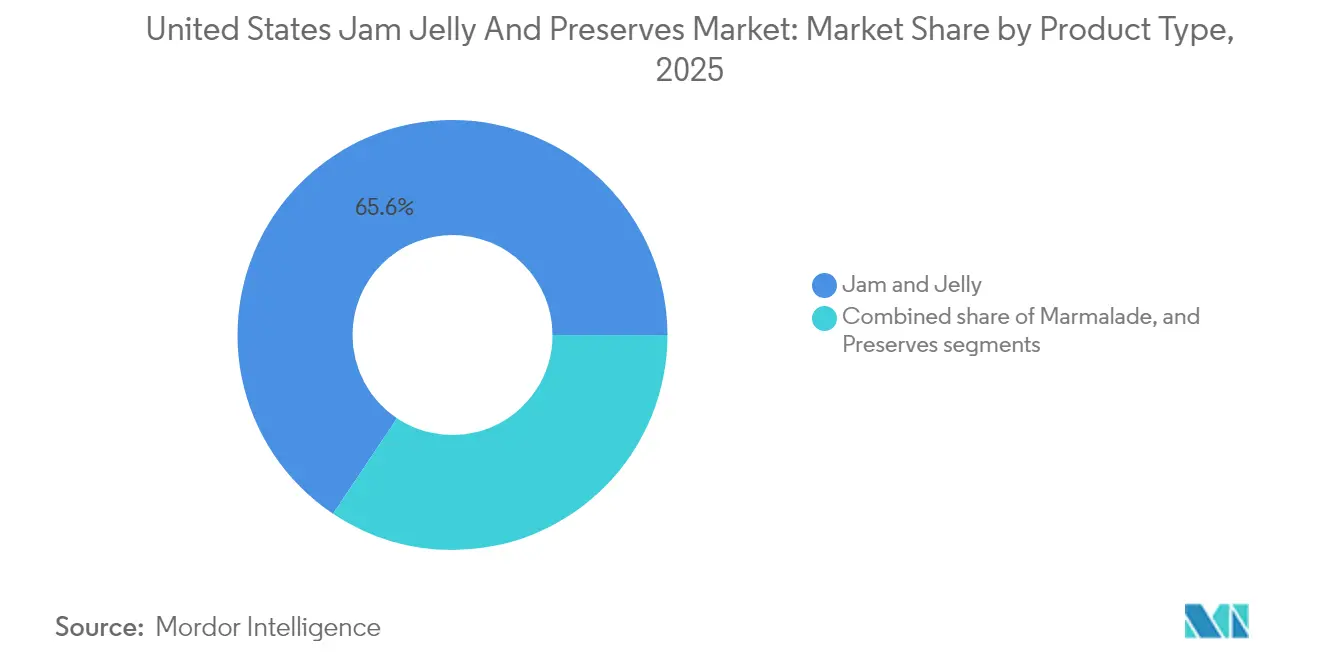
- By product type, jam and jelly led with 65.62% of the United States jam, jelly, and preserves market share in 2025, while Preserves is projected to grow at a 4.86% CAGR to 2031.
- By packaging, bottles/jars captured 84.12% of 2025 revenues, whereas pouches/sachets are forecast to expand at a 6.05% CAGR through 2031.
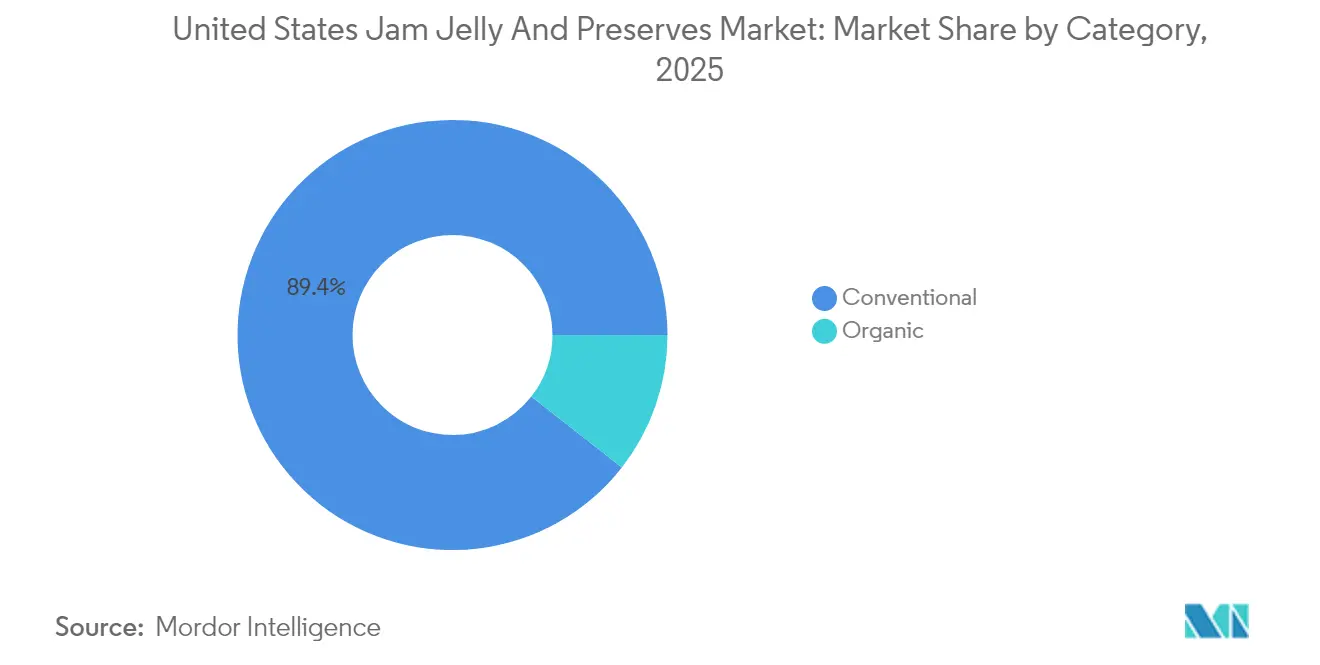
- By category, conventional products commanded 89.44% of sales in 2025; the organic segment is set to accelerate at a 5.38% CAGR between 2026-2031.
- By distribution channel, off-trade channels held a 64.85% share in 2025, yet on-trade channels are positioned for the fastest 5.6% CAGR in the same horizon.
- By geography, the South accounted for 34.41% of 2025 consumption, whereas the West will post the quickest 4.9% CAGR to 2031.
Note: Market size and forecast figures in this report are generated using Mordor Intelligence’s proprietary estimation framework, updated with the latest available data and insights as of 2026.
United States Jam Jelly And Preserves Market Trends and Insights
Drivers Impact Analysis*
| Driver | (~) % Impact on CAGR Forecast | Geographic Relevance | Impact Timeline |
|---|---|---|---|
| Rising consumption of spreads as convenient and ready-to-eat options | +0.8% | National, with higher impact in West and Northeast regions | Medium term (2-4 years) |
| Product innovation in flavors, textures, and packaging boosting sales | +0.6% | National, concentrated in premium markets | Long term (≥ 4 years) |
| Expanding availability through supermarkets, online, and specialty retail stores | +0.7% | National, with accelerated growth in online channels | Short term (≤ 2 years) |
| Increasing popularity of artisan and gourmet fruit spread varieties | +0.4% | West and Northeast regions primarily | Medium term (2-4 years) |
| Rising demand for natural and organic fruit-based spread products | +0.5% | National, with premium positioning in urban markets | Long term (≥ 4 years) |
| Long shelf life drives the usage of products among consumers | +0.3% | National, particularly relevant for rural and suburban markets | Short term (≤ 2 years) |
| Source: Mordor Intelligence | |||
Rising consumption of spreads as convenient and ready-to-eat options
Fast-paced lifestyles in the U.S. are driving the demand for food spreads, especially in dual-income households seeking convenience. The U.S. Census Bureau reported a 4.0% rise in real median household income to USD 80,610 in 2023 from USD 77,540 in 2022, supporting this trend [1]Source: U.S. Census Bureau, "Income in the United States: 2023", census.gov . Time-constrained households in the United States increasingly use fruit spreads as quick flavor enhancers for bread, yogurt, and baking, driving demand in the jam, jelly, and preserves market. Squeeze-bottle formats experienced growth during the recent period, particularly among parents seeking convenient breakfast options. Portion-control caps support calorie monitoring, while positioning fruit spreads as a nutritious alternative to meet recommended fruit servings. Manufacturers emphasize real-fruit content on packaging to maintain sales volumes, even as fresh fruit consumption per capita decreases. This trend is prominent in metropolitan areas and extends across all socioeconomic groups, indicating its significance as a national market driver.
Product innovation in flavors, textures, and packaging boosting sales
The United States jam, jelly, and preserves market is evolving through product innovation. Brands are introducing unique flavor combinations like mango-pineapple, blueberry-lavender, and pepper-infused variants, which command premium prices in specialty retail stores. The integration of oxygen sensors in smart jars extends product freshness throughout multiple seasons, reducing dependency on seasonal berry harvests. Manufacturers are also developing various texture options, including chunky pulp, low-sugar gel, and chia-seed gelling alternatives, to address consumer concerns about sugar content before the upcoming FDA "healthy" label regulations. These developments enhance the market's appeal to both premium consumers and health-conscious buyers.
Expanding availability through supermarkets, online, and specialty retail stores
The e-commerce channel for organic food sales has experienced substantial growth, with online revenues tripling in the past five years. Major retail chains have allocated prime shelf space to emerging fruit spread brands, capitalizing on changing consumer preferences. Regional grocery stores are expanding their private-label product lines to maintain steady customer traffic and increase market share. Specialty food sales have grown significantly, showing consistent consumer willingness to purchase premium food products through digital channels and traditional retail outlets [2]Source: Specialty Food Association, “State of the Specialty Food Industry 2024,” specialtyfood.com. Walmart's introduction of organic squeeze-pouch jams across its locations reflects the increasing consumer demand for premium fruit spreads and demonstrates the market's shift toward healthier alternatives. The United States jam, jelly, and preserves market is expanding through specialized subscription services offering curated, limited-edition preserves quarterly, increasing customer retention among specialty food consumers seeking artisanal products and unique flavor combinations.
Increasing popularity of artisan and gourmet fruit spread varieties
Premium preserves featuring single-origin fruit, small-batch production methods, and seasonal varieties command 25-30% higher prices compared to mass-market alternatives. Polaner "All Fruit" maintains its national presence by excluding high-fructose corn syrup and artificial flavors, establishing clean-label standards across conventional retail channels. Sales growth is particularly robust in coastal urban areas with established farmers' markets, while specialty food retailers in the Southern United States have successfully introduced limited-edition varieties, including distinctive peach-bourbon preserves. The increasing focus on artisanal products has strengthened the premium segment, driving sustained revenue growth in the United States jam, jelly, and preserves market through value-based positioning and consumer preference for craft production.
Restraints Impact Analysis*
| Restraint | (~) % Impact on CAGR Forecast | Geographic Relevance | Impact Timeline |
|---|---|---|---|
| Rising health concerns over high sugar content in products | -0.9% | National, with higher impact in health-conscious regions | Medium term (2-4 years) |
| Strong competition from nut butters and healthier spread options | -0.7% | National, particularly in premium segments | Long term (≥ 4 years) |
| Seasonal dependence on fruit crops affecting supply and prices | -0.4% | National, with regional variations based on crop proximity | Short term (≤ 2 years) |
| Growing preference for fresh fruits over processed fruit spreads | -0.3% | Urban markets primarily, with health-conscious demographics | Medium term (2-4 years) |
| Source: Mordor Intelligence | |||
Rising health concerns over high sugar content in products
Two-thirds of American adults actively avoid sugar consumption, significantly impacting products that traditionally contain 45-65% sugar solids. While no federal sugar tax currently exists in the United States, potential WHO-influenced fiscal measures could substantially affect the jam, jelly, and preserves market. Manufacturers utilizing stevia and monk fruit as sugar alternatives encounter complex technical challenges in masking bitter flavors, which increases production costs and affects product development. Consumer acceptance of these reformulated products remains a critical factor in market success, particularly among affluent Millennials who carefully examine nutritional information and demand ingredient transparency.
Strong competition from nut butters and healthier spread options
Almond, cashew, and seed-based butters continue to gain significant market share by offering superior protein content and essential healthy fats, attributes that traditional fruit spreads cannot directly match. Consumer behavior shows an increasing trend of combining protein-rich nut-based toppings with reduced-sugar fruit spreads during breakfast meals. Once Again Nut Butter's strategic acquisition of Big Tree Organic Farms strengthens its vertical supply chain control, enabling more competitive pricing strategies in retail environments where jam shelf allocation remains unchanged. In response, traditional fruit spread manufacturers are intensifying their research and development efforts toward fiber fortification and vitamin C enhancement to maintain their market position within the broader spread categories.
*Our forecasts treat driver/restraint impacts as directional, not additive. The impact forecasts reflect baseline growth, mix effects, and variable interactions.
Segment Analysis
By Product Type: Premium Preserves Gain Traction
Jam and Jelly maintains market dominance, accounting for 65.62% of 2025 take-home sales in the United States jam, jelly, and preserves market. The segment's success stems from established flavor profiles, family-oriented packaging, and competitive price points. This market position enables manufacturers to expand their product lines, particularly in the reduced-sugar category. The Preserves segment, while smaller, demonstrates robust growth potential with a projected 4.86% CAGR through 2031, driven by its whole-fruit composition that commands higher retail prices. Limited-edition preserves featuring regional fruits, such as Pacific-coast peaches and New England cranberries, demonstrate strong sales performance, reflecting consumer interest in product origin and visible fruit content.
The preserves category performs particularly well in online specialty retail, where premium multi-jar gift sets generate higher margins for direct-to-consumer manufacturers. Marmalade maintains its market presence, particularly in the Northeast region, where traditional British culinary influences persist. Manufacturers are incorporating sugar-reduction technologies and alternative ingredients like chia-seed pectin to enhance their core products while maintaining familiar taste profiles. These developments support the projected growth of the preserves segment in the United States jam, jelly, and preserves market, as consumers increasingly value products with visible fruit content as an indicator of quality.


By Packaging Type: Flexible Formats Break Glass Dominance
Glass bottles and jars maintain 84.12% of category turnover, supported by their recyclability, product visibility, and established retail infrastructure. Flexible pouches and sachets demonstrate significant growth potential with a 6.05% CAGR, driven by consumer demand for convenient, portable packaging suitable for children's lunchboxes. The integration of squeeze cap technology enables precise portion control, supporting reduced sugar consumption while maintaining spread coverage, aligning with public health initiatives. The reduced weight of flexible packaging, approximately half that of glass containers, results in lower transportation emissions and costs, appealing to environmentally conscious consumers.
The expanded surface area of pouches accommodates enhanced product information through smart-label features, such as QR codes linking to product origin information, increasing consumer interaction both in-store and digitally. Premium preserve manufacturers continue to utilize glass packaging to emphasize artisanal quality, product consistency, and gift-giving appeal, creating distinct market segments within the US jam, jelly, and preserves industry. Manufacturers are exploring alternative solutions, including PET jars that combine transparency with durability, though adoption remains limited. The market for pouches shows potential for additional growth, particularly if retailers expand their refrigerated grab-and-go breakfast offerings.
By Category: Organic Outpaces Conventional
In 2025, conventional jam, jelly, and preserves captured a commanding 89.44% market share, underscoring a robust consumer preference for these traditional offerings. This stronghold is bolstered by time-honored manufacturing processes, a vast retail distribution network, and savvy pricing strategies. The broad accessibility of these conventional products across diverse retail platforms, including supermarkets, hypermarkets, and convenience stores, ensures their availability to a wide range of consumers. Additionally, their competitive pricing appeals to budget-conscious buyers, while the familiarity and trust associated with these products further reinforce their dominance in the market.
The organic segment represents 10.56% of the market share and is projected to grow at a 5.38% CAGR through 2031. This growth is driven by increasing health consciousness, rising disposable incomes, and greater awareness of sustainable farming practices. The FDA's updated "healthy" labeling guidelines, emphasizing natural fruit content over artificial additives, support the organic segment's expansion. Organic manufacturers are responding by developing clean-label formulations, introducing exotic fruit varieties, and implementing sustainable packaging solutions. The shift towards organic options reflects a broader consumer trend towards healthier, environmentally conscious food choices .
By Distribution Channel: Foodservice Growth Outpaces Retail Stability
In 2025, Off-Trade channels command a dominant 64.85% share of the United States market for jams, jellies, and preserves. This segment encompasses supermarkets, hypermarkets, convenience stores, and online retail platforms. The dominance of Off-Trade channels is bolstered by consumer preferences for in-store product selection, brand familiarity, and established retail distribution networks. Factors such as the convenience of diverse purchase options, frequent promotional activities, and the ability to directly compare products play a pivotal role in shaping consumer buying decisions within these channels. Additionally, the growing penetration of e-commerce platforms has further strengthened the Off-Trade segment, offering consumers the flexibility of home delivery and access to a wider range of products, including niche and artisanal options.
On-trade distribution is set to experience a robust growth trajectory, with projections indicating a 5.6% CAGR through 2031. This anticipated growth is largely attributed to the resurgence of the foodservice sector and a surge in institutional demand in the aftermath of the pandemic. Key players in this segment, including restaurants, hotels, cafeterias, and institutional buyers, emphasize the need for bulk packaging and dependable supply chains to meet their food preparation demands. Additionally, the rise of breakfast-centric restaurants, expanding hotel chains, and catering services, coupled with a growing appetite for premium and artisanal preserves in upscale dining venues, are significant drivers of this segment's growth. The increasing focus on offering unique and high-quality dining experiences has led to a higher demand for specialty preserves, which are often used as key ingredients in gourmet dishes and desserts, further fueling the segment's expansion.
Geography Analysis
The South maintains the highest regional consumption with a 34.41% market share in 2025. This dominance stems from larger family sizes, traditional comfort food preferences, and competitive pricing of conventional jams. The region's manufacturers, located near fruit-growing areas in Georgia and Florida, benefit from reduced transportation costs, enabling competitive pricing during promotional periods. However, lower federal Healthy Eating Index scores compared to national averages limit the adoption of premium low-sugar varieties. To maintain sales volumes, retailers emphasize multi-buy promotions and family-size packaging.
The Western region projects the highest growth rate at 4.9% CAGR, driven by affluent consumers purchasing organic and artisanal products through specialty grocers and farmers markets. California's robust fruit production, including an expected 6% increase in peach output in 2024, ensures a stable raw material supply and supports small-batch, orchard-specific production . The region's consumers, characterized by early technology adoption, show strong interest in smart packaging and functional ingredients.
The Midwest and Northeast regions maintain mid-single-digit growth rates. The Midwest market emphasizes price competitiveness and bulk packaging, with strong private-label presence, creating entry barriers for premium brands. The Northeast's concentrated specialty retail environment supports small-batch preserves, particularly during holiday gift-giving seasons. Urban consumers in the Northeast show increased interest in reduced-sugar products, prompting established manufacturers to test reformulated products in metropolitan markets. Both regions face supply chain considerations due to climate variability, with increasing late-spring frost risks affecting berry cultivation and necessitating diverse fruit sourcing strategies .
Competitive Landscape
The United States jam, jelly, and preserves market maintains moderate consolidation. Smucker's dominates the market through optimized promotional schedules and expanded distribution in club stores. Kraft Heinz maintains extensive household penetration, but has experienced volume decline due to increasing price differences with private label products. B&G Foods emphasizes its Polaner fruit-juice-sweetened products, addressing health concerns and securing placement in natural food sections.
Smaller companies demonstrate market adaptability: Crofter's Organic introduced the first nationwide organic squeeze pouch, securing Walmart distribution and indicating broader market acceptance. Bonne Maman retains its premium position through signature glass packaging and traditional French recipes. In 2024, it expanded its reach with a limited-edition Advent calendar featuring 24 mini preserves and an organic range including raspberry and peach variants. Regional farm brands continue to gain traction by emphasizing local authenticity and securing shelf space in co-ops and independent grocery stores.
Companies are emphasizing research and development, coupled with active mergers and acquisitions, to strengthen their market positions and drive innovation. Concurrently, manufacturers such as Smucker’s are refining their portfolios by divesting from non-core bakery assets and channeling funds into clean-label innovations to meet evolving consumer preferences for healthier and transparent product offerings. These maneuvers, in conjunction with rival products, the influence of private labels, and the emergence of premium brands, are redefining competitive strategies and shelf placements within the category, compelling players to adapt to shifting market dynamics and consumer demands.
United States Jam Jelly And Preserves Industry Leaders
-
The J.M. Smucker Company
-
Conagra Brands, Inc.
-
B&G Foods, Inc.
-
F. Duerr & Sons Ltd.
-
Andros Group
- *Disclaimer: Major Players sorted in no particular order

Recent Industry Developments
- April 2025: Japanese food company St Cousair is set to acquire the jam business of Oregon-based Kelly's Jelly through its US subsidiary, St Cousair Inc. (SCI), which operates in Oregon.
- January 2025: The J.M. Smucker Co. signed an agreement to sell its Cloverhill and Big Texas brands, along with selected private label products, to JTM Foods for USD 40 million. This sale aligns with the company's strategy to optimize its portfolio by concentrating resources on growth categories in the sweet baked goods segment. The company plans to use the proceeds to reduce its debt.
- November 2024: Crofter's Organic introduced organic squeezable pouch jams and preserves across more than 1,200 Walmart stores in the United States. The products contain 33% less sugar compared to conventional preserves and address consumer demand for convenient packaging formats. This launch marked the first organic squeezable preserves from a national brand in the US jam, jelly, and preserves market.


Research Methodology Framework and Report Scope
Market Definitions and Key Coverage
Our study defines the US jam, jelly & preserve packaging market as all primary retail or food-service containers, glass and plastic jars, metal tins, and flexible pouches/sachets sold within the United States for fruit-based spreads. It includes the value of empty packs as they leave converters and contract packers, before filling costs are added.
Scope exclusion: Secondary corrugated cases, caps and lids sold separately, bulk industrial totes, and packaging for honey, nut butters, or chocolate spreads are not counted.
Segmentation Overview
-
By Product Type
- Jam and Jelly
- Marmalade
- Preserves
-
By Packaging Type
- Bottles/Jars
- Pouches/Sachets
- Others
-
By Category
- Conventional
- Organic
-
By Distribution Channel
- On-Trade
-
Off-Trade
- Supermarkets/Hypermarkets
- Convenience/Grocery Stores
- Online Retail Stores
- Other Distribution Channels
-
By Geography
- Northeast
- Midwest
- South
- West
Detailed Research Methodology and Data Validation
Primary Research
Mordor analysts interview packaging engineers at spread brands, procurement managers at two large co-packers, and sales directors of jar and laminate film suppliers across the Midwest, South, and West. These conversations validate material mix assumptions, average selling prices, and adoption timelines for portion-controlled pouches, filling the visibility gaps that secondary data leave.
Desk Research
We first screen publicly available datasets such as the US Census Bureau's M3 shipments series for glass and plastic containers, the Bureau of Labor Statistics' Producer Price Index for glass food jars, USDA fruit-spread consumption tables, and shipment codes from USITC's DataWeb. Trade association briefs from the Glass Packaging Institute, Flexible Packaging Association, and the Food Marketing Institute supply converter capacity shifts and channel mix insights. Company filings retrieved through D&B Hoovers and news flows captured on Dow Jones Factiva let us benchmark leading jar and pouch suppliers' revenue to the category. This list is illustrative; many other public and paid sources inform the desk phase.
Market-Sizing & Forecasting
A top-down build begins with 2024 retail sales of jams and jellies and applies pack-cost shares derived from converter invoices and BLS input-output tables; results are cross-checked by rolling up sampled jar and pouch shipments reported by ten major converters to anchor a bottom-up sense check. Key variables in the model include per capita spread consumption, glass-to-pouch conversion rates, average unit weight by pack type, PET and glass cullet price trends, and voluntary recycled-content targets announced by large retailers. Forecasts through 2030 rely on a multivariate regression that links those drivers with GDP per capita and urban breakfast-at-home penetration, and are stress tested through scenario analysis for sugar-reduction legislation. Where converter data are incomplete, we close gaps using regional material consumption coefficients validated during interviews.
Data Validation & Update Cycle
Outputs pass a two-step analyst review that flags anomalies versus historical ratios and independent metrics, import trends, and converter margin bands. Models refresh every year, and interim updates are triggered if glass energy surcharges or resin prices swing more than 15 percent. Before release, an analyst re-runs the latest quarter's data so clients receive the freshest view.
Why Mordor's US Jam Jelly And Preserves Baseline Stands Up
Published estimates can differ widely because firms choose varying geographic cuts, pack formats, and price points.
Key gap drivers include (a) whether Canada and Mexico are merged with US data, (b) if only glass is tracked versus all pack formats, and (c) how on-premise food-service volumes are treated. Mordor's disciplined pack-level scope, annual refresh, and dual validation give users a balanced figure that sits between overly narrow and overly broad tallies.
Benchmark comparison
| Market Size | Anonymized source | Primary gap driver |
|---|---|---|
| USD 3.05 bn (2025) | Mordor Intelligence | - |
| USD 2.50 bn (2024) | Regional Consultancy A | Combines Canada & Mexico; leaves out pouches and institutional formats |
| USD 0.30 bn (2024) | Global Consultancy B | Tracks only glass primary packs; omits flexible film and food-service channel |
The comparison shows that figures shrink when coverage narrows and rise when extra territories slip in. By anchoring to transparent variables and repeating the same steps each cycle, Mordor delivers a dependable baseline that decision-makers can trace, replicate, and defend.


Key Questions Answered in the Report
What is the current value of the US jam, jelly, and preserves market?
The US jam, jelly, and preserves market is valued at USD 3.18 billion in 2026 and is forecast to reach USD 3.91 billion by 2031.
Which product type dominates US sales?
Jam and jelly commands 65.62% of 2025 sales, while preserves is the fastest-growing sub-category at a 4.86% CAGR through 2031.
Why are pouches gaining popularity?
Pouches provide portion control, convenience, and lighter shipping weights, helping the pack type grow at a 6.05% CAGR and appeal to on-the-go households.
Which region offers the highest growth opportunity?
The West exhibits the quickest 4.9% CAGR, buoyed by health-focused consumers and proximity to abundant fruit supply in California.
Page last updated on:


