Network Attached Storage (NAS) Market Size and Share
Market Overview
| Study Period | 2020 - 2031 |
|---|---|
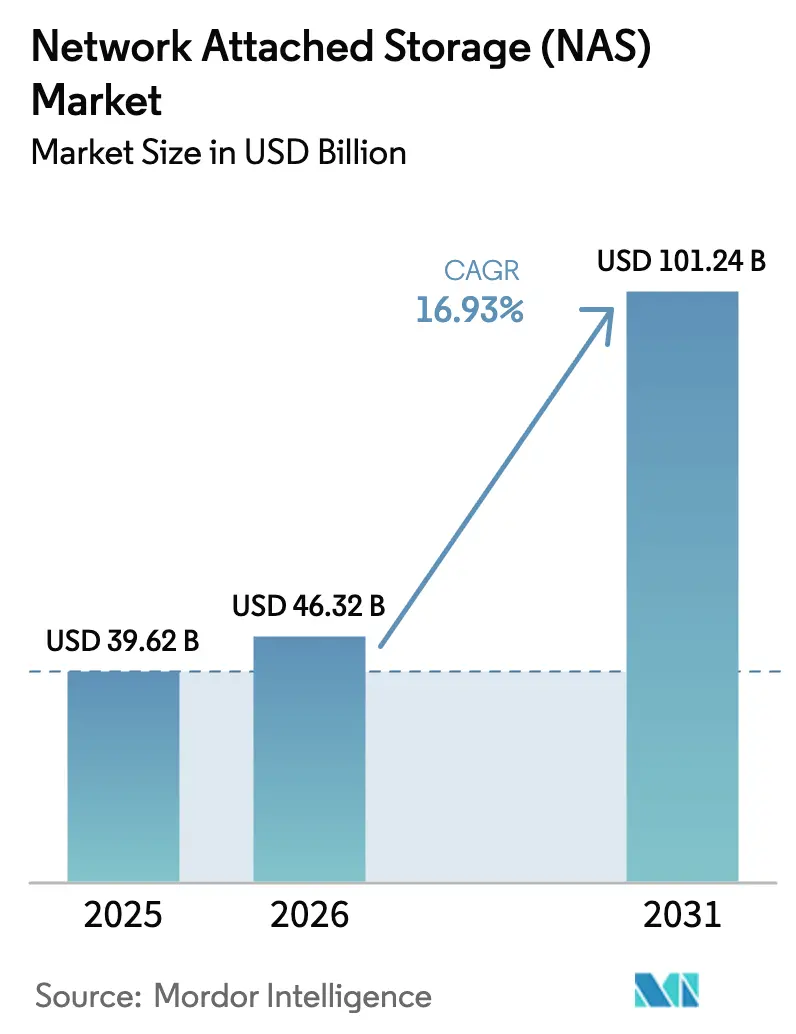
| Market Size (2026) | USD 46.32 Billion |
| Market Size (2031) | USD 101.24 Billion |
| Growth Rate (2026 - 2031) | 16.93% CAGR |
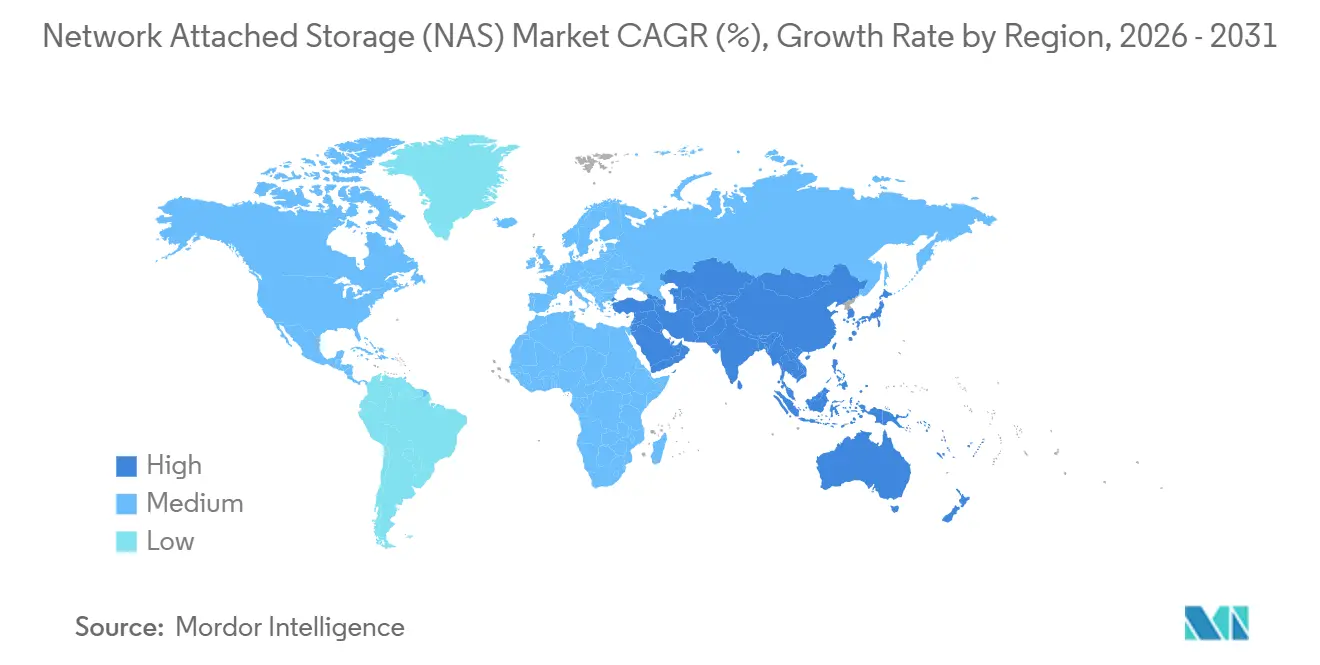
| Fastest Growing Market | Asia Pacific |
| Largest Market | North America |
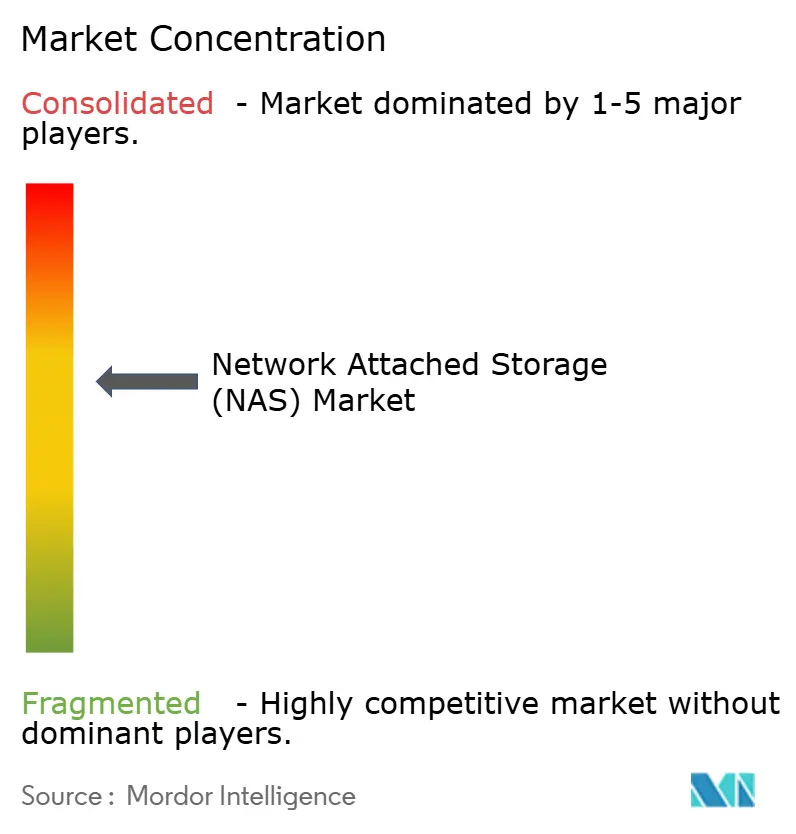
| Market Concentration | Medium |
Major Players *Disclaimer: Major Players sorted in no particular order Image © Mordor Intelligence. Reuse requires attribution under CC BY 4.0. | |
Network Attached Storage (NAS) Market Analysis by Mordor Intelligence
The Network Attached Storage Market size was valued at USD 39.62 billion in 2025 and is estimated to grow from USD 46.32 billion in 2026 to reach USD 101.24 billion by 2031, at a CAGR of 16.93% during the forecast period (2026-2031).
This growth reflects enterprises’ pivot toward file-storage systems that align with generative AI, hybrid-work persistence, and data-sovereignty mandates, reshaping procurement priorities and vendor roadmaps. Scale-out architectures, with their horizontal scalability and controller-less performance gains, continue to displace traditional scale-up designs as organizations target parallel file access for AI model checkpointing. On-premise systems still dominate because of latency, compliance, and egress-fee concerns, yet hybrid tiers that automatically shuttle cold files to object storage are multiplying fastest. Reshoring of NAS production, tariff-related cost pressures, and energy limits in dense urban data centers together temper the pace of cloud substitution and further reinforce demand for modular, power-efficient appliances that fit constrained footprints.
Key Report Takeaways
- By type, scale-out systems accounted for 53.81% of the network-attached storage market share in 2025. Further, this type is forecast to expand at a 17.33% CAGR through 2031, the fastest among all categories.
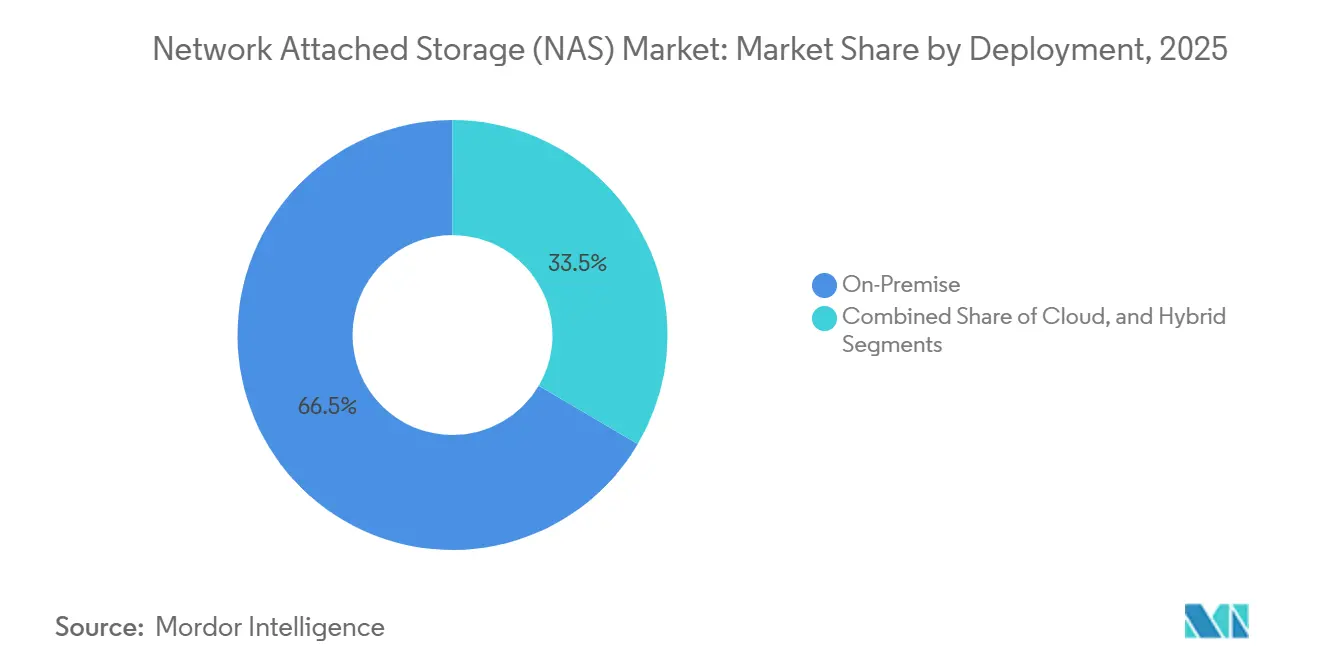
- By deployment, on-premises accounted for 66.53% of the network-attached storage market share in 2025, whereas hybrid configurations are set to rise at a 17.44% CAGR between 2026 and 2031.
- By end-user industry, IT and Telecom accounted for 28.61% of the network-attached storage market share in 2025, while healthcare is advancing at an 18.47% CAGR through 2031.
- By product tier, mid-market accounted for 45.91% of the network-attached storage market share in 2025; high-end/enterprise is the fastest-growing tier at a 17.56% CAGR through 2031.
- By geography, North America held 39.66% revenue share of the network-attached storage market in 2025; Asia-Pacific is advancing at a 17.91% CAGR through 2031.
Note: Market size and forecast figures in this report are generated using Mordor Intelligence’s proprietary estimation framework, updated with the latest available data and insights as of January 2026.
Global Network Attached Storage (NAS) Market Trends and Insights
Drivers Impact Analysis*
| Driver | (~) % Impact on CAGR Forecast | Geographic Relevance | Impact Timeline |
|---|---|---|---|
| Explosion of Unstructured Data | +3.2% | Global, with concentration in North America, Europe, and Asia-Pacific | Medium term (2-4 years) |
| Remote and Hybrid-Work Data Surge | +2.8% | Global, particularly North America and Europe | Short term (≤ 2 years) |
| Data-Center Virtualization and Software-Defined NAS | +2.4% | North America, Europe, and Asia-Pacific enterprise markets | Medium term (2-4 years) |
| AI/ML Training Workloads Need Parallel File Access | +3.5% | North America and Asia-Pacific AI hubs, spillover to Europe | Long term (≥ 4 years) |
| 5G Edge Build-Out Boosts On-Prem NAS | +1.9% | Asia-Pacific core, North America metro areas, Middle East smart cities | Medium term (2-4 years) |
| Tariff-Driven Reshoring of NAS Production | +1.4% | North America and Europe manufacturing regions | Short term (≤ 2 years) |
| Source: Mordor Intelligence | |||
Explosion of Unstructured Data
Up to 80% of enterprise information now arrives in unstructured form, and annual growth rates near 50% drive urgent capacity expansion on file-based platforms. Video surveillance, IoT telemetry, and collaborative content overwhelm legacy scale-up controllers, pushing buyers toward scalable clusters that add nodes without disrupting service. A parallel shift replaces backup-centric thinking with analytics-centric strategies, as data-lake projects rely on NAS to query files directly instead of staging them in data warehouses. Regulatory file-retention rules, such as SEC 17a-4 for broker-dealers, prolong on-premise storage lifecycles because cloud egress costs and jurisdictional risks complicate retention in object stores. Retailers likewise consolidate point-of-sale logs and omnichannel transcripts onto deduplicated NAS volumes that compress petabyte estates into affordable footprints.[1]U.S. Securities and Exchange Commission, “Rule 17a-4: Records to be Preserved,” SEC.gov
Remote and Hybrid-Work Data Surge
Permanent hybrid work doubled home-directory creation rates, magnifying branch-office storage traffic and fueling demand for edge-NAS appliances that cache files close to users. VPN-integrated NAS devices synchronize with core data centers overnight, cutting WAN bandwidth needs by more than 40%. Telehealth rollouts during 2025 generated persistent uploads of consultation recordings that hospitals store on HIPAA-compliant appliances, maintaining role-based access and immutable logs. Universities moved lecture videos onto local arrays after discovering that streaming archives from cloud regions incurred USD 0.09 per gigabyte in egress fees, a cost unsustainable at multi-terabyte scales.[2]U.S. Department of Health and Human Services, “HIPAA Security Rule: Technical Safeguards,” HHS.gov
Data-Center Virtualization And Software-Defined NAS
Hypervisor suites now embed file-share services into software-defined nodes, letting teams allocate capacity on commodity servers while scaling performance separately via NVMe drive pools. The model supports multitenancy, reduces capital spending by as much as one-third, and simplifies disaster-recovery failover by pushing replicas into temporary cloud instances, then repatriating them once local hardware is restored. HPE Alletra and NetApp ONTAP Select demonstrate these efficiencies in production, and many midsize firms adopt the pattern to sidestep tariffs on fully integrated arrays.[3]Hewlett Packard Enterprise, “HPE Alletra Storage MP Technical Specifications,” HPE.com
AI/ML Training Workloads Need Parallel File Access
Transformer models with 100 billion + parameters demand aggregate throughput beyond 200 GB/s for checkpoint operations. Scale-out NAS systems deliver the necessary parallelism through pNFS, GPUDirect, and NVMe-over-Fabrics to stream data directly into GPU memory. Pharmaceutical, automotive, and finance research clusters therefore favor on-premise NVMe-backed arrays over cloud object storage, as repeated S3 fetches eclipse on-site costs within two years of continuous operation. NVIDIA’s DGX SuperPOD underscores the architectural imperative by prescribing NAS arrays capable of 15 million IOPS to avoid GPU idle time.[4]NVIDIA Corporation, “DGX SuperPOD Reference Architecture,” NVIDIA.com
Restraints Impact Analysis*
| Restraint | (~) % Impact on CAGR Forecast | Geographic Relevance | Impact Timeline |
|---|---|---|---|
| Cloud-Storage Substitution | -2.1% | Global, particularly North America and Europe | Medium term (2-4 years) |
| Performance Bottlenecks at Petabyte Scale | -1.3% | Global enterprise and hyperscale deployments | Long term (≥ 4 years) |
| Rising Cyber-Insurance Premiums for On-Prem File Systems | -0.9% | North America and Europe | Short term (≤ 2 years) |
| Power-Density Caps in Urban Data Centers | -0.7% | Asia-Pacific metros, Europe urban centers | Medium term (2-4 years) |
| Source: Mordor Intelligence | |||
Cloud-Storage Substitution
Hyperscaler object stores undercut NAS for cold archives, prompting some teams to offload backup volumes to pay-as-you-go buckets. However, egress charges near USD 90,000 per petabyte discourage retrieval, locking data in cloud silos and complicating analytics that require local proximity. Media studios confronted this when editing 4K masters, and many responded by adopting hybrid appliances that pin hot content on-site while tiering aged assets to Glacier or Archive classes.
Performance Bottlenecks at Petabyte Scale
Traditional dual-controller systems stall under billions of inodes, with metadata operations serialized into latency spikes that break sub-millisecond targets. Scale-out designs alleviate the bottleneck yet introduce namespace-management complexity and lengthy rebuild windows for 20 TB drives. Vendors now embed erasure coding and distributed parity while transitioning to NVMe-over-Fabrics interfaces; nevertheless, cost barriers restrict these high-end features to AI labs and high-frequency trading floors.
*Our forecasts treat driver/restraint impacts as directional, not additive. The impact forecasts reflect baseline growth, mix effects, and variable interactions.
Segment Analysis
By Type: Scale-Out Dominance Driven By AI Parallelism
Scale-out platforms captured 53.81% of 2025 revenue in the network attached storage market and will grow at a 17.33% CAGR through 2031. Their node-level elasticity lets operators align capacity and throughput with unpredictable AI training surges, enabling 200 GB/s aggregate bandwidth for GPU clusters. In turn, scale-out clusters often replace Hadoop Distributed File System deployments because standard NFS and SMB simplify application integration. Scale-up systems maintain a foothold among midsize firms that prize management simplicity over petabyte ambitions, but controller ceilings appear once file counts push beyond 100 million sessions.
Scale-up appliances remain attractive at price points below USD 10,000, dominated by Synology and QNAP units that address small departments. Yet their dual-controller architectures face CPU and RAM bottlenecks as clients proliferate, limiting viability in hyperscale AI environments. Consequently, the network attached storage market size for scale-up platforms is likely to expand more slowly than the overall 16.93% pace.


By End-User Industry: Healthcare Acceleration Fueled By Imaging And Genomics
Healthcare leads growth at an 18.47% CAGR, driven by daily ingestion of terabytes of DICOM scans and genomic sequences. Electronic-health-record vendors integrate directly with NAS arrays, reinforcing demand for on-premise file stores that satisfy HIPAA and GDPR. IT and telecom firms, which held 28.61% network attached storage market share in 2025, spearheaded early virtualization and remain the largest spender, but maturation tempers their expansion rate.
BFSI players rely on tamper-proof NAS archives for regulatory communication logs, while retail and e-commerce operators use deduplication to store omnichannel transcripts efficiently. Media studios sustain heavy parallel-workflow demands, pushing all-flash NAS adoption, whereas government, education, and manufacturing accelerate modestly on sovereign-data and predictive-maintenance drivers. The network attached storage market size attributable to healthcare workloads is projected to eclipse USD 20 billion by 2031.
By Deployment: Hybrid Configurations Balancing Cost And Performance
On-premise systems still delivered 66.53% of 2025 revenue, yet hybrid tiers advance fastest at a 17.44% CAGR as enterprises automate cloud tiering for cold archives. Unified-namespace software, exemplified by NetApp Cloud Volumes ONTAP, lets administrators move data without altering application mounts. Businesses trim local capacity needs 40-60% while avoiding bulk transfers that accrue prohibitive egress costs. Managed cloud NAS appeals for development environments and seasonal bursts, but variable IOPS and residency risks keep latency-sensitive datasets local. The network attached storage market size attached to hybrid deployments will almost double between 2026 and 2031.

By Product Tier: Enterprise Systems Capturing AI Infrastructure Spend
Enterprise arrays priced above USD 500,000 per petabyte are growing at 17.56% CAGR, feeding AI-training clusters that demand 10 million IOPS and GPUDirect migration paths. Dell PowerScale, NetApp AFF, and HPE Alletra dominate the tier by integrating inline data reduction and autonomous balancing. Mid-market platforms, holding 45.91% of 2025 revenue, deliver up to 1 PB capacity at sub-USD 50,000 budgets. They retain loyal SMB clients but face substitution from public-cloud file services for low-duty-cycle workloads. Meanwhile, SOHO devices confront direct competition from Dropbox, Google Workspace, and similar object-storage offerings, yet creative professionals still procure local arrays to avoid rendering delays.
Geography Analysis
North America accounted for 39.66% of network attached storage market revenue in 2025, supported by USD 120 billion-plus hyperscaler data-center spending and regulations that mandate tamper-proof on-premise storage. U.S. federal agencies deploy FedRAMP-authorized, air-gapped appliances for classified workloads, while Canadian banks rely on local arrays to avoid cross-border PIPEDA conflicts. Mexico’s automotive factories add edge-NAS nodes that perform real-time quality inspections without cloud latency.
Asia-Pacific is the fastest-growing region at 17.91% CAGR, propelled by China’s USD 50 billion data-center build-out and India’s Digital India residency rules. Japanese autonomous-vehicle pilots and South Korean 5G edge rollouts depend on sub-10 ms local storage, catalyzing demand for ruggedized appliances. In India, HIPAA-equivalent health regulations steer hospitals toward sovereign NAS clusters, boosting the region’s share of the network attached storage market.
Europe embraces hybrid deployments to navigate GDPR and DORA requirements that complicate multi-region cloud architectures. German Industry 4.0 plants store sensor telemetry locally for predictive analytics, while the United Kingdom’s MiFID II rules extend tape-replacement cycles and sustain archive NAS budgets. France’s HDS mandate keeps patient data inside certified on-premise infrastructure, driving further appliance sales.
Middle East and Africa experience double-digit growth on the back of smart-city mega-projects. Saudi Arabia’s Vision 2030 funding underwrites NEOM’s massive edge-NAS rollout, caching 8K video feeds at tens of thousands of cameras. UAE retailers replicate similar architectures inside malls, and Israel deploys air-gapped clusters for defense analytics. South African finance and Egyptian municipal IT likewise invest to comply with data-protection statutes, although unreliable power grids impede broader adoption across sub-Saharan regions.

Competitive Landscape
The top five vendors together hold roughly 45-50% share, placing the market in a moderately concentrated band. Dell Technologies, NetApp, and Hewlett Packard Enterprise continue to dominate enterprise bids by integrating predictive analytics, inline encryption, and autonomous tiering. Each has introduced consumption-based subscription models that wrap hardware, software, and support into opex contracts attractive to financial controllers.
Pure Storage and Huawei gain traction with all-flash or software-defined propositions that push density and throughput while reducing rack footprint by more than 60%. Synology and QNAP secure the mid-market through aggressively priced appliances and simplified management that eliminates the need for full-time storage engineers. Open-source builds using TrueNAS also nibble at market edges as cost-sensitive buyers assemble white-box clusters on commodity servers.
A flurry of patents in erasure coding and NVMe-over-Fabrics shows intensifying R&D as vendors race to offer 15 million IOPS in sub-10U footprints without exceeding power caps. ISO 27001, SOC 2, and soon DORA certifications have become prerequisites in regulated verticals, raising compliance barriers for smaller entrants.
Network Attached Storage (NAS) Industry Leaders
Hewlett-Packard Development Company
Dell Technologies Inc.
NetApp Inc.
Synology Inc.
Western Digital Corp.
- *Disclaimer: Major Players sorted in no particular order

Recent Industry Developments
- October 2025: Dell Technologies launched PowerScale F910, an all-NVMe scale-out NAS platform tuned for AI clusters.
- October 2025: Synology released DSM 7.3 with disks-failure-prediction and hybrid-tiering features.
- August 2025: Western Digital introduced 24 TB SMR HDDs optimized for archival NAS workloads.
- April 2025: IBM shipped Storage Scale 5.2, adding inline dedupe and S3 gateways for hybrid tiers.


Research Methodology Framework and Report Scope
Market Definitions and Key Coverage
Our study treats the network-attached storage (NAS) market as the revenue generated from purpose-built file-level storage appliances that attach to TCP/IP or InfiniBand networks and present a shared namespace to client devices. Systems can be on-premise, cloud-integrated, or hybrid, provided they retain NAS semantics, embedded controllers, and native file protocols such as NFS, SMB, or AFP.
Scope exclusion: Pure object stores, direct-attached drives, storage area networks, and standalone public-cloud file shares that are not marketed as NAS are purposely left outside the boundary.
Segmentation Overview
- By Type
- Scale-Up
- Scale-Out
- By End-User Industry
- BFSI
- IT and Telecom
- Healthcare
- Retail and E-Commerce
- Media and Entertainment
- Government and Public Sector
- Education and Manufacturing
- Other End-User Industries
- By Deployment
- On-Premise
- Cloud
- Hybrid
- By Product Tier
- High-End / Enterprise
- Mid-Market
- Low-End / SOHO
- By Geography
- North America
- United States
- Canada
- Mexico
- South America
- Brazil
- Argentina
- Rest of South America
- Europe
- United Kingdom
- Germany
- France
- Italy
- Spain
- Rest of Europe
- Asia-Pacific
- China
- Japan
- India
- South Korea
- Rest of Asia-Pacific
- Middle East and Africa
- Middle East
- Israel
- Saudi Arabia
- United Arab Emirates
- Turkey
- Rest of Middle East
- Africa
- South Africa
- Egypt
- Rest of Africa
- Middle East
- North America
Detailed Research Methodology and Data Validation
Primary Research
Mordor analysts interviewed NAS engineers at regional system integrators, channel partners in North America, Europe, and Asia, and procurement managers from healthcare and media firms. These calls tested density assumptions, average selling prices, and emerging hybrid adoption patterns that secondary sources rarely quantify. Follow-up surveys with VARs confirmed refresh cycles and typical capacity per rack.
Desk Research
We began with granular trade statistics and public filings from sources such as the International Trade Center, United States Census IT hardware import tables, and Eurostat production indices. Industry usage data from the ITU, workload trends in IEEE Xplore papers, and price trackers in IDC quarterly storage trackers provided demand levers. Company-level shipment data was extracted from D&B Hoovers, while news and deal flows were screened through Dow Jones Factiva to sense near-term capacity moves. These materials built the factual spine for sizing.
Additional context was drawn from national telecom regulators, storage user groups, and patent families accessed via Questel, which highlighted architecture shifts toward scale-out clusters. This list is illustrative; many other openly available and subscription sources supported validation and clarification.
Market-Sizing & Forecasting
A top-down production and trade data reconstruct estimated annual unit pools, which were then multiplied by blended ASPs to arrive at 2024 and 2025 values. Results were checked with sampled bottom-up supplier roll-ups and channel checks to catch under or over-statement. Key model drivers include unstructured data creation per employee, edge workload attach rates, flash price curves, rack power budgets, regulatory data sovereignty mandates, and 5G edge node counts. Forecasts to 2030 rely on multivariate regression with scenario analysis, letting capacity growth, ASP erosion, and workload dispersion act as leading indicators.
Data Validation & Update Cycle
Outputs pass variance screening, peer review, and senior analyst sign-off. Reports refresh annually, with interim reruns when material events such as tariff changes or NAND shortages occur. A last-minute sense check before delivery guarantees clients receive the freshest baseline.
Why Mordor's Network Attached Storage Baseline Commands High Credibility
Published numbers often diverge because firms frame scope differently, convert currencies on separate cut-off dates, or lock in historical ASP paths before new flash price drops land.
Key gap drivers here include whether home consumer units are counted, if OEM software subscriptions are bundled, and how quickly analysts refresh currency and price decks. Mordor's page isolates enterprise, mid-market, and prosumer units, applies quarterly ASP updates, and revisits model variables every twelve months, which keeps our 2025 view balanced.
Benchmark comparison
| Market Size | Anonymized source | Primary gap driver |
|---|---|---|
| USD 39.60 B (2025) | Mordor Intelligence | - |
| USD 46.97 B (2025) | Global Consultancy A | Includes pure cloud file services and uses static 2024 FX rates |
| USD 34.50 B (2024) | Trade Journal B | Excludes hybrid NAS, projects with single-region growth multipliers |
| USD 28.80 B (2023) | Industry Outlook C | Relies on dated shipment estimates and assumes flat ASPs |
Taken together, the comparison shows that Mordor's disciplined scope selection, quarterly price recalibration, and mixed top-down and bottom-up validation yield a transparent baseline that decision makers can retrace and replicate with confidence.


Key Questions Answered in the Report
How large is the network attached storage market in 2026?
It stands at USD 46.32 billion and is on track to more than double by 2031, growing at a 16.93% CAGR.
Which end-user vertical shows the fastest growth in NAS demand?
Healthcare leads with an 18.47% CAGR, driven by imaging archives and genomics pipelines that require on-premise, low-latency storage.
Why are hybrid NAS deployments gaining popularity?
Enterprises blend on-premise performance with cloud economics, automatically tiering cold data to object storage while keeping hot datasets local to avoid egress fees and latency penalties.
What makes scale-out NAS preferable for AI workloads?
Scale-out clusters distribute metadata and I/O across nodes, delivering 200 GB/s or more of throughput that GPU training routines require for model checkpointing.
Which regions are expanding NAS capacity most rapidly?
Asia-Pacific is the fastest-growing region, advancing at 17.91% CAGR on the back of massive data-center construction in China, India, and 5G edge rollouts across Japan and South Korea.
How fragmented is the vendor landscape?
The top five vendors hold under 50% share, signaling moderate concentration that still allows emerging players like Pure Storage and Huawei to carve high-growth niches.
Page last updated on:


