Market Overview
| Study Period | 2020 - 2031 |
|---|---|
| Market Size (2026) | USD 6.38 Billion |
| Market Size (2031) | USD 15.98 Billion |
| Growth Rate (2025 - 2030) | 20.16% CAGR |
| Fastest Growing Market | Asia-Pacific |
| Largest Market | North America |
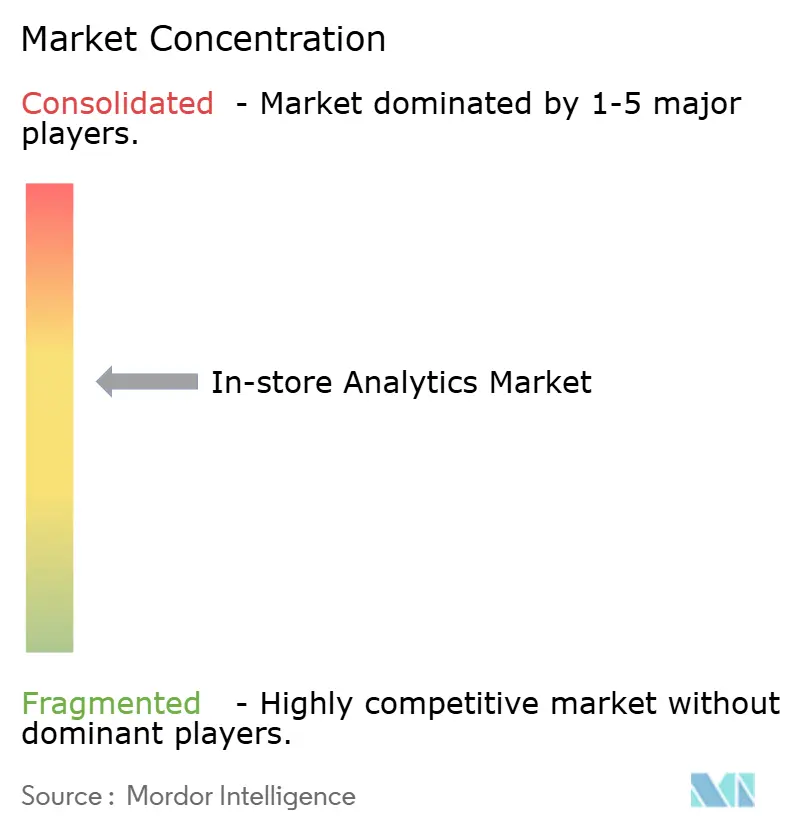
| Market Concentration | Medium |
Major Players *Disclaimer: Major Players sorted in no particular order Image © Mordor Intelligence. Reuse requires attribution under CC BY 4.0. | |
In-store Analytics Market Analysis by Mordor Intelligence
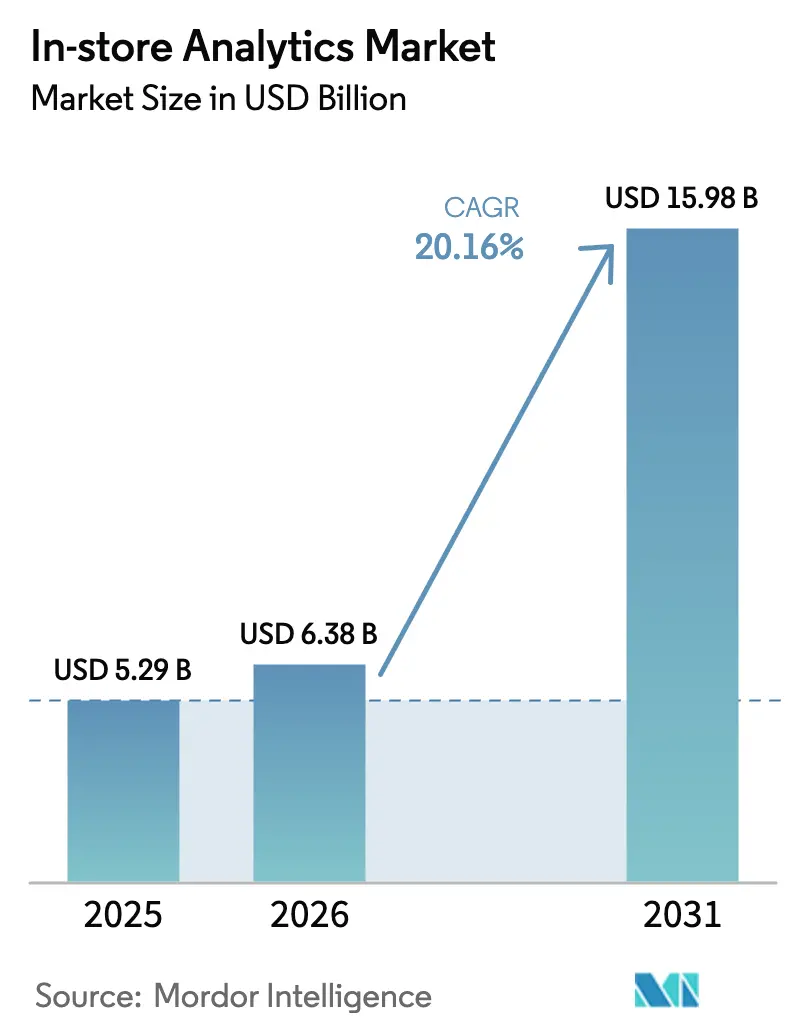
The in-store analytics market size is expected to increase from USD 5.29 billion in 2025 to USD 6.38 billion in 2026 and reach USD 15.98 billion by 2031, growing at a CAGR of 20.16% over 2026-2031. The widening adoption of edge-enabled cameras, sensor meshes, and on-device AI chips is accelerating capital reallocation away from legacy point-of-sale systems toward real-time shopper-intelligence stacks.[1]Google Cloud, “Vision AI for Retail,” cloud.google.com Retailers see a direct revenue lift from dynamic pricing engines that recalibrate shelf labels within seconds, delivering basket-size gains of 5%-22% and providing the investment rationale for denser sensor deployments. Cloud platforms now bundle retail-specific computer vision APIs, compressing time-to-insight and enabling regional chains to match the analytical sophistication of national competitors. Meanwhile, compliance-ready governance frameworks are reducing regulatory friction, allowing European grocers to meet GDPR Article 22 audit mandates while preserving hybrid edge-cloud flexibility.
Key Report Takeaways
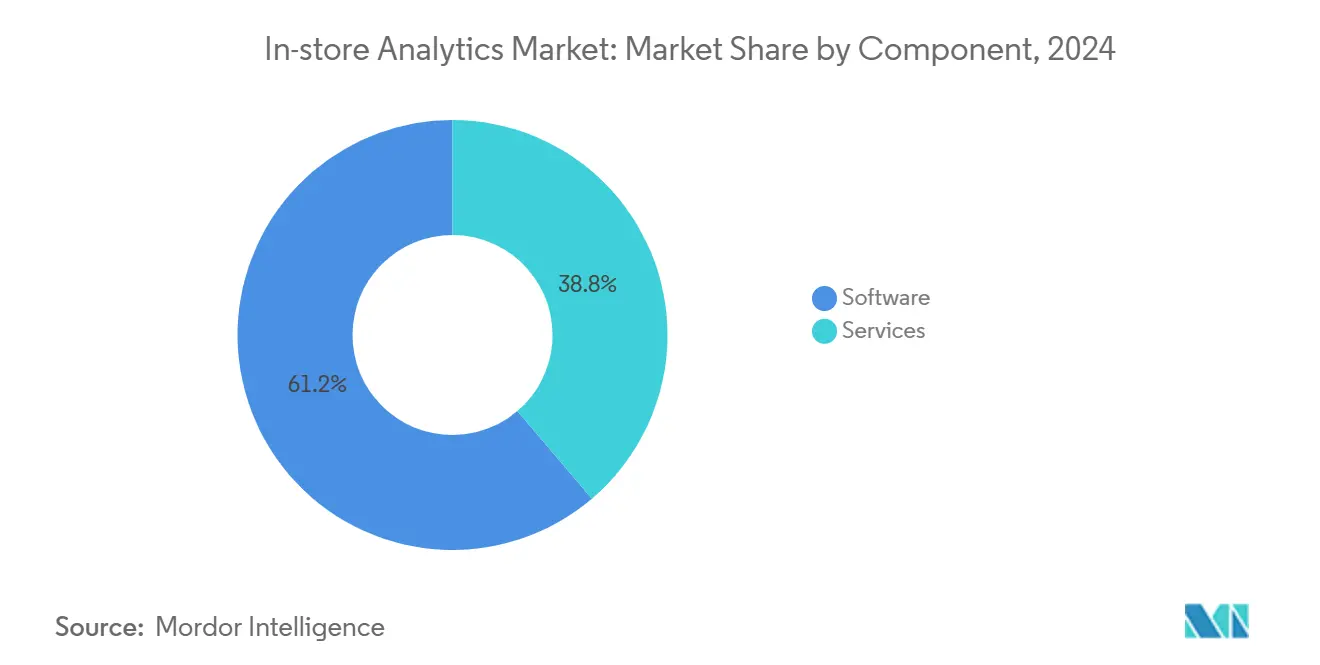
- By component, software accounted for 70.01% of 2025 revenue, while services are advancing at 28.40% CAGR as retailers outsource implementation to close skills gaps.
- By deployment, cloud deployments captured 64.83% of 2025 revenue and are growing at 29.70% CAGR because hyperscalers embed retail-specific AI models into infrastructure offerings.
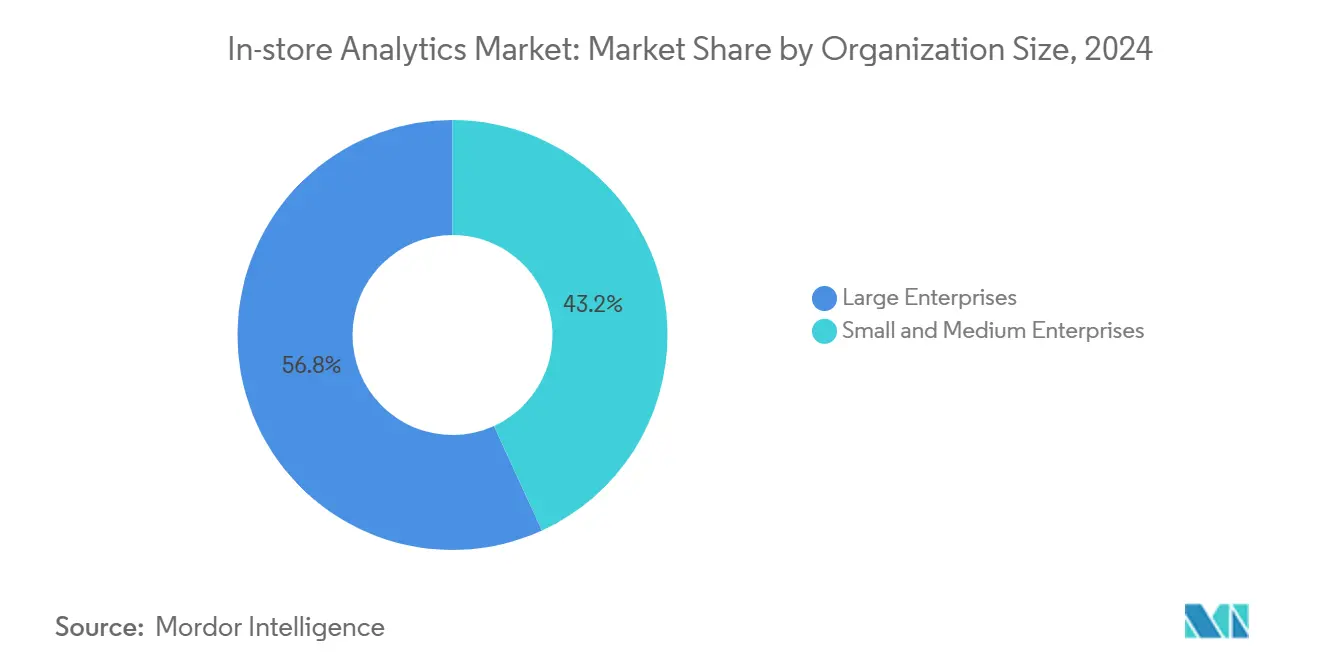
- By organization size, large enterprises held 62.11% of 2025 revenue, yet small and medium enterprises are expanding at 31.20% CAGR on the back of low-code SaaS bundles.
- By application, customer management led applications with 36.86% 2025 revenue, whereas marketing management is the fastest growing use case at 30.01% CAGR through 2031.
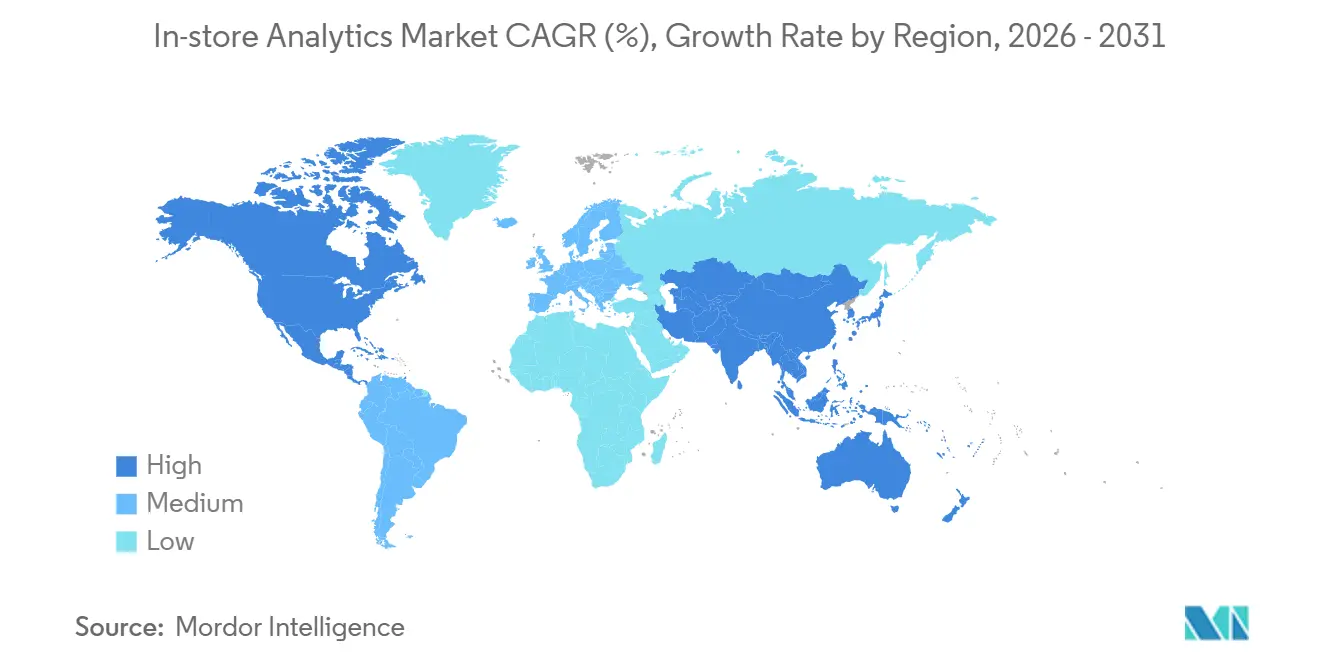
- By geography, North America commanded 38.32% of 2025 revenue, while Asia-Pacific is registering the quickest regional expansion at 27.40% CAGR.
Note: Market size and forecast figures in this report are generated using Mordor Intelligence’s proprietary estimation framework, updated with the latest available data and insights as of January 2026.
Global In-store Analytics Market Trends and Insights
Drivers Impact Analysis*
| Driver | (~) % Impact on CAGR Forecast | Geographic Relevance | Impact Timeline |
|---|---|---|---|
| Cloud-Native & Edge-Enabled Deployments | +4.2% | Global, with North America and Europe leading adoption | Medium term (2-4 years) |
| Need for Better Customer Service & Enhanced Shopping Experience | +3.8% | Global, particularly strong in North America and the Asia-Pacific | Short term (≤ 2 years) |
| Real-Time Computer Vision & Video Analytics Breakthroughs | +4.5% | Global, with APAC manufacturing hubs accelerating hardware innovation | Medium term (2-4 years) |
| Dynamic Pricing Models Driven by In-Store Data | +3.1% | North America and Europe, expanding to APAC urban centers | Short term (≤ 2 years) |
| Integration of In-Store Analytics with Retail Media Networks | +2.9% | North America core, spill-over to Europe and select APAC markets | Medium term (2-4 years) |
| On-Device AI Chips Powering Battery-Free Shelf Cameras | +2.4% | Global, with early pilots in North America and Japan | Long term (≥ 4 years) |
| Source: Mordor Intelligence | |||
Cloud-Native and Edge-Enabled Deployments
Hyperscalers now expose shelf-compliance and planogram-verification APIs via simple REST calls, eliminating the need for in-house model training and shrinking deployment cycles from months to days. AWS Edge Manager for Retail supports over-the-air camera firmware updates, synchronizing inference results with centralized data lakes in near real time. Intel-optimized OpenVINO appliances process up to 30 video streams at <75 watts, balancing performance and energy consumption for European supermarkets.[2]Intel, “OpenVINO Deployments in European Supermarkets,” intel.com Serverless compute, lightweight containers, and 5G backhaul collectively democratize advanced analytics once reserved for Fortune 500 retailers. As retailers standardize on hybrid stacks, vendors able to orchestrate seamless edge-to-cloud workflows win a disproportionate share.
Need for Better Customer Service and Enhanced Shopping Experience
Automated shelf-gap detection reduces out-of-stock incidents by 30%, freeing associates to focus on high-value engagement that lifts comparable-store sales by 4%.[3]Zebra Technologies, “SmartSight Platform Results,” zebra.com Occupancy heatmaps integrated with queue-management algorithms trigger staff redeployment when wait times exceed three minutes, improving checkout throughput in more than 2,000 Japanese convenience stores. Video analytics also power hyper-personalized interactions; pilots dispatch associates armed with loyalty data whenever dwell time in front of a category exceeds pre-set thresholds. These use cases satisfy 68% of consumers who say knowledgeable staff is the primary reason to visit physical stores over e-commerce. By merging digital signals with in-store context, retailers elevate service without swelling payroll costs.
Real-Time Computer Vision and Video Analytics Breakthroughs
Transformer-based vision models enable sub-100 millisecond inference on edge devices, unlocking real-time decisions that shape staffing and merchandising. A single Jetson AGX Orin now tracks multiple objects across 16 cameras, quadrupling coverage compared with the previous generation. Synthetic data fused with federated learning trims demographic bias by 23%, strengthening compliance with emerging fairness mandates. Shrinking form factors remove HVAC dependence, easing retrofits in older stores. Together these breakthroughs reposition computer vision from a back-office audit tool to a frontline decision engine.
Dynamic Pricing Models Driven by In-Store Data
Electronic shelf labels linked to real-time demand let grocers adjust prices up to 12 times daily, lifting revenue by 5%-22% in multi-country pilots. SAP’s optimization module ingests inventory velocity detected by shelf cameras and recalibrates markdown cadences, already live across 150 retailers. French regulators now require electronic price changes to be logged and auditable for 12 months, setting a compliance template for the wider European Union. Structured guardrails therefore coexist with data-driven price agility, allowing scale rollouts without sparking consumer backlash.
Restraints Impact Analysis*
| Restraint | (~) % Impact on CAGR Forecast | Geographic Relevance | Impact Timeline |
|---|---|---|---|
| Lack of Personnel Skills to Operationalize Insights | -2.7% | Global, particularly acute in emerging markets and SME segments | Medium term (2-4 years) |
| High Up-Front Sensor & Camera Retrofit Costs | -3.2% | Global, with stronger impact on independent retailers and regional chains | Short term (≤ 2 years) |
| Retailer Data-Sovereignty Concerns Over Cloud Storage | -2.1% | Europe and Asia-Pacific, driven by GDPR and localization mandates | Medium term (2-4 years) |
| Rising Energy Costs of GPU-Edge Appliances | -1.8% | Europe and select Asia-Pacific markets with high electricity tariffs | Short term (≤ 2 years) |
| Source: Mordor Intelligence | |||
Lack of Personnel Skills to Operationalize Insights
Firms face AI-skills gaps, with retail analytics positions staying open 50% longer than general IT roles, hampering time-to-value for projects. Mid-market chains lacking in-house data scientists often struggle to translate terabytes of video data into merchandising actions. Vendors counter by embedding automated insight generation that surfaces prioritized recommendations without manual querying. Yet these tools still assume a baseline level of statistical competence, widening the performance gap between digital leaders and laggards.
High Up-Front Sensor and Camera Retrofit Costs
North American retailers, 64% of whom were surveyed by Deloitte, cited the cost of a single retrofit as a significant hurdle. The retrofit process, which involves the installation of ceiling cameras, GPU edge servers, and upgraded networks, can cost between USD 50,000 and 150,000 per store. This substantial investment poses a challenge for many retailers, particularly smaller businesses. However, sensor-as-a-service models are emerging as a viable alternative to mitigate these costs. These models bundle essential components, including hardware, software, and ongoing support, into monthly subscription fees, reducing the initial financial outlay by as much as 80%. Despite this cost-saving approach, stores with annual revenues under USD 5 million often face payback periods of several years. This extended timeline for return on investment is creating a growing divide within the retail market. Larger retail chains, with their greater financial resources, can efficiently amortize these investments over time. In contrast, independent stores, constrained by limited budgets, are either delaying the adoption of these technologies or opting for less accurate, low-fidelity counters as a compromise.
*Our forecasts treat driver/restraint impacts as directional, not additive. The impact forecasts reflect baseline growth, mix effects, and variable interactions.
Segment Analysis
By Component: Services Surge as Retailers Seek Turnkey Deployments
Services are expanding at 28.40% CAGR through 2031, outpacing the overall in-store analytics market growth because retailers outsource integration and managed analytics to close internal talent shortages. Software retained 70.01% of 2025 revenue as SaaS platforms delivered vision APIs and dashboards via subscription, yet complexity in marrying these tools with ERP, point-of-sale, and supply-chain systems drives demand for professional services. Capgemini expanded retail-analytics headcount by 35% in 2025, reflecting rising turnkey project volumes. IBM consulting engagements incorporating watsonx governance averaged USD 2.5 million per client, underscoring the premium for compliance-ready architectures.
Software itself is bifurcating between horizontal platforms and vertical solutions optimized for specific store formats. Oracle’s Retail AI Foundation embeds demand-forecasting and shrink-detection models directly into its cloud ERP, cutting deployment timelines from six months to six weeks for existing customers. Vendors offering vendor-agnostic integration layers enable retailers to combine best-of-breed components while averting lock-in, sustaining double-digit services revenue growth.


By Deployment: Hybrid Architectures Blend Cloud Scale with Edge Latency
Cloud deployments commanded 64.83% of 2025 revenue and are growing at 29.70% CAGR as hyperscalers insert retail-specific AI models into infrastructure offerings, streamlining updates and central analytics. Yet latency-sensitive use cases like autonomous checkout or real-time theft detection still require on-premises inference engines. The pragmatic outcome is a hybrid topology where edge appliances process video locally to stay within sub-50 millisecond targets, while aggregated insights feed cloud data lakes for machine-learning retraining. AWS Outposts for Retail co-locate rack-mounted AWS servers in store backrooms, maintaining residency for sensitive biometric data while exposing the broader AWS service catalog.
Microsoft Azure’s collaboration with Trax preprocesses shelf images on associate smartphones before cloud validation, cutting egress fees by 60% and cycling planogram feedback in under 90 seconds. Anticipated passage of the EU AI Act by 2027 amplifies demand for audit logs and region-resident infrastructure, cementing hybrid as the default architecture in regulated markets.
By Organization Size: SMEs Accelerate Adoption via Modular SaaS
Small and medium enterprises (SMEs) are expanding at 31.20% CAGR, the swiftest pace across size bands, as modular SaaS platforms slash entry barriers. Dor Technologies offers door-mounted foot-traffic sensors at USD 99 per month with zero upfront fees, enabling more than 3,000 independents to embrace basic analytics during 2025. Cloud4Wi infers dwell time from anonymized Wi-Fi pings and now covers 5,000 locations across Europe and Latin America. These plug-and-play models democratize data insights but still leave SMEs juggling interpretation, leading vendors to embed prescriptive recommendations that automate translation from metric to action.
Large enterprises, which held 62.11% of 2025 revenue, continue to dominate in absolute spending because they can fund multi-year rollouts and negotiate enterprise license agreements. However, as federated-learning frameworks and low-code dashboards mature, the adoption gap between large chains and SMEs is narrowing, broadening the in-store analytics market addressable base.
By Application: Marketing Management Gains as Retail Media Scales
Customer management led 2025 revenue at 36.86%, encompassing loyalty optimization and queue management that elevate shopper satisfaction. Marketing management is the fastest growing segment at 30.01% CAGR through 2031, fueled by links between in-store analytics and booming retail media networks that price digital end-caps based on real-time foot traffic. Store-operations management remains foundational as labor-scheduling and shrink-prevention gains deliver quick ROI, particularly for grocers with thin margins. Merchandise management gains traction in fashion and electronics where rapid product cycles reward visual accuracy.
Regulatory scrutiny around AI-driven pricing propels risk and compliance management software uptake. Johnson Controls’ Sensormatic module now logs every automated price change for 12 months to meet French audit rules, signaling a broader trend toward embedded compliance. Unified video pipelines that support multiple applications simultaneously improve capital efficiency and accelerate ROI across departmental budgets.
Geography Analysis
North America contributed 38.32% of 2025 revenue as mature omnichannel infrastructures and high labor costs justify automation investments. Pilot deployments of autonomous-checkout models by chains like Amazon Fresh showcase near-term demand for sub-second inference, sustaining leadership in the in-store analytics market. Asia-Pacific is the fastest expanding region at 27.40% CAGR, underpinned by China’s social-commerce fusion, India’s Unified Payments Interface enabling digital-first store formats, and Japan’s aging workforce driving robotics investment. These factors compound to accelerate the in-store analytics market size across APAC urban centers despite heterogeneous infrastructure baselines.
Europe faces GDPR-linked compliance overhead that initially slows adoption, yet premium grocers in Germany and the United Kingdom now deploy computer vision to curb food waste and meet ESG reporting mandates. Electronic shelf labels tied to dynamic pricing have already become mainstream among French supermarkets following the Directorate General’s 2025 guidelines, illustrating how clear rules can unlock pent-up demand. South America shows growing uptake in modern-trade formats, while currency volatility and capital constraints limit pace among domestic chains.
Middle Eastern smart-city initiatives in Dubai and Riyadh mandate sensor-ready retail infrastructure, enabling malls to embed analytics at construction rather than retrofit stages. African adoption remains embryonic beyond South Africa and Nigeria due to power instability and bandwidth costs, though franchisees of global quick-service brands pilot low-power occupancy sensors to optimize staffing. Vendors tailoring deployment to regional regulatory and infrastructure realities will capture outsize share as emerging markets mature.

Competitive Landscape
In the in-store analytics market, the top five vendors command a combined revenue share of approximately 35%-40% for 2025, highlighting a significant opportunity for niche specialists. Major enterprise software players, including SAP, Oracle, and IBM, integrate analytics into their ERP and CRM suites. By doing so, they capitalize on their established user bases instead of directly competing on standalone analytics features. While this strategy pressures pricing for dedicated analytics firms, it simultaneously introduces integration challenges, creating opportunities for consultancies and systems integrators. Startups carve out their niches: Trax specializes in CPG planogram compliance, RetailNext focuses on omnichannel journey analytics, and Scanalytics champions privacy-preserving floor sensors.
Technology stands as the primary competitive differentiator. NVIDIA’s Metropolis partner program boasts over 200 ISVs, with their applications pre-validated on Jetson hardware. This strategy not only solidifies NVIDIA's ecosystem but also increases switching costs for retailers. A surge in patent filings related to privacy-preserving on-device anonymization hints at impending regulatory scrutiny. Venture capital is flowing into companies like Axelera AI, which are pioneering neuromorphic chips. Their focus is on energy-efficient, sub-watt shelf cameras that operate without batteries. As major players seek to bolster their portfolios and accelerate market entry, M&A activity is set to escalate. This trend is tightening the concentration of the in-store analytics market, yet still leaves space for innovative newcomers focusing on cost, power, and compliance enhancements.
Regional dynamics also play a crucial role in shaping the in-store analytics market. North America leads in adoption due to its advanced retail infrastructure and high investment in technology. Europe follows closely, driven by stringent data privacy regulations and a focus on sustainability. Meanwhile, the Asia-Pacific region is witnessing rapid growth, fueled by expanding retail sectors in countries like China and India. These regional variations create diverse opportunities for vendors to tailor their offerings and address specific market needs effectively.
In-store Analytics Industry Leaders
Capgemini SE
RetailNext Inc.
Happiest Minds Technologies Ltd.
Capillary Technologies Global Pte. Ltd.
Thinkinside SRL
- *Disclaimer: Major Players sorted in no particular order

Recent Industry Developments
- January 2026: Oracle announced a USD 6.5 billion expansion of its cloud infrastructure across North America and Europe, adding retail-dedicated GPU clusters.
- December 2025: SAP and NVIDIA formalized a multi-year partnership to embed GPU-accelerated analytics into S/4HANA Cloud, cutting stockouts by 15% in early grocery deployments.
- November 2025: Trax Technology Solutions secured USD 100 million Series E funding to expand into Latin America and Southeast Asia.
- October 2025: Zebra Technologies launched SmartSight 2.0, blending RFID and video analytics to reduce out-of-stocks by 30%.


Global In-store Analytics Market Report Scope
The In-store Analytics analyzed and pulled meaningful insights from customers' behavioral data and focused on optimizing store performance through the cloud and on-premise deployment platform, which drives the market through an application such as customer management, risk and compliance management, store operations management, merchandise management, among others.
The In-store Analytics Market Report is Segmented by Component (Software, and Services), Deployment (Cloud, and On-Premises), Organization Size (Large Enterprises, and Small and Medium Enterprises), Application (Customer Management, Risk and Compliance Management, Store Operations Management, Merchandise Management, and More), and Geography. The Market Forecasts are Provided in Terms of Value (USD).
By Component
| Software |
| Services |
By Deployment
| Cloud |
| On-Premises |
By Organization Size
| Large Enterprises |
| Small and Medium Enterprises |
By Application
| Customer Management |
| Risk and Compliance Management |
| Store Operations Management |
| Merchandise Management |
| Other Applications |
By Geography
| North America | United States | |
| Canada | ||
| Mexico | ||
| South America | Brazil | |
| Argentina | ||
| Rest of South America | ||
| Europe | Germany | |
| United Kingdom | ||
| France | ||
| Italy | ||
| Spain | ||
| Rest of Europe | ||
| Asia Pacific | China | |
| Japan | ||
| South Korea | ||
| India | ||
| Australia | ||
| New Zealand | ||
| Rest of Asia-Pacific | ||
| Middle East and Africa | Middle East | United Arab Emirates |
| Saudi Arabia | ||
| Turkey | ||
| Rest of Middle East | ||
| Africa | South Africa | |
| Nigeria | ||
| Kenya | ||
| Rest of Africa | ||
| By Component | Software | ||
| Services | |||
| By Deployment | Cloud | ||
| On-Premises | |||
| By Organization Size | Large Enterprises | ||
| Small and Medium Enterprises | |||
| By Application | Customer Management | ||
| Risk and Compliance Management | |||
| Store Operations Management | |||
| Merchandise Management | |||
| Other Applications | |||
| By Geography | North America | United States | |
| Canada | |||
| Mexico | |||
| South America | Brazil | ||
| Argentina | |||
| Rest of South America | |||
| Europe | Germany | ||
| United Kingdom | |||
| France | |||
| Italy | |||
| Spain | |||
| Rest of Europe | |||
| Asia Pacific | China | ||
| Japan | |||
| South Korea | |||
| India | |||
| Australia | |||
| New Zealand | |||
| Rest of Asia-Pacific | |||
| Middle East and Africa | Middle East | United Arab Emirates | |
| Saudi Arabia | |||
| Turkey | |||
| Rest of Middle East | |||
| Africa | South Africa | ||
| Nigeria | |||
| Kenya | |||
| Rest of Africa | |||


Key Questions Answered in the Report
What is the current value of the in-store analytics market?
The market stands at USD 6.38 billion in 2026 and is on track to reach USD 15.98 billion by 2031.
How fast is the in-store analytics market expected to grow?
It is projected to clock a 20.16% CAGR during the 2026-2031 forecast window.
Which component segment is expanding the quickest?
Services lead in growth, climbing at 28.40% CAGR as retailers seek turnkey deployments.
Which region is showing the highest growth momentum?
Asia-Pacific is advancing at 27.40% CAGR thanks to social-commerce integration and digital-first store formats.
Page last updated on:


