North America MLCC Market Size and Share
Market Overview
| Study Period | 2020 - 2031 |
|---|---|
| Forecast Data Period | 2026 - 2031 |
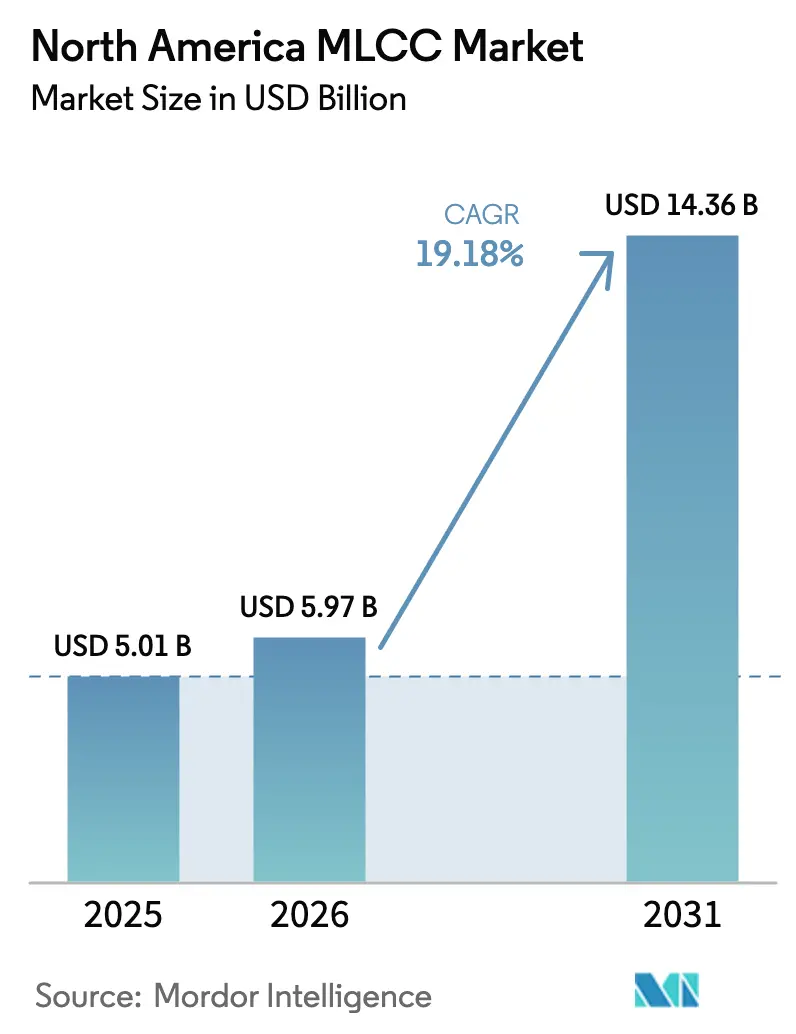
| Base Year Market Size (2025) | USD 5.01 Billion |
| Market Size (2026) | USD 5.97 Billion |
| Market Size (2031) | USD 14.36 Billion |
| Growth Rate (2026 - 2031) | 19.18% CAGR |
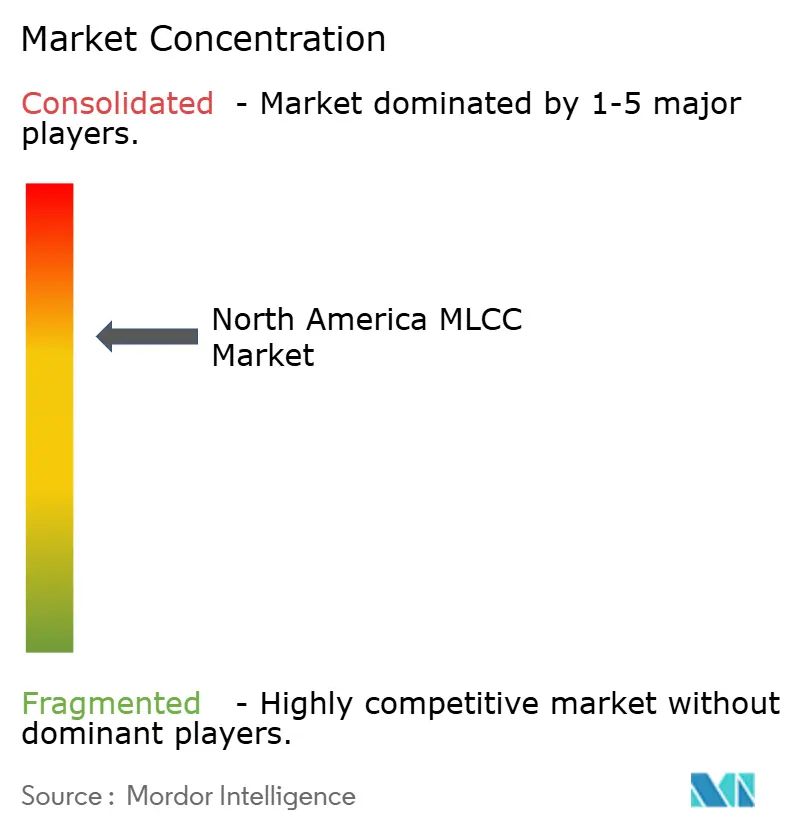
| Market Concentration | Medium |
Major Players *Disclaimer: Major Players sorted in no particular order Image © Mordor Intelligence. Reuse requires attribution under CC BY 4.0. | |
North America MLCC Market Analysis by Mordor Intelligence
The North America MLCC market size is expected to grow from USD 5.01 billion in 2025 to USD 5.97 billion in 2026 and is forecast to reach USD 14.36 billion by 2031 at 19.18% CAGR over 2026-2031. The North America MLCC market benefits from a synchronized surge in semiconductor fabrication, 5G infrastructure roll-outs, and rapid vehicle electrification, each pushing demand for higher-reliability, higher-capacitance multilayer ceramic capacitors. Supply-side momentum is reinforced by the U.S. CHIPS and Science Act, which accelerates the construction of new wafer fabs and adjacent electronics ecosystems through its incentives, while USMCA regional-value rules favor local component sourcing. The penetration of ADAS in light vehicles, miniaturization of 5G smartphones, and the shift to AI servers collectively raise per-unit MLCC counts, supporting pricing resilience despite historical raw-material volatility. Established Japanese, Korean, and Taiwanese suppliers preserve technological leadership in high-reliability grades, even as select U.S. firms double capacity to alleviate strategic sourcing risks.
Key Report Takeaways
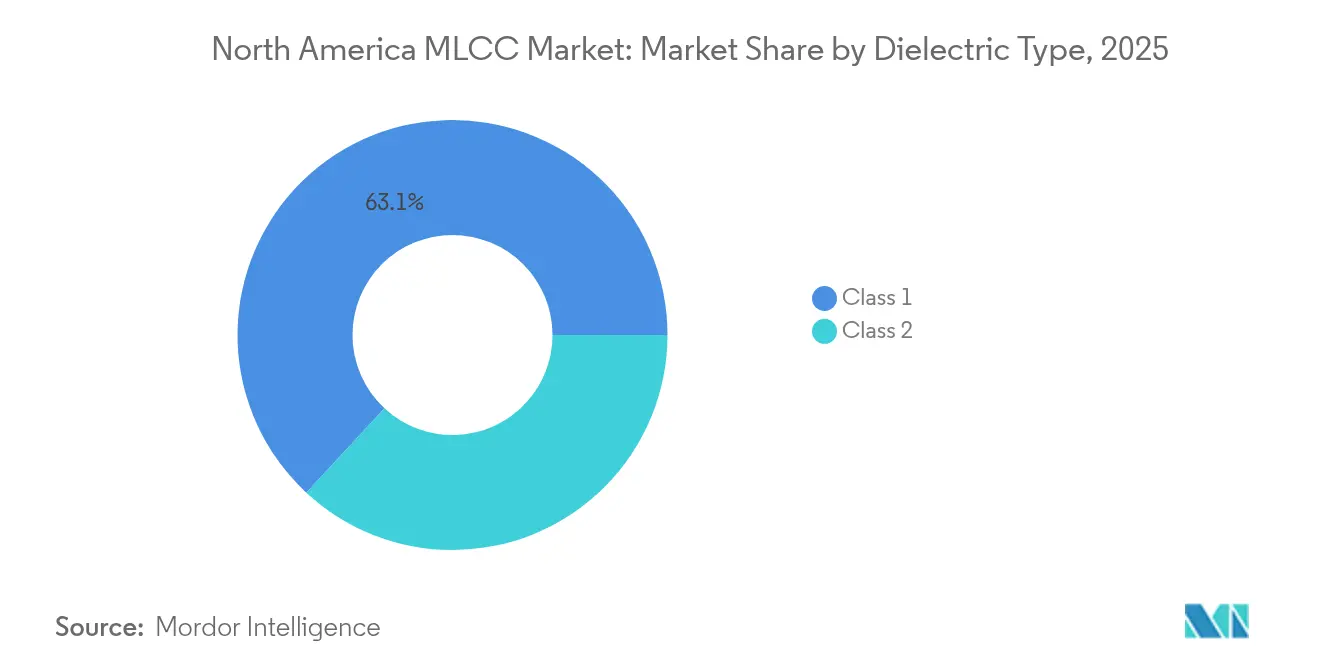
- By Dielectric Type, Class 1 dielectric devices led with 63.10% share of the North America MLCC market in 2025; the same category is projected to grow at a 20.43% CAGR through 2031, the fastest within dielectric types.
- By Case Size, the 201 case size held a 55.62% share in 2025, whereas the 402 devices represented the fastest-expanding format, with a 20.08% CAGR, reflecting 5G handset densification.
- By Voltage, Low-voltage (≤100 V) MLCCs commanded 58.70% share in 2025; however, the mid-voltage band (100-500 V) records the highest CAGR at 20.15% to support 48 V automotive architectures.
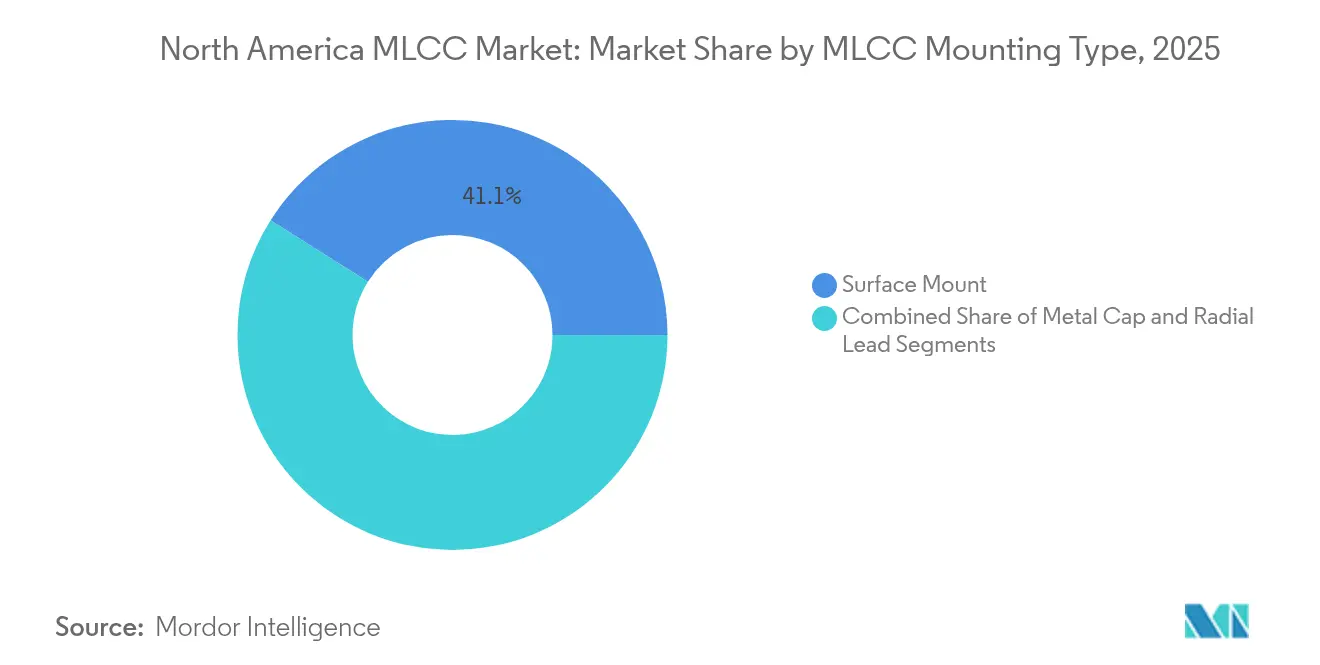
- By MLCC Mounting Type, surface-mount technology accounted for 41.05% of mounting demand in 2025, while metal-cap devices posted a 20.65% share, driven by the adoption of Gapower modules.
- By End-User Application, Consumer electronics retained a 50.62% application share in 2025, while automotive use cases led growth with a 20.57% CAGR, driven by EV platform proliferation.
- By Geography, the United States represented 63.90% of regional demand in 2025 and is expected to show a 20.55% CAGR through 2031, underpinned by domestic semiconductor and automotive reinvestment.
Note: Market size and forecast figures in this report are generated using Mordor Intelligence’s proprietary estimation framework, updated with the latest available data and insights as of 2026.
North America MLCC Market Trends and Insights
Drivers Impact Analysis*
| Driver | (~) % Impact on CAGR Forecast | Geographic Relevance | Impact Timeline |
|---|---|---|---|
| Surging ADAS-equipped vehicle production | +4.2% | United States and Canada | Medium term (2-4 years) |
| 5G smartphone ramp-up demanding high-capacitance MLCCs | +3.8% | Core North American handset markets | Short term (≤ 2 years) |
| Data-center server and storage hardware expansion | +3.5% | United States primary, with Canadian data-center growth | Medium term (2-4 years) |
| Reshoring incentives via U.S. CHIPS and Science Act | +2.8% | United States domestic manufacturing | Medium term (2-4 years) |
| Miniaturization trend in wearable electronics | +2.1% | Global adoption led by North America | Long term (≥ 4 years) |
| GaN power modules requiring high-frequency decoupling | +1.9% | United States and Canada industrial sectors | Long term (≥ 4 years) |
| Source: Mordor Intelligence | |||
Surging ADAS-equipped Vehicle Production
The rising installation of Level 2+ ADAS drives the demand for MLCC content, as radar, LiDAR, and camera modules transition to 48 V electrical backbones that require high-capacitance, high-temperature-stable parts. [1]Samsung Electro-Mechanics, “MLCC for LiDAR Applications,” samsungsem.com Samsung Electro-Mechanics commercialized the first AEC-Q200-qualified 1005 MLCC delivering 2.2 µF at 10 V, filling a critical gap for compact LiDAR boards. The U.S. vehicle mix now averages over 15,000 MLCCs per battery-electric model, significantly higher than the 3,000-10,000 units in internal-combustion formats. USMCA content rules are driving OEMs to localize passive components, thereby strengthening the North America MLCC market supply base. With ADAS penetration expected to surpass 40% of 2024 production, automotive-grade MLCC volumes are projected to see a durable lift.
5G Smartphone Ramp-up Demanding High-Capacitance MLCCs
Next-generation phones integrate multiple sub-6 GHz and mmWave bands, increasing MLCC counts to over 1,000 per premium model. [2]Murata Manufacturing, “MLCC for 5G Smartphones,” murata.com Murata’s 0201 M capacitor packs 0.1 µF into a 0.25 × 0.125 mm outline, freeing PCB area for RF front-end filters while maintaining DC-bias stability. Component shortages during 2017-2021 highlighted allocation risk, as suppliers prioritized handset-class volumes over industrial lines -a dynamic still relevant for the North America MLCC market. Miniaturization also intensifies thermal management challenges, making Class 1 dielectrics preferable due to their stable capacitance under bias.
Data-Center Server and Storage Hardware Expansion
AI servers consume 3,000-4,000 MLCCs each and demand voltage ratings up to 25 V on board-mount regulators. TDK’s compact point-of-load converters position MLCCs adjacent to high-power ASICs, reducing conduction losses. [3]TDK Corporation, “Battling Server Overheating,” tdk.com Domestic fabs stimulated by the CHIPS Act create additional downstream pull for high-reliability capacitors in process equipment and clean-room power distribution. These trends collectively contribute more than 3.5 percentage points to the forecast CAGR of the North America MLCC market.
Miniaturization Trend in Wearable Electronics
Smartwatches and fitness trackers now utilize ultra-small 0.006-inch capacitors, which are in mass production at Murata, resulting in a 75% volume reduction compared to previous-generation parts. Maintaining capacitance in a 0.16 mm body requires advanced ceramic formulations and ultra-thin electrodes, blurring lines between passive-component and semiconductor processing. Wearable devices expose MLCCs to frequent flexing and rapid thermal excursions, thereby fostering demand for high board-flex strength and low thermal resistance constructions.
Restraints Impact Analysis*
| Restraint | (~) % Impact on CAGR Forecast | Geographic Relevance | Impact Timeline |
|---|---|---|---|
| Recurring supply-demand mismatch / shortages | −3.2% | North America dependent on Asian production | Medium term (2-4 years) |
| Raw-material price volatility (nickel, palladium, silver) | −2.8% | Global commodity supply chains affecting North America | Short term (≤ 2 years) |
| Geopolitical disruptions to Asia-centric MLCC supply chains | −2.5% | Asian manufacturing hubs supplying North American OEMs | Medium term (2-4 years) |
| Manufacturing yield challenges for ultra-small MLCC formats | −1.7% | Global high-density assembly operations | Long term (≥ 4 years) |
| Source: Mordor Intelligence | |||
Raw-Material Price Volatility (Nickel, Palladium, Silver)
Nickel electrodes and precious-metal terminations account for a sizable share of MLCC cost; spikes in nickel or palladium prices immediately compress margins for high-capacitance parts. Although most automotive-grade MLCCs transitioned to base-metal electrodes, residual palladium remains for terminations and special high-reliability grades. Concentration of nickel refining in a handful of geographies exposes the North America MLCC market to abrupt price swings. U.S. initiatives to diversify critical material supply offer partial relief but remain years away from scale.
Recurring Supply-Demand Mismatch / Shortages
The 2017-2021 shortage cycle revealed a chronic imbalance between volume smartphone lines and lower-volume industrial grades, pushing lead times to 30 weeks or more for 1210 and larger formats. Recent U.S. expansions at Johanson Technology have doubled domestic high-voltage capacity, but still trail regional demand for Class 1, high-Q parts. Dependence on Asian fabs continues to be a structural headwind, subtracting 3.2 percentage points from the attainable CAGR for the North America MLCC market.
*Our forecasts treat driver/restraint impacts as directional, not additive. The impact forecasts reflect baseline growth, mix effects, and variable interactions.
Segment Analysis
By Dielectric Type: Class 1 Stability Reinforces Leadership
Class 1 devices accounted for 63.10% of 2025 revenue, underscoring their central role in temperature-critical RF and automotive electronics, where capacitance drift must remain below ±30 ppm/°C. This segment is also forecast to expand briskly at a 20.43% CAGR, the fastest among dielectric families within the North America MLCC market. Miniaturized 1005 and 0402 formats broaden Class 1 adoption inside 5G antennas, advanced driver-assistance modules, and GaN power stages, enabling designers to downsize boards without compromising tolerance. The automotive shift toward 48 V main rails further favors Class 1 parts because their low dissipation factor prevents thermal runaway under elevated bias.
Class 2 MLCCs retain relevance in bulk decoupling for smartphones and laptops due to superior volumetric efficiency, but their DC-bias capacitance loss remains prohibitive for precision nodes. Manufacturers have improved X7R and X5R formulations to mitigate up to 70% capacitance drop at rated voltage; yet, many North American OEMs still risk-allocate these components away from mission-critical loops. As a result, Class 1 gains incremental share, keeping the North America MLCC market on a trajectory where stability outranks raw µF density.


By Case Size: 201 Dominance Meets 402 Acceleration
Devices in the 201 outline accounted for 55.62% of 2025 shipments, achieving a balance between capacitance and assembly yield for mainstream consumer boards. Strong smartphone volumes anchor this leadership, and automotive infotainment modules are increasingly mirroring handset design rules, reinforcing their position. Meanwhile, 402 parts post a leading 20.08% CAGR, propelled by flagship phones and ultra-thin wearables that trade pad real estate for higher part counts. The North America MLCC market share for 402 formats, therefore, widens quickest, compressing average case size across the installed base.
Larger 603 and 1210 footprints remain indispensable where voltage ratings exceed 200 V or where ripple current requirements overpower the thermal limits of smaller parts, such as traction inverters or renewable-energy microinverters. Murata’s 47 µF 0402 unveiling suggests a ceiling is yet unseen for capacitance-per-square-millimeter; nonetheless, assembly defect rates climb steeply below 100 µm body widths, establishing a practical floor that confines 006003 parts chiefly to premium wearables.
By Voltage: Low-Voltage Prevalence Faces Mid-Voltage Upswing
MLCCs rated at ≤100 V captured 58.70% of 2025 demand, primarily driven by smartphone, notebook, and standard 12 V automotive subsystems. Yet, the most vigorous 20.15% CAGR occurs in the 100-500 V bracket, where 48 V vehicles, AI server motherboards, and industrial GaN converters are found. As OEMs strive for efficiency gains through higher bus voltages, capacitance density per volt becomes the key metric. TDK’s 10 µF, 100 V offering in 3225 format illustrates how mid-voltage designs close volumetric disparities that once discouraged adoption.
High-voltage parts exceeding 500 V remain a niche market—supplying grid-tied inverters, motor drives, and defense electronics—but command premium margins due to extended burn-in and reliability tests. Once domestic ceramic-powder pilot lines mature under U.S. reshoring programs, regional availability of these specialty grades is expected to improve, stabilizing the North America MLCC market supply chain across the voltage spectrum.
By MLCC Mounting Type: Surface-Mount Strength Confronts Metal-Cap Niche
Surface-mount parts constituted 41.05% of 2025 volume, propelled by automated assembly lines in phones, notebooks, and increasingly in vehicles. The method’s low cost per placement and compatibility with reflow ovens keep it the default. Yet metal-cap MLCCs grow at the fastest rate, with a 19.83% CAGR, which is suited for high-power GaN modules where thermal interface and mechanical stress exceed surface-mount tolerances. North American industrial OEMs adopt these ruggedized units in EV chargers and robotics drives, adding a premium layer that lifts revenue per device.
Through-hole radial MLCCs continue to serve aerospace and legacy defense electronics, where reworkability and vibration resistance carry more weight than placement speed. As OEM qualification cycles can exceed five years, these through-hole sockets will persist; however, their total share will diminish gradually in line with the North America MLCC market’s pivot toward high-density packaging.
By End-User Application: Automotive Surge Reshapes Mix
Consumer electronics maintained a 50.62% leadership position in 2025; however, the automotive segment’s 20.57% CAGR accelerated its share climb, driven by electrified powertrains and sensor fusion. A battery-electric crossover now integrates up to 20,000 MLCCs, quadrupling the count in a 2019-model gasoline sedan. Samsung Electro-Mechanics targets KRW 1 trillion in automotive MLCC sales for 2024, with a capacity shift toward AEC-Q200 grades.
Industrial automation, renewable energy, and power utilities collectively form a robust secondary pillar that requires high-voltage, high-reliability components. Telecommunications infrastructure is advancing as 5G base-station densification progresses; high-frequency duplexers and beam-forming units rely on Class 1 MLCCs for precise phase accuracy. Medical, aerospace, and defense remain smaller but highly profitable niches, each enforcing strict lot-traceability and extended life testing, cementing the premium tier of the North America MLCC market.
Geography Analysis
The United States generated 63.90% of regional revenue in 2025 and leads in growth, projected at a 20.55% CAGR through 2031, driven by USD 450 billion in announced semiconductor fabs, as well as EV and battery gigafactories. Intel’s Ohio complex, TSMC’s Arizona site, and Samsung’s Texas plant collectively amplify downstream demand for Class 1, high-voltage MLCCs used in wafer steppers, EUV power trains, and clean-room UPS back-ups. These domestic clusters shorten supply lanes and encourage U.S. passive-component spin-ups, underpinning further localization of the North America MLCC market.
Canada’s share, though smaller, benefits from automotive and telecom investments centred in Ontario and Quebec; deployments of 5G small cells and edge data centers bolster mid-range capacitance demand. Federal clean-energy credits drive the demand for solar and wind inverters, adding high-voltage MLCC requirements that diversify away from handset-centric volumes. Prospective U.S. auto tariffs could disrupt integrated supply routes; nonetheless, Canadian OEMs continue sourcing AEC-Q200 grades from regional distributors with increasing stock depth.
Mexico serves as an assembly nexus for passenger-vehicle wire harnesses and electronics modules; the USMCA’s 75% regional-value mandate incentivizes tier-1s to substitute Asian-made passives with North American alternatives. Monterrey-area EMS hubs report a rise in requests for Class 1 0402s used in radar sensor PCBs, illustrating how compliance pressures are reshaping procurement patterns. While currency fluctuations occasionally trim purchasing capacity, proximity to U.S. fabs and ports ensures a steady inflow of high-volume surface-mount MLCCs. Collectively, these dynamics sustain a geographically integrated yet increasingly localized North America MLCC market.
Competitive Landscape
Innovation and Customization Drive Future Success
The market retains moderate concentration, with the top five suppliers-Murata, TDK, Taiyo Yuden, Samsung Electro-Mechanics, and Yageo-collectively holding a share above 70% of regional shipments, driven by their entrenched process know-how and scale. Japanese incumbents maintain high-reliability automotive and industrial positions through vertical integration of ceramic powders and proprietary electrode formulations. Korean and Taiwanese rivals leverage economies of scale to serve handset and notebook OEMs while investing in automotive qualification lines to climb the value chain.
Domestic U.S. producers, led by Johanson Technology, are doubling their high-voltage capacity under the CHIPS Act stimulus, narrowing strategic gaps in aerospace and defense channels. Murata’s 47 µF 0402 milestone and TDK’s 10 µF 100 V automotive MLCC exemplify the innovation race toward higher capacitance and voltage in shrinking footprints. Samsung Electro-Mechanics secures multi-year agreements with Chinese EV leaders, underscoring a pivot from consumer to transport electrification segments. Competitive levers now extend beyond cost to encompass supply-chain resilience, sustainability credentials, and transparent ESG reporting, all rising procurement criteria among North American OEMs. Overall rivalry remains disciplined as high capex and lengthy automotive qualifications deter new entrants, stabilizing pricing even as volumes climb.
North America MLCC Industry Leaders
KYOCERA AVX Components Corporation (Kyocera Corporation)
MARUWA Co., Ltd.
Murata Manufacturing Co., Ltd.
Nippon Chemi-Con Corporation
Samsung Electro-Mechanics Co., Ltd.
- *Disclaimer: Major Players sorted in no particular order

Recent Industry Developments
- October 2025: Murata began world’s first mass production of a 47 µF MLCC in 0402 size, cutting board area by 60% versus 0603 predecessors
- May 2025: Murata invested ¥3 billion to build a new production wing at its Ho Chi Minh plant, set to commence in 2026 for coil and MLCC output
- April 2025: TDK launched the industry’s highest capacitance 100 V MLCC in 3225 case, delivering 10 µF for 48 V automotive rails
- April 2025: Samsung Electro-Mechanics expanded automotive MLCC supply deals with BYD and other EV electronics makers.


North America MLCC Market Report Scope
Class 1, Class 2 are covered as segments by Dielectric Type. 0 201, 0 402, 0 603, 1 005, 1 210, Others are covered as segments by Case Size. 500V to 1000V, Less than 500V, More than 1000V are covered as segments by Voltage. 100µF to 1000µF, Less than 100µF, More than 1000µF are covered as segments by Capacitance. Metal Cap, Radial Lead, Surface Mount are covered as segments by Mlcc Mounting Type. Aerospace and Defence, Automotive, Consumer Electronics, Industrial, Medical Devices, Power and Utilities, Telecommunication, Others are covered as segments by End User. United States, Others are covered as segments by Country.| Class 1 |
| Class 2 |
| 201 |
| 402 |
| 603 |
| 1005 |
| 1210 |
| Other Case Sizes |
| Low Voltage (less than or equal to 100 V) |
| Mid Voltage (100 – 500 V) |
| High Voltage (above 500 V) |
| Metal Cap |
| Radial Lead |
| Surface Mount |
| Aerospace and Defence |
| Automotive |
| Consumer Electronics |
| Industrial |
| Medical Devices |
| Power and Utilities |
| Telecommunication |
| Other End-User Applications |
| By Dielectric Type | Class 1 |
| Class 2 | |
| By Case Size | 201 |
| 402 | |
| 603 | |
| 1005 | |
| 1210 | |
| Other Case Sizes | |
| By Voltage | Low Voltage (less than or equal to 100 V) |
| Mid Voltage (100 – 500 V) | |
| High Voltage (above 500 V) | |
| By MLCC Mounting Type | Metal Cap |
| Radial Lead | |
| Surface Mount | |
| By End-User Application | Aerospace and Defence |
| Automotive | |
| Consumer Electronics | |
| Industrial | |
| Medical Devices | |
| Power and Utilities | |
| Telecommunication | |
| Other End-User Applications |


Market Definition
- MLCC (Multilayer Ceramic Capacitor) - A type of capacitor that consists of multiple layers of ceramic material, alternating with conductive layers, used for energy storage and filtering in electronic circuits.
- Voltage - The maximum voltage that a capacitor can safely withstand without experiencing breakdown or failure. It is typically expressed in volts (V)
- Capacitance - The measure of a capacitor's ability to store electrical charge, expressed in farads (F). It determines the amount of energy that can be stored in the capacitor
- Case Size - The physical dimensions of an MLCC, typically expressed in codes or millimeters, indicating its length, width, and height
| Keyword | Definition |
|---|---|
| MLCC (Multilayer Ceramic Capacitor) | A type of capacitor that consists of multiple layers of ceramic material, alternating with conductive layers, used for energy storage and filtering in electronic circuits. |
| Capacitance | The measure of a capacitor's ability to store electrical charge, expressed in farads (F). It determines the amount of energy that can be stored in the capacitor |
| Voltage Rating | The maximum voltage that a capacitor can safely withstand without experiencing breakdown or failure. It is typically expressed in volts (V) |
| ESR (Equivalent Series Resistance) | The total resistance of a capacitor, including its internal resistance and parasitic resistances. It affects the capacitor's ability to filter high-frequency noise and maintain stability in a circuit. |
| Dielectric Material | The insulating material used between the conductive layers of a capacitor. In MLCCs, commonly used dielectric materials include ceramic materials like barium titanate and ferroelectric materials |
| SMT (Surface Mount Technology) | A method of electronic component assembly that involves mounting components directly onto the surface of a printed circuit board (PCB) instead of through-hole mounting. |
| Solderability | The ability of a component, such as an MLCC, to form a reliable and durable solder joint when subjected to soldering processes. Good solderability is crucial for proper assembly and functionality of MLCCs on PCBs. |
| RoHS (Restriction of Hazardous Substances) | A directive that restricts the use of certain hazardous materials, such as lead, mercury, and cadmium, in electrical and electronic equipment. Compliance with RoHS is essential for automotive MLCCs due to environmental regulations |
| Case Size | The physical dimensions of an MLCC, typically expressed in codes or millimeters, indicating its length, width, and height |
| Flex Cracking | A phenomenon where MLCCs can develop cracks or fractures due to mechanical stress caused by bending or flexing of the PCB. Flex cracking can lead to electrical failures and should be avoided during PCB assembly and handling. |
| Aging | MLCCs can experience changes in their electrical properties over time due to factors like temperature, humidity, and applied voltage. Aging refers to the gradual alteration of MLCC characteristics, which can impact the performance of electronic circuits. |
| ASPs (Average Selling Prices) | The average price at which MLCCs are sold in the market, expressed in USD million. It reflects the average price per unit |
| Voltage | The electrical potential difference across an MLCC, often categorized into low-range voltage, mid-range voltage, and high-range voltage, indicating different voltage levels |
| MLCC RoHS Compliance | Compliance with the Restriction of Hazardous Substances (RoHS) directive, which restricts the use of certain hazardous substances, such as lead, mercury, cadmium, and others, in the manufacturing of MLCCs, promoting environmental protection and safety |
| Mounting Type | The method used to attach MLCCs to a circuit board, such as surface mount, metal cap, and radial lead, which indicates the different mounting configurations |
| Dielectric Type | The type of dielectric material used in MLCCs, often categorized into Class 1 and Class 2, representing different dielectric characteristics and performance |
| Low-Range Voltage | MLCCs designed for applications that require lower voltage levels, typically in the low voltage range |
| Mid-Range Voltage | MLCCs designed for applications that require moderate voltage levels, typically in the middle range of voltage requirements |
| High-Range Voltage | MLCCs designed for applications that require higher voltage levels, typically in the high voltage range |
| Low-Range Capacitance | MLCCs with lower capacitance values, suitable for applications that require smaller energy storage |
| Mid-Range Capacitance | MLCCs with moderate capacitance values, suitable for applications that require intermediate energy storage |
| High-Range Capacitance | MLCCs with higher capacitance values, suitable for applications that require larger energy storage |
| Surface Mount | MLCCs designed for direct surface mounting onto a printed circuit board (PCB), allowing for efficient space utilization and automated assembly |
| Class 1 Dielectric | MLCCs with Class 1 dielectric material, characterized by a high level of stability, low dissipation factor, and low capacitance change over temperature. They are suitable for applications requiring precise capacitance values and stability |
| Class 2 Dielectric | MLCCs with Class 2 dielectric material, characterized by a high capacitance value, high volumetric efficiency, and moderate stability. They are suitable for applications that require higher capacitance values and are less sensitive to capacitance changes over temperature |
| RF (Radio Frequency) | It refers to the range of electromagnetic frequencies used in wireless communication and other applications, typically from 3 kHz to 300 GHz, enabling the transmission and reception of radio signals for various wireless devices and systems. |
| Metal Cap | A protective metal cover used in certain MLCCs (Multilayer Ceramic Capacitors) to enhance durability and shield against external factors like moisture and mechanical stress |
| Radial Lead | A terminal configuration in specific MLCCs where electrical leads extend radially from the ceramic body, facilitating easy insertion and soldering in through-hole mounting applications. |
| Temperature Stability | The ability of MLCCs to maintain their capacitance values and performance characteristics across a range of temperatures, ensuring reliable operation in varying environmental conditions. |
| Low ESR (Equivalent Series Resistance) | MLCCs with low ESR values have minimal resistance to the flow of AC signals, allowing for efficient energy transfer and reduced power losses in high-frequency applications. |


Research Methodology
Mordor Intelligence has followed the following methodology in all our MLCC reports.
- Step 1: Identify Data Points: In this step, we identified key data points crucial for comprehending the MLCC market. This included historical and current production figures, as well as critical device metrics such as attachment rate, sales, production volume, and average selling price. Additionally, we estimated future production volumes and attachment rates for MLCCs in each device category. Lead times were also determined, aiding in forecasting market dynamics by understanding the time required for production and delivery, thereby enhancing the accuracy of our projections.
- Step 2: Identify Key Variables: In this step, we focused on identifying crucial variables essential for constructing a robust forecasting model for the MLCC market. These variables include lead times, trends in raw material prices used in MLCC manufacturing, automotive sales data, consumer electronics sales figures, and electric vehicle (EV) sales statistics. Through an iterative process, we determined the necessary variables for accurate market forecasting and proceeded to develop the forecasting model based on these identified variables.
- Step 3: Build a Market Model: In this step, we utilized production data and key industry trend variables, such as average pricing, attachment rate, and forecasted production data, to construct a comprehensive market estimation model. By integrating these critical variables, we developed a robust framework for accurately forecasting market trends and dynamics, thereby facilitating informed decision-making within the MLCC market landscape.
- Step 4: Validate and Finalize: In this crucial step, all market numbers and variables derived through an internal mathematical model were validated through an extensive network of primary research experts from all the markets studied. The respondents are selected across levels and functions to generate a holistic picture of the market studied.
- Step 5: Research Outputs: Syndicated Reports, Custom Consulting Assignments, Databases, and Subscription Platform


