United States MLCC Market Size and Share
Market Overview
| Study Period | 2020 - 2031 |
|---|---|
| Forecast Data Period | 2026 - 2031 |
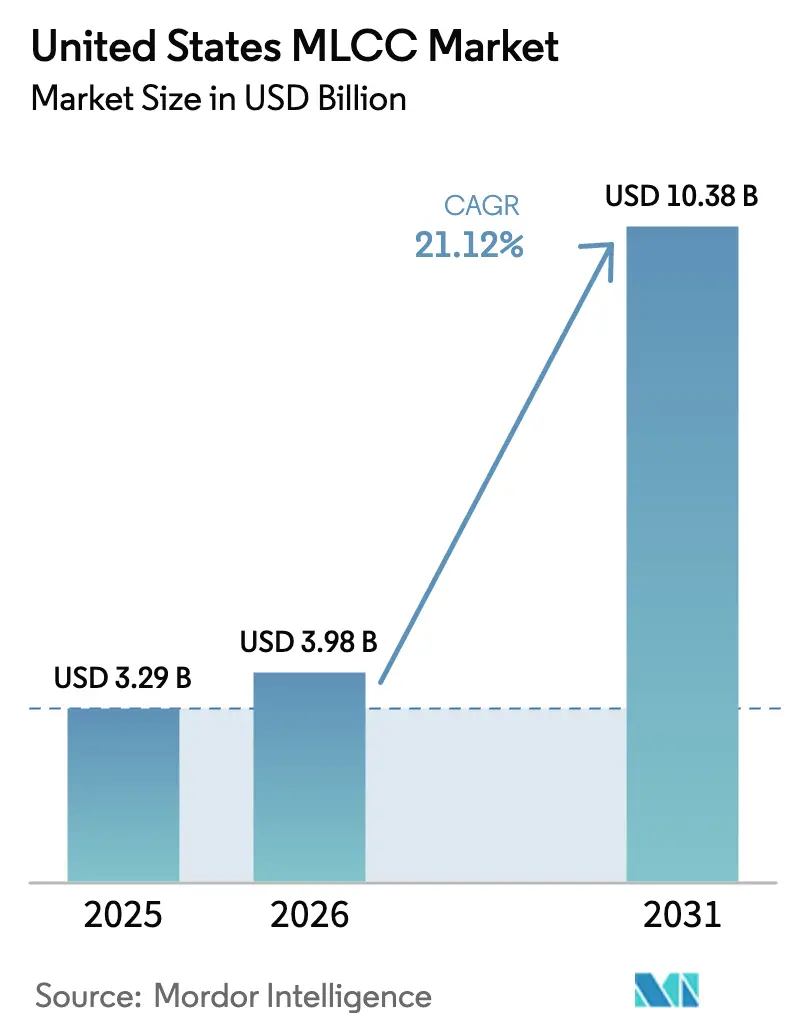
| Base Year Market Size (2025) | USD 3.29 Billion |
| Market Size (2026) | USD 3.98 Billion |
| Market Size (2031) | USD 10.38 Billion |
| Growth Rate (2026 - 2031) | 21.12% CAGR |
| Market Concentration | Medium |
Major Players *Disclaimer: Major Players sorted in no particular order Image © Mordor Intelligence. Reuse requires attribution under CC BY 4.0. | |
United States MLCC Market Analysis by Mordor Intelligence
The United States MLCC market size was valued at USD 3.29 billion in 2025 and estimated to grow from USD 3.98 billion in 2026 to reach USD 10.38 billion by 2031, at a CAGR of 21.12% during the forecast period (2026-2031). The robust electrification of transportation, multi-gigabit 5G network builds, and a surge in hyperscale data center projects are converging to lift the MLCC market across every high-reliability application. Domestic semiconductor capacity expansions backed by the CHIPS Act provide long-range order visibility to U.S. passive-component suppliers. At the same time, the miniaturization of smartphones and wearables keeps density requirements high, sustaining premium pricing for sub-0201 packages. Material-science breakthroughs in high-permittivity ceramics and ultra-low ESL electrode designs further differentiate suppliers capable of serving the growing demand for high-frequency, high-temperature, and high-voltage designs.
Key Report Takeaways
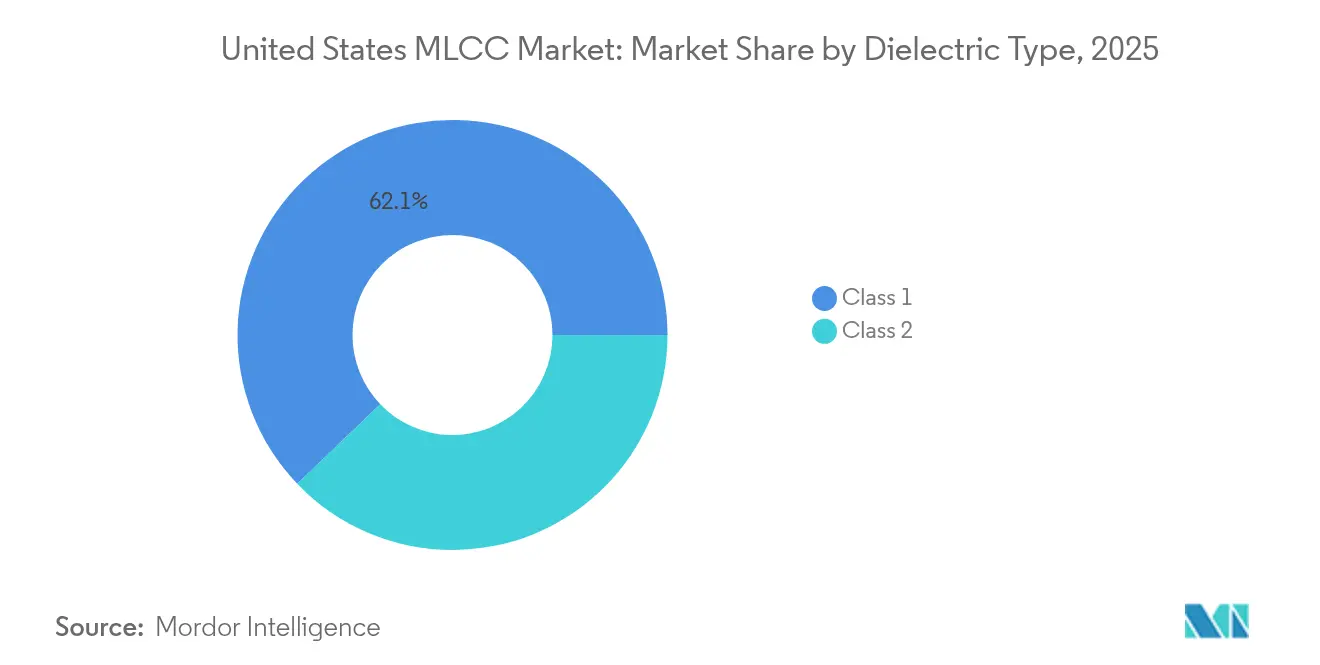
- By dielectric type, Class 1 parts held 62.15% of the MLCC market share in 2025; the same dielectric group is projected to expand at a 22.65% CAGR through 2031.
- By case size, the 201 package accounted for 55.92% of the MLCC market size in 2025, whereas the 402 package is projected to register a 22.10% CAGR to 2031.
- By voltage rating, low-voltage (≤100 V) devices captured 58.77% of the 2025 base and are forecast to grow at a 21.95% CAGR through 2031.
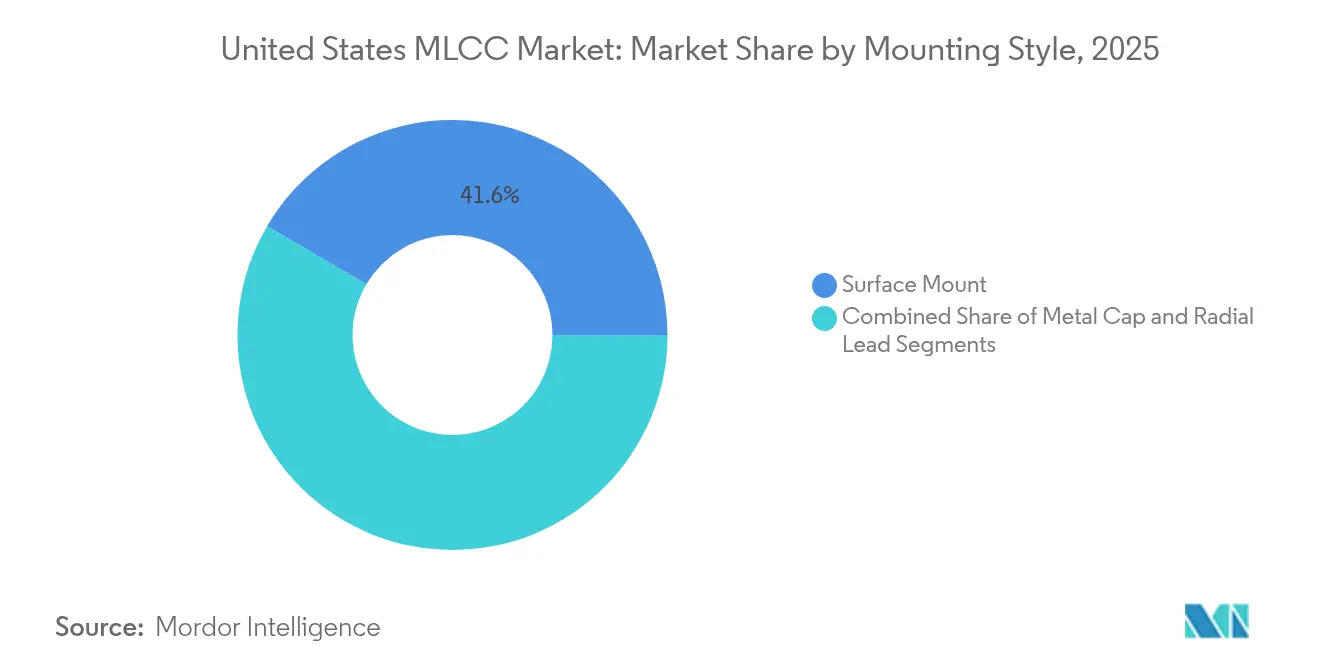
- By mounting style, surface-mount parts secured a 41.55% share in 2025; metal-cap devices are projected to show the highest growth at a 21.80% CAGR.
- By end use, consumer electronics accounted for 50.88% of 2025 demand, while automotive applications are expected to grow at a 22.90% CAGR through 2031.
Note: Market size and forecast figures in this report are generated using Mordor Intelligence’s proprietary estimation framework, updated with the latest available data and insights as of 2026.
United States MLCC Market Trends and Insights
Drivers Impact Analysis*
| Driver | (~) % Impact on CAGR Forecast | Geographic Relevance | Impact Timeline |
|---|---|---|---|
| Rapid growth in EV and HEV production | +4.2% | Global, with strong concentration in North America | Medium term (2-4 years) |
| Miniaturization of smartphones and wearables | +3.8% | Global, with emphasis on North America and Asia | Short term (≤ 2 years) |
| 5G / 6G infrastructure roll-out | +3.5% | North America, with spillover to allied markets | Medium term (2-4 years) |
| Explosion of IoT nodes in U.S. smart-home market | +2.9% | National, with early gains in metropolitan areas | Short term (≤ 2 years) |
| Hyperscale AI-server build-outs | +4.1% | North America, concentrated in data center hubs | Long term (≥ 4 years) |
| SiC/GaN fast-charging power modules adoption | +3.2% | Global, with North American leadership in automotive | Long term (≥ 4 years) |
| Source: Mordor Intelligence | |||
Rapid Growth in EV and HEV Production
Vehicle electrification is driving an increase in MLCC content, as battery-electric and plug-in hybrid platforms rely on high-density power-conversion rails and extensive sensor networks. Software-defined architectures within next-generation vehicles require fine-grained voltage regulation, necessitating premium AEC-Q200-qualified capacitors. Large automotive design cycles create durable revenue streams for suppliers that pass stringent reliability screening. Domestic battery-plant announcements in Georgia, Tennessee, and Kentucky are reinforcing local sourcing preferences. Alongside these trends, wide-bandgap inverters operating at elevated switching speeds are compelling the use of specialty Class 1 MLCCs with tighter thermal coefficients.
Miniaturization of Smartphones and Wearables
Flagship phones now integrate over 1,000 ceramic capacitors, and rising antenna counts under 5G add further pressure on the supply chain. Murata’s 0.1 µF part in a 0.25 × 0.125 mm outline cuts the mounting area in half and reduces volume by 80% compared to the previous 0402 generation, allowing designers to reclaim precious board space for larger batteries and advanced camera modules. [1]Murata Manufacturing, “Installing Electronic Circuits of Dramatically Increasing Size into Compact Devices – Murata’s MLCC for 5G Smartphones,” murata.com Tight placement tolerances require ultra-thin dielectric layers-often below 0.5 µm-to remain crack-free during reflow. Finite-element modeling tools are enabling the co-design of MLCC stacks with RF front ends, thereby accelerating the time-to-market for handset makers.
5G / 6G Infrastructure Roll-out
U.S. carriers are densifying their macro and small-cell networks, each requiring banks of MLCCs optimized for coexistence with millimeter-wave and sub-6 GHz frequencies. Packaged antenna modules utilize embedded capacitors to maintain broadband impedance, while massive MIMO radio heads leverage low ESR decoupling to enhance PA efficiency. As the first 6G testbeds shift toward 140 GHz links, demand is rising for Class 1 NP0 dielectrics with near-zero loss tangents. Hardware compliance with FCC thermal-cycling rules is reinforcing the preference for U.S.-made high-reliability passives.
Explosion of IoT Nodes in U.S. Smart-Home Market
Smart thermostats, connected locks, and vision-enabled doorbells each embed multiple MLCC arrays to stabilize edge AI processors and wireless SoCs. The volume of Wi-Fi 6E and Thread devices installed across urban households is widening recurring demand for low-leakage, mid-capacitance ranges. Ultra-low-standby current requirements steer the BOM toward Class 2 X7R materials, which are balanced for high permittivity and acceptable temperature drift. Domestic EMS providers are qualifying second-source MLCC vendors to mitigate Asia-centric supply chain risks for consumer IoT brands.
Restraints Impact Analysis*
| Restraint | (~) % Impact on CAGR Forecast | Geographic Relevance | Impact Timeline |
|---|---|---|---|
| Supply-chain concentration outside the U.S. | -2.8% | National, with particular impact on defense and automotive sectors | Medium term (2-4 years) |
| Nickel- and copper-price volatility | -1.9% | Global, with North American manufacturers facing margin pressure | Short term (≤ 2 years) |
| Lengthy automotive qualification cycles | -1.5% | Global, with emphasis on North American automotive OEMs | Long term (≥ 4 years) |
| Tightened U.S. export-control regime | -1.2% | National, with spillover effects on allied markets | Medium term (2-4 years) |
| Source: Mordor Intelligence | |||
Supply-Chain Concentration Outside the U.S.
Roughly 90% of global MLCC volume originates from East Asia, exposing domestic buyers to geopolitical and logistics uncertainties. The United States currently accounts for less than 5% of the worldwide assembly and test capacity for ceramic passives. Although the CHIPS Act earmarks incentives for material suppliers, multilayer-stacking lines are capital-intensive and require a local supply of high-purity barium titanate powders. Defense contractors are therefore dual-sourcing critical values and building larger safety stocks, yet these steps add working-capital costs that weigh on the MLCC market expansion.
Nickel- and Copper-Price Volatility
Electrode production hinges on class-1 nickel and high-conductivity copper powders, both of which have experienced double-digit price swings over the past two years. Spot-price spikes quickly translate into contract renegotiations, putting margin pressure on mid-tier MLCC vendors that lack captive metal sources. While some ceramic suppliers are pivoting toward base-metal electrode chemistries that reduce nickel usage, technical trade-offs include higher sheet resistance and more complex sintering windows. In the longer term, nanometer-scale coating processes offer a route to minimize critical-metal intensity; however, commercial deployment remains several years away, according to. [2]TTI MarketEye (Dennis M. Zogbi), “Dielectric Raw Materials: Mapping the Complex Landscape of Electrical and Electronic Ores and Concentrates,” tti.com
*Our forecasts treat driver/restraint impacts as directional, not additive. The impact forecasts reflect baseline growth, mix effects, and variable interactions.
Segment Analysis
By Dielectric Type: Stability Drives Class 1 Leadership
Class 1 devices claimed 62.15% of the MLCC market share in 2025, thanks to their near-zero capacitance drift over temperature. Design wins in precision analog front ends and high-frequency RF chains keep demand firmly positive. The MLCC market size tied to Class 1 parts is set to grow at a 22.65% CAGR, markedly faster than higher-capacitance Class 2 alternatives. Premium pricing is sustainable because temperature-stable titanium-dioxide ceramics remain difficult to miniaturize without yield loss. Military and aerospace integrators—from missile guidance to low-earth-orbit satellites-favor Class 1 performance envelopes when thermal shocks exceed 150 °C swings.
Layer-count innovations now allow over 500 dielectric interfaces in sub-0402 footprints, narrowing the capacitance-density gap with barium-titanate-based Class 2 offerings. Rising 5G small-cell deployments also drive incremental Class 1 demand, thanks to their superior Q-factor at microwave frequencies. Over the forecast period, U.S. fab awards totaling USD 52.7 billion are expected to drive additional orders for AT-cut crystal oscillators and power amplifiers, each of which will embed dozens of Class 1 capacitors.


By Case Size: Miniaturization Elevates 402 Uptake
The 201 outline retained 55.92% of unit shipments in 2025, underscoring its role as the mainstream platform for volume handset production. Yet the 402 outline is poised for a 22.10% CAGR to 2031 as wearables and VR headsets shrink board area allowances. IT-hardware OEMs value 402 parts for their balance of automated pick-and-place compatibility and thermal headroom. Murata’s introduction of a 0.1 µF 0201 device validates continued physics-pushing but remains limited to premium phone SKUs.
Extremely thin ceramic layers, down to 0.4 µm, render larger outlines advantageous for yield and voltage derating in EV traction inverters. Medical battery chargers, on the other hand, are migrating toward 402 for implantable device controllers where volumetric efficiency is paramount. Over time, embedded-passive technologies in fan-out wafer-level packaging may bypass discrete outlines altogether; yet, discrete 402s will remain the cost-optimal choice for tens of billions of consumer electronics boards annually.
By Voltage Rating: Low-Voltage Dominance Continues
Low-voltage (≤100 V) MLCCs accounted for 58.77% of 2025 shipments and are projected to grow at a 21.95% CAGR. Smartphones, smartwatches, and laptops specify derated 6.3 V or 10 V values, absorbing huge run-rate volumes. The MLCC market size for low-voltage grades will therefore scale in step with global handset refresh cycles. In contrast, mid-voltage (100–500 V) parts experience concentrated demand from automotive 48 V subsystems and industrial motor drives, while high-voltage (>500 V) sales are driven by the penetration of 800 V EV platforms.
Tie-in growth factors include domestic solar-inverter plants in Texas and Arizona that specify 1,000 V MLCC banks for string inverters. Silicon-carbide reference designs published by chip vendors recommend Class 2 X7T dielectrics capable of 150 °C continuous operation, spawning a new premium tier for high-voltage capacitors. However, the relative scarcity of U.S. sublimation furnaces for SiC wafers constrains rapid scaling of localized MLCC demand in that niche.
By Mounting Style: Surface Mount Technology Prevails
Surface-mount parts accounted for a 41.55% share in 2025, driven by the adoption of full SMT flow across consumer and industrial electronics. Automated placement lines in Mexico and the U.S. Midwest run at 85,000 CPH, favoring tape-and-reel SMD inputs. The MLCC market is therefore anchored in packaging advances that reduce placement defects and voids. Metal-cap types, although niche, will lead the field with a 21.80% CAGR as harsh-environment designs require enhanced lead-free solder joint protection.
Radial-lead MLCCs retain pockets of demand inside military power supplies where conformal coating processes favor through-hole anchors. Looking forward, fan-out and panel-level packaging may embed MLCC arrays inside build-up layers, but discrete SMD footprints remain the dominant cost-advantaged option for at least the next five years.
By End-User Application: Automotive Leads the Upswing
Consumer electronics accounted for 50.88% of 2025 unit demand, driven by mobile upgrades and laptop refreshes. Nevertheless, the automotive sector is on track for the fastest 22.90% CAGR, propelled by EV battery-management systems, ADAS radar, and domain controller consolidation. Each new EV platform introduced by Detroit and Silicon Valley OEMs requires upwards of 10,000 MLCCs per vehicle. The widening adoption of 800V architectures further multiplies the need for high-voltage MLCC sockets.
Industrial automation, telecom infrastructure, and aerospace-defense form the remainder of the demand mix. Smart-factory retrofits result in sustained call-offs for mid-range capacitors used in servo drives and PLCs. Aerospace primes pursue radiation-hard Class 1 dielectrics qualified to MIL-PRF-123, allowing suppliers with military pedigrees to defend premium pricing. The convergence of electrification and connectivity across all verticals anchors a durable uplift in the overall MLCC market.
Geography Analysis
U.S. demand is heavily influenced by the USD 52.7 billion CHIPS Act, which underwrites the construction of new fabs for Intel, TSMC, Samsung, Micron, and Texas Instruments. These plants create clustered pull for MLCC shipments into Arizona, Texas, Ohio, and New York. Automotive OEM expansions in Michigan, Tennessee, and Kentucky further sink roots for regional capacitor distribution centers.
West-Coast cloud providers continue to commission new data centers in Oregon, Utah, and Northern Virginia, utilizing GPU racks that consume dense MLCC arrays for 48 V to 1.2 V conversion. Defense contracts from California and Massachusetts stipulate domestic or allied nation sourcing for passive components tied to missile guidance and secure communications. As a result, specialty MLCC lines in Illinois and Pennsylvania are running at record utilization.
Although less than 5% of ceramic-stacking capacity resides on U.S. soil today, several suppliers have publicly announced green-field projects in Indiana and North Carolina. The capital intensity, ranging from USD 750 million to USD 1.5 billion per advanced line, remains the primary hurdle; however, federal tax credits and state abatements are narrowing the ROI gap. Over the forecast horizon, the domestic share of global MLCC output could double, but the majority of volume will still arrive by sea or air from Japan, Taiwan, and South Korea.
Competitive Landscape
Innovation and Specialization Drive Future Success
Japanese incumbents-Murata, TDK, and Taiyo Yuden-retain their technology leadership through precision multilayer stacking, sub-micron dielectric control, and in-house material refinement. Murata’s JPY 46 billion Moriyama Innovation Center, slated for a 2026 opening, underscores its commitment to next-generation formulations. Yet price competition from rapidly scaling Chinese vendors has narrowed commodity margins, trimming Murata’s operating profit by 7.2% year-over-year in Q2 2025.
U.S. specialty houses focus on thin-film HTCC hybrids and radiation-hard designs, carving defensible niches in defense and space. Several are forming joint ventures with domestic wafer-fab operators to embed MLCC arrays at the package substrate level, bypassing board-mount stages entirely. Material cost hedging through captive nickel plating and barium carbonate calcination has become a competitive differentiator.
The entrance barrier remains high: capital costs, intellectual property depth, and multi-year automotive qualification cycles deter new entrants. Nevertheless, emerging process innovations, such as nano-grain sintering and additive manufacturing of ceramic inks, could open paths for agile players to disrupt niche segments over the next decade.
United States MLCC Industry Leaders
Murata Manufacturing Co., Ltd.
Samsung Electro-Mechanics Co., Ltd.
Kyocera AVX Components Corporation
TDK Corporation
Yageo Corporation (incl. KEMET Corp.)
- *Disclaimer: Major Players sorted in no particular order


Recent Industry Developments
- July 2025: Murata reported Q2 2025 consolidated operating profit of JPY 61.6 billion (USD 414.5 million), down 7.2% year-over-year, while maintaining strong MLCC shipment volumes in Taiwan despite price competition from Chinese manufacturers.
- July 2025: Murata’s MLCC shipments remain strong in Taiwan despite price wars with Chinese manufacturers.
- January 2025: CHIPS Program Office reported USD 34 billion in awards signed and USD 4 billion disbursed, representing 95% allocation of available funding across 17 new fabs and 8 supply-chain facilities.
- January 2025: Murata booked Q2 2025 operating profit of JPY 61.6 billion (USD 414.5 million), down 7.2% year-over-year amid commodity-segment price compression while maintaining high shipment volumes.


United States MLCC Market Report Scope
Class 1, Class 2 are covered as segments by Dielectric Type. 0 201, 0 402, 0 603, 1 005, 1 210, Others are covered as segments by Case Size. 500V to 1000V, Less than 500V, More than 1000V are covered as segments by Voltage. 100µF to 1000µF, Less than 100µF, More than 1000µF are covered as segments by Capacitance. Metal Cap, Radial Lead, Surface Mount are covered as segments by Mlcc Mounting Type. Aerospace and Defence, Automotive, Consumer Electronics, Industrial, Medical Devices, Power and Utilities, Telecommunication, Others are covered as segments by End User.| Class 1 |
| Class 2 |
| 201 |
| 402 |
| 603 |
| 1005 |
| 1210 |
| Other Case Sizes |
| Low Voltage (less than or equal to 100 V) |
| Mid Voltage (100 ? 500 V) |
| High Voltage (above 500 V) |
| Metal Cap |
| Radial Lead |
| Surface-Mount |
| Aerospace and Defense |
| Automotive |
| Consumer Electronics |
| Industrial |
| Medical Devices |
| Power and Utilities |
| Telecommunication |
| Other End-User Applications |
| By Dielectric Type | Class 1 |
| Class 2 | |
| By Case Size | 201 |
| 402 | |
| 603 | |
| 1005 | |
| 1210 | |
| Other Case Sizes | |
| By Voltage | Low Voltage (less than or equal to 100 V) |
| Mid Voltage (100 ? 500 V) | |
| High Voltage (above 500 V) | |
| By MLCC Mounting Type | Metal Cap |
| Radial Lead | |
| Surface-Mount | |
| By End-User Application | Aerospace and Defense |
| Automotive | |
| Consumer Electronics | |
| Industrial | |
| Medical Devices | |
| Power and Utilities | |
| Telecommunication | |
| Other End-User Applications |


Market Definition
- MLCC (Multilayer Ceramic Capacitor) - A type of capacitor that consists of multiple layers of ceramic material, alternating with conductive layers, used for energy storage and filtering in electronic circuits.
- Voltage - The maximum voltage that a capacitor can safely withstand without experiencing breakdown or failure. It is typically expressed in volts (V)
- Capacitance - The measure of a capacitor's ability to store electrical charge, expressed in farads (F). It determines the amount of energy that can be stored in the capacitor
- Case Size - The physical dimensions of an MLCC, typically expressed in codes or millimeters, indicating its length, width, and height
| Keyword | Definition |
|---|---|
| MLCC (Multilayer Ceramic Capacitor) | A type of capacitor that consists of multiple layers of ceramic material, alternating with conductive layers, used for energy storage and filtering in electronic circuits. |
| Capacitance | The measure of a capacitor's ability to store electrical charge, expressed in farads (F). It determines the amount of energy that can be stored in the capacitor |
| Voltage Rating | The maximum voltage that a capacitor can safely withstand without experiencing breakdown or failure. It is typically expressed in volts (V) |
| ESR (Equivalent Series Resistance) | The total resistance of a capacitor, including its internal resistance and parasitic resistances. It affects the capacitor's ability to filter high-frequency noise and maintain stability in a circuit. |
| Dielectric Material | The insulating material used between the conductive layers of a capacitor. In MLCCs, commonly used dielectric materials include ceramic materials like barium titanate and ferroelectric materials |
| SMT (Surface Mount Technology) | A method of electronic component assembly that involves mounting components directly onto the surface of a printed circuit board (PCB) instead of through-hole mounting. |
| Solderability | The ability of a component, such as an MLCC, to form a reliable and durable solder joint when subjected to soldering processes. Good solderability is crucial for proper assembly and functionality of MLCCs on PCBs. |
| RoHS (Restriction of Hazardous Substances) | A directive that restricts the use of certain hazardous materials, such as lead, mercury, and cadmium, in electrical and electronic equipment. Compliance with RoHS is essential for automotive MLCCs due to environmental regulations |
| Case Size | The physical dimensions of an MLCC, typically expressed in codes or millimeters, indicating its length, width, and height |
| Flex Cracking | A phenomenon where MLCCs can develop cracks or fractures due to mechanical stress caused by bending or flexing of the PCB. Flex cracking can lead to electrical failures and should be avoided during PCB assembly and handling. |
| Aging | MLCCs can experience changes in their electrical properties over time due to factors like temperature, humidity, and applied voltage. Aging refers to the gradual alteration of MLCC characteristics, which can impact the performance of electronic circuits. |
| ASPs (Average Selling Prices) | The average price at which MLCCs are sold in the market, expressed in USD million. It reflects the average price per unit |
| Voltage | The electrical potential difference across an MLCC, often categorized into low-range voltage, mid-range voltage, and high-range voltage, indicating different voltage levels |
| MLCC RoHS Compliance | Compliance with the Restriction of Hazardous Substances (RoHS) directive, which restricts the use of certain hazardous substances, such as lead, mercury, cadmium, and others, in the manufacturing of MLCCs, promoting environmental protection and safety |
| Mounting Type | The method used to attach MLCCs to a circuit board, such as surface mount, metal cap, and radial lead, which indicates the different mounting configurations |
| Dielectric Type | The type of dielectric material used in MLCCs, often categorized into Class 1 and Class 2, representing different dielectric characteristics and performance |
| Low-Range Voltage | MLCCs designed for applications that require lower voltage levels, typically in the low voltage range |
| Mid-Range Voltage | MLCCs designed for applications that require moderate voltage levels, typically in the middle range of voltage requirements |
| High-Range Voltage | MLCCs designed for applications that require higher voltage levels, typically in the high voltage range |
| Low-Range Capacitance | MLCCs with lower capacitance values, suitable for applications that require smaller energy storage |
| Mid-Range Capacitance | MLCCs with moderate capacitance values, suitable for applications that require intermediate energy storage |
| High-Range Capacitance | MLCCs with higher capacitance values, suitable for applications that require larger energy storage |
| Surface Mount | MLCCs designed for direct surface mounting onto a printed circuit board (PCB), allowing for efficient space utilization and automated assembly |
| Class 1 Dielectric | MLCCs with Class 1 dielectric material, characterized by a high level of stability, low dissipation factor, and low capacitance change over temperature. They are suitable for applications requiring precise capacitance values and stability |
| Class 2 Dielectric | MLCCs with Class 2 dielectric material, characterized by a high capacitance value, high volumetric efficiency, and moderate stability. They are suitable for applications that require higher capacitance values and are less sensitive to capacitance changes over temperature |
| RF (Radio Frequency) | It refers to the range of electromagnetic frequencies used in wireless communication and other applications, typically from 3 kHz to 300 GHz, enabling the transmission and reception of radio signals for various wireless devices and systems. |
| Metal Cap | A protective metal cover used in certain MLCCs (Multilayer Ceramic Capacitors) to enhance durability and shield against external factors like moisture and mechanical stress |
| Radial Lead | A terminal configuration in specific MLCCs where electrical leads extend radially from the ceramic body, facilitating easy insertion and soldering in through-hole mounting applications. |
| Temperature Stability | The ability of MLCCs to maintain their capacitance values and performance characteristics across a range of temperatures, ensuring reliable operation in varying environmental conditions. |
| Low ESR (Equivalent Series Resistance) | MLCCs with low ESR values have minimal resistance to the flow of AC signals, allowing for efficient energy transfer and reduced power losses in high-frequency applications. |


Research Methodology
Mordor Intelligence has followed the following methodology in all our MLCC reports.
- Step 1: Identify Data Points: In this step, we identified key data points crucial for comprehending the MLCC market. This included historical and current production figures, as well as critical device metrics such as attachment rate, sales, production volume, and average selling price. Additionally, we estimated future production volumes and attachment rates for MLCCs in each device category. Lead times were also determined, aiding in forecasting market dynamics by understanding the time required for production and delivery, thereby enhancing the accuracy of our projections.
- Step 2: Identify Key Variables: In this step, we focused on identifying crucial variables essential for constructing a robust forecasting model for the MLCC market. These variables include lead times, trends in raw material prices used in MLCC manufacturing, automotive sales data, consumer electronics sales figures, and electric vehicle (EV) sales statistics. Through an iterative process, we determined the necessary variables for accurate market forecasting and proceeded to develop the forecasting model based on these identified variables.
- Step 3: Build a Market Model: In this step, we utilized production data and key industry trend variables, such as average pricing, attachment rate, and forecasted production data, to construct a comprehensive market estimation model. By integrating these critical variables, we developed a robust framework for accurately forecasting market trends and dynamics, thereby facilitating informed decision-making within the MLCC market landscape.
- Step 4: Validate and Finalize: In this crucial step, all market numbers and variables derived through an internal mathematical model were validated through an extensive network of primary research experts from all the markets studied. The respondents are selected across levels and functions to generate a holistic picture of the market studied.
- Step 5: Research Outputs: Syndicated Reports, Custom Consulting Assignments, Databases, and Subscription Platform


