Smartphone MLCC Market Size and Share
Market Overview
| Study Period | 2020 - 2031 |
|---|---|
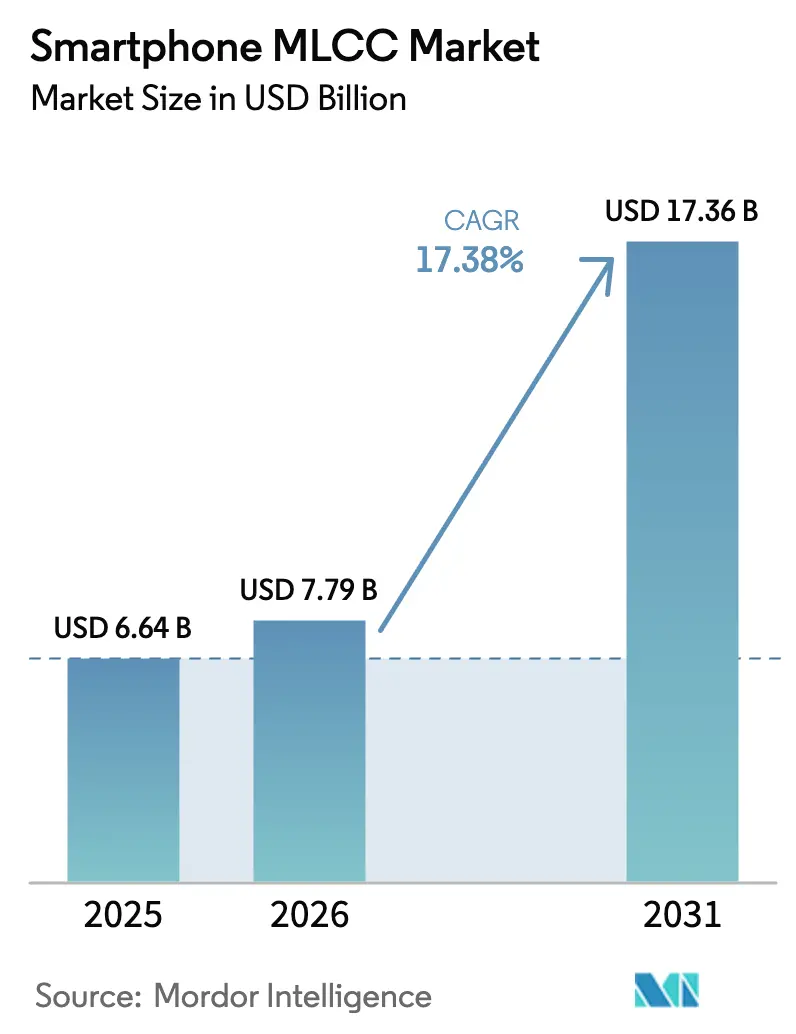
| Market Size (2026) | USD 7.79 Billion |
| Market Size (2031) | USD 17.36 Billion |
| Growth Rate (2026 - 2031) | 17.38% CAGR |
| Fastest Growing Market | Asia Pacific |
| Largest Market | North America |
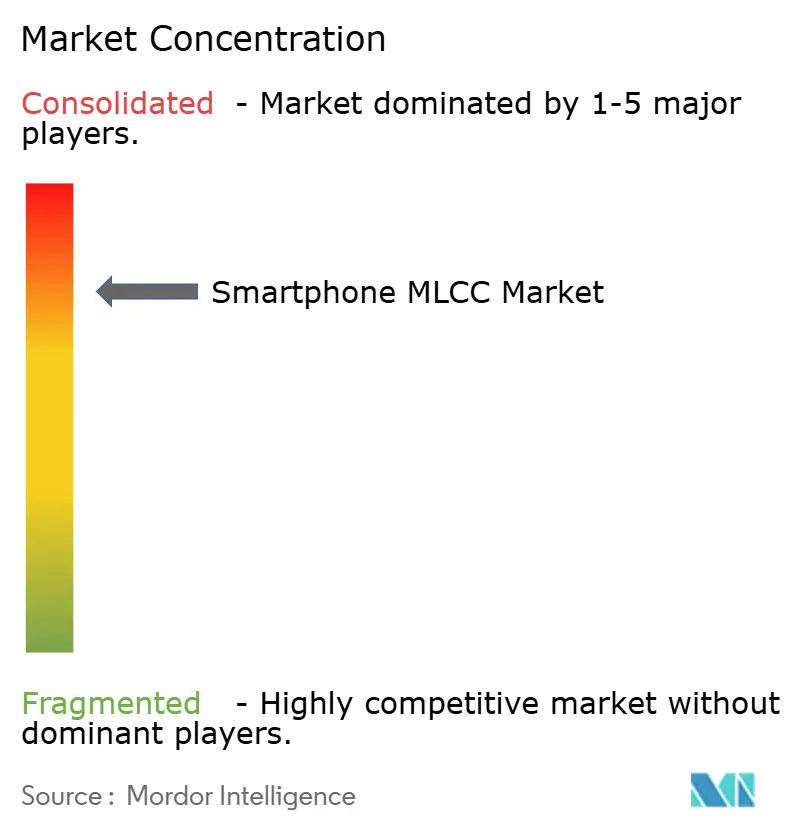
| Market Concentration | High |
Major Players*Disclaimer: Major Players sorted in no particular order Image © Mordor Intelligence. Reuse requires attribution under CC BY 4.0. | |
Smartphone MLCC Market Analysis by Mordor Intelligence
smartphone MLCC market size in 2026 is estimated at USD 7.79 billion, growing from 2025 value of USD 6.64 billion with 2031 projections showing USD 17.36 billion, growing at 17.38% CAGR over 2026-2031. Momentum stems from the growing layer count in 5G-Advanced handsets, the shift toward on-device AI acceleration, and sustained premium-tier smartphone demand in North America. Larger capacitor banks per handset improve transient response for fast-switching processors, while higher voltage ratings support ultra-fast charging architectures. Suppliers with proprietary ceramic powder processing retain pricing power, even as regional supply-chain incentives entice new entrants. Market leaders deepen vertical integration to stabilize raw-material availability and reduce logistics risk.
Key Report Takeaways
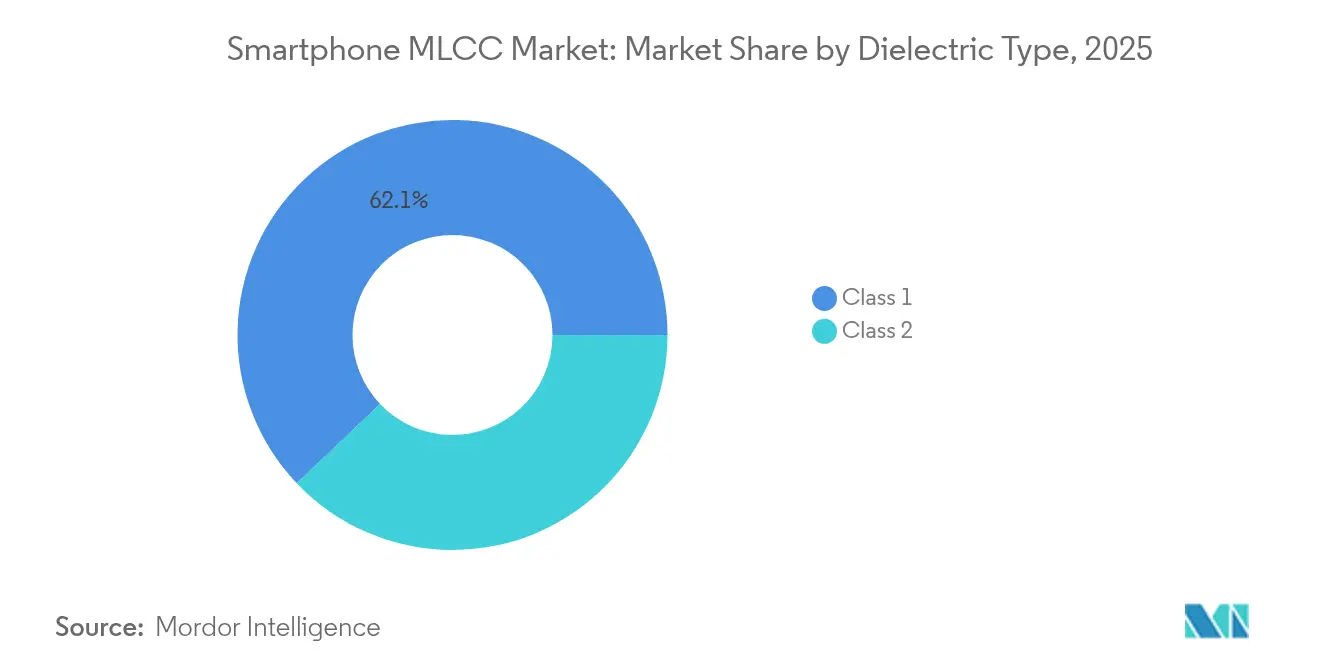
- By dielectric type, Class 1 capacitors held 62.10% of the smartphone MLCC market share in 2025, and the segment is projected to grow at a 18.88% CAGR through 2031.
- By case size, the 201 package accounted for 55.72% of the smartphone MLCC market size in 2025, whereas the 402 package records the highest projected CAGR at 18.76% to 2031.
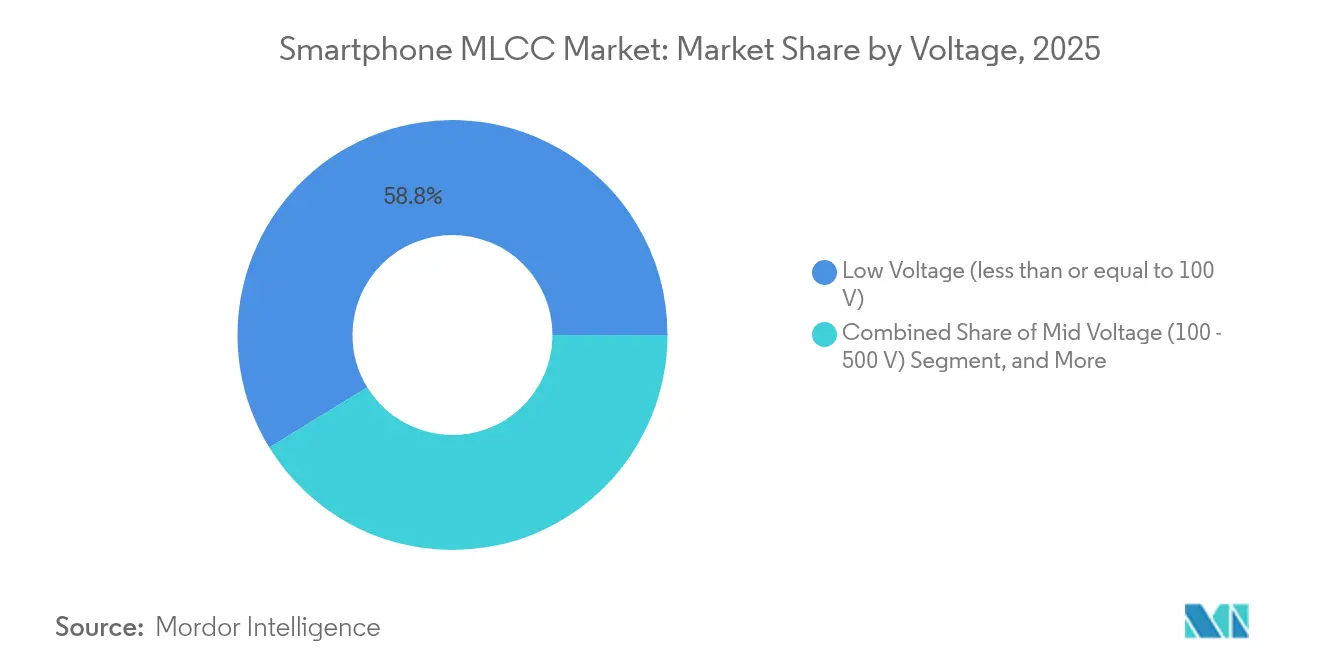
- By voltage rating, less than or equal to 100 V parts represented 58.77% of 2025 revenue in the smartphone MLCC market and are poised for an 18.54% CAGR over the forecast period.
- By mounting type, surface-mount devices captured 41.05% share in 2025 in the smartphone MLCC market, while metal-cap variants are set to rise at an 18.21% CAGR through 2031.
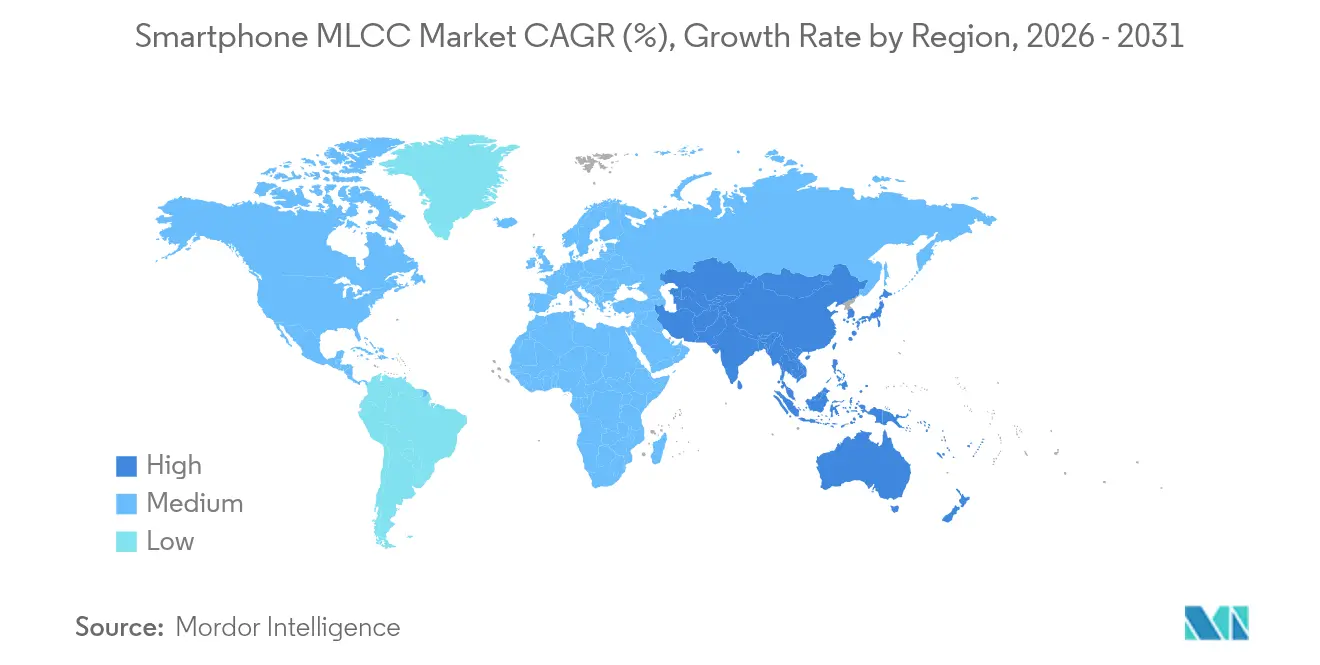
- By geography, North America generated 56.98% of the 2025 revenue in the smartphone MLCC market; the Asia-Pacific region is projected to deliver the fastest regional CAGR of 19.12%, thanks to localized handset production.
Note: Market size and forecast figures in this report are generated using Mordor Intelligence’s proprietary estimation framework, updated with the latest available data and insights as of 2026.
Global Smartphone MLCC Market Trends and Insights
Drivers Impact Analysis*
| Driver | (~) % Impact on CAGR Forecast | Geographic Relevance | Impact Timeline |
|---|---|---|---|
| Rising 5G-smartphone penetration drives high-capacitance demand | +3.2% | Global, with Asia-Pacific core leading adoption | Medium term (2-4 years) |
| Growing MLCC count per handset due to RF complexity | +2.8% | North America and EU premium segments, spill-over to Asia-Pacific | Short term (≤ 2 years) |
| Miniaturisation requires small-case, high-value MLCCs | +2.1% | Global, concentrated in advanced manufacturing hubs | Long term (≥ 4 years) |
| Integration of on-device AI accelerators boosts power-rail capacitance | +3.4% | North America and China, expanding to global markets | Medium term (2-4 years) |
| Fast-charging (above 100 W) designs need higher-voltage MLCCs | +1.9% | Asia-Pacific core, with early gains in China, South Korea | Short term (≤ 2 years) |
| Regional supply-chain localisation incentives in US/EU/India | +2.3% | US/EU/India with secondary effects in allied markets | Long term (≥ 4 years) |
| Source: Mordor Intelligence | |||


Rising 5G-Smartphone Penetration Drives High-Capacitance Demand
5G-Advanced handsets integrate multiple carrier-aggregation paths, each demanding its own bypass and bulk capacitance bank. Leading devices now deploy up to 1,000 MLCCs, tripling the count found in early 4G models. The architectural shift also raises per-handset capacitor value as high-efficiency power amplifiers require tighter voltage regulation. In North America and South Korea, premium models allocate 15–20% of passive-component cost solely to 5G-specific MLCC content. Supply-chain visibility shows that every additional 1 ppt increase in 5G penetration can lift overall MLCC unit demand by nearly 0.8 ppt. Capacitor suppliers consequently prioritize C0G/NP0 grades for RF sections where phase noise control is critical.[1]Samsung Electro-Mechanics, “25V MLCC Solution for Memory Voltage Regulators with DDR5 Adoption,” samsungsem.com
Integration of On-Device AI Accelerators Boosts Power-Rail Capacitance
Large-language-model inference engines inside flagship smartphones draw burst currents exceeding 10 A in sub-microsecond windows. Designers respond by clustering low-ESR MLCC banks close to neural-processing units. Samsung Electro-Mechanics’ 22 µF, 25 V part in an 0805 package exemplifies the move toward higher volumetric efficiency at elevated voltages.[2]Samsung Electro-Mechanics, “25V MLCC Solution for Memory Voltage Regulators with DDR5 Adoption,” samsungsem.com Dynamic voltage scaling between idle and peak states intensifies capacitance density needs, prompting adoption of Class 2 dielectrics that exceed 100 µF in sub-1 mm² footprints. As AI features migrate from flagship to mid-tier phones by 2027, demand for high-value MLCC arrays will widen across price bands.
Growing MLCC Count Per Handset Due to RF Complexity
Software-defined radio architectures isolate each frequency band with individual filters, amplifiers, and decoupling networks. Premium smartphones now support 40-plus LTE and 5G bands, multiplying the number of required capacitors. Multi-antenna MIMO further duplicates these paths, increasing granular power-domain isolation. Compliance with FCC Part 15 and ETSI EN 301 489 continues to drive the use of EMI-suppression capacitors across RF and digital interfaces.[3]TDK Corporation, “TDK offers MLCCs with the industry’s highest capacitance at 100 V,” tdk.com Class 1 MLCCs retain a cost premium because their capacitance drift stays below ±30 ppm/°C, safeguarding oscillator stability under extreme use-case temperature swings.
Fast-Charging Above 100 W Designs Need Higher-Voltage MLCCs
Ultra-fast charging surpasses 100 W by operating intermediate stages around 20 V, exceeding the limits of conventional smartphone capacitors. TDK’s 100 V-rated, 10 µF MLCC in a 3225 package bridges the gap between low-voltage on-board regulation and high-voltage charger interfaces. Thermal hotspots during rapid charge cycles can trim effective capacitance by 15–20%, so suppliers qualify parts to withstand 125 °C board temperatures. The shift to gallium-nitride power ICs elevates switching frequencies above 1 MHz, which in turn heightens the necessity for MLCCs with low inductance and stable high-frequency impedance.
Restraints Impact Analysis*
| Restraint | (~) % Impact on CAGR Forecast | Geographic Relevance | Impact Timeline |
|---|---|---|---|
| Cyclical downturns in global smartphone shipments | -2.1% | Global, with pronounced effects in mature markets | Short term (≤ 2 years) |
| Price-erosion and commoditisation squeeze supplier margins | -1.8% | Global, concentrated in mid-tier smartphone segments | Medium term (2-4 years) |
| Limited availability of ultra-pure BaTiO3 ceramic powder | -1.4% | Global, with supply concentrated in Japan and China | Medium term (2-4 years) |
| Decarbonisation CAPEX for kiln operations under ESG pressure | -0.9% | Asia-Pacific core manufacturing hubs, expanding to global facilities | Long term (≥ 4 years) |
| Source: Mordor Intelligence | |||
Cyclical Downturns in Global Smartphone Shipments
Total smartphone deliveries reached a signficiant growth, but full-year forecasts trimmed expected growth to 2.7% amid inflation concerns and tariff uncertainty. An extended replacement cycle of three to four years in the United States and Western Europe dampens baseline MLCC demand. Inventory swings amplify the effect because component orders typically fluctuate three to five times the magnitude of finished-goods changes. Supply concentration among a handful of handset OEMs exacerbates volatility, with single customer design decisions capable of removing several hundred million MLCCs from quarterly demand projections.
Price-Erosion and Commoditization Squeeze Supplier Margins
Chinese entrants undercut established vendors in commodity grades, driving 35–45% price declines during oversupply phases. Historical recovery periods stretch up to two years before utilization normalizes, limiting capital-expenditure appetite for next-generation process nodes. OEM purchasing teams prioritize bill-of-materials savings, eroding supplier bargaining power in mid-range capacitance and voltage categories. Long-tail cost pressure may slow the rollout of capacity for premium dielectric formulations unless offset by automotive or industrial demand.
*Our forecasts treat driver/restraint impacts as directional, not additive. The impact forecasts reflect baseline growth, mix effects, and variable interactions.
Segment Analysis
By Dielectric Type: Class 1 Dominance Reflects Precision Requirements
Class 1 parts commanded 62.10% of 2025 revenue, a share underpinned by stringent temperature-stability targets in RF front-ends and clock networks. This category is also the fastest-growing, with a 18.88% CAGR forecast through 2031. The smartphone MLCC market size for Class 1 grades is projected to nearly double over the forecast horizon as 5G carrier aggregation and on-device AI workloads elevate timing-accuracy needs. Manufacturers exploit C0G/NP0 formulations to keep drift below ±30 ppm/°C, thereby preserving phase-locked-loop integrity at gigahertz frequencies. Production complexity, including ultra-thin dielectric layering, sustains premium pricing and insulates this segment from commodity competition.
Meanwhile, Class 2 MLCCs fill high-capacitance roles where volumetric efficiency eclipses thermal stability. Murata’s 006003-inch breakthrough underscores the ultimate miniaturization frontier, but mass-market adoption will hinge on further assembly yield gains. Cost-sensitive models still accept X5R and X7R grades for general decoupling, ensuring a balanced portfolio mix.


By Case Size: 201 Leadership Balances Miniaturization With Assembly Yield
The 201 package delivered 55.72% of 2025 shipments, confirming its sweet spot between PCB footprint savings and solder-joint reliability. The smartphone MLCC market share for 201 devices is expected to narrow gradually as 402 packages accelerate at a 18.76% CAGR. Assemblers report that defect rates climb steeply for 01005 parts, diluting any theoretical area advantage at high volumes. Conversely, 402 packages provide additional dielectric volume, enabling higher capacitance without untenable line-yield penalties.
OEM adoption cycles also factor in SMT equipment capabilities; not all lines can reliably place ultra-small passives at 50-million-unit yearly output. Consequently, 201 and 402 are likely to coexist as mainstream options, with ultra-mini parts reserved for camera modules and RF filters where space is at an absolute premium.
By Voltage Rating: Low-Voltage Dominance Reflects Power Architecture Trends
MLCCs rated at 100 V or less accounted for 58.77% of 2025 revenue, as most smartphone rails operate at or below 5 V. This low-voltage cohort is expected to sustain an 18.54% CAGR, driven by deeper sub-1 V core voltages in 3 nm processors and distributed point-of-load regulation schemes. The smartphone MLCC market size for categories with voltages of less than or equal to 100 V will therefore outpace that of mid- and high-voltage counterparts.
Mid-voltage capacitors (100–500 V) are used in wireless-charging transmitters and camera-flash boost circuits. TDK’s 100 V 10 µF innovation shows that volumetric efficiency is closing in on low-voltage parts, encouraging designers to maintain safety margins without enlarging footprints. High-voltage (above 500 V) segments remain niche, serving piezo-electric haptics and specialty display drivers where part count is minimal.
By Mounting Type: Surface-Mount Leads Despite Metal-Cap Growth
Surface-mount MLCCs captured 41.05% of 2025 revenue and remain the workhorse for handset PCB assembly. Metal-cap variants, however, will post an 18.21% CAGR as power-delivery networks push current limits beyond conventional solder-pad capabilities. Metal-capped MLCCs feature robust terminations that dissipate heat more effectively in 15 W wireless-charging receivers and 120 W fast-charging regulators.
Radial-lead solutions are limited to legacy designs and ruggedized accessories because through-hole components consume valuable board area. Long term, industry roadmaps point to hybrid packaging that marries metal-cap robustness with SMT automation to satisfy both electrical and cost objectives.
Geography Analysis
North America generated 56.98% of 2025 smartphone MLCC market revenue, buoyed by Apple’s sustained premium-tier volumes and stringent part-qualification protocols. Average selling prices for U.S.-bound handsets sit 45% above the global mean, expanding bill-of-materials allocations for high-value passives. CHIPS Act funding has yet to add meaningful ceramic-capacitor capacity, but announced projects underscore a trend toward regional redundancy.
Asia-Pacific is poised for a 19.12% CAGR through 2031, underpinned by concentrated handset assembly in China, Vietnam, and India. Beijing’s 15% device subsidy for sub-RMB 6,000 smartphones spurred a 17% unit surge in early 2025, translating into corresponding jumps in MLCC shipments. Proximity to barium-titanate powder suppliers streamlines raw-material logistics, lowering working-capital needs for regional manufacturers. Furthermore, distributors are shifting warehouses to Thailand and Malaysia to bypass tariff uncertainty, trimming component lead times by up to two weeks.
Europe maintains steady demand through luxury-brand handset uptake and spill-over from automotive MLCC demand, which imposes stricter AEC-Q200 reliability standards. Environmental regulations such as REACH and RoHS drive early adoption of lead-free terminations, creating a compliance-driven differentiation lever for established Japanese and Korean suppliers. Latin America, the Middle East, and Africa collectively trail but represent greenfield opportunities as 5G rollouts gather pace, provided price points align with mid-range consumer budgets.

Competitive Landscape
The top six vendors command nearly 70% of global revenue, reflecting high capital intensity and proprietary material science. Murata alone controls about 30%, leveraging vertically integrated powder synthesis and advanced thin-layer deposition technologies. Samsung Electro-Mechanics, TDK, Taiyo Yuden, Yageo, and Kyocera AVX round out the leading cohort. Strategic investments target automotive and industrial MLCCs, yet smartphone allocations remain critical for scale economies.
M&A activity also illustrates portfolio diversification. Yageo’s planned USD 759.4 million purchase of Shibaura Electronics extends its sensor footprint, broadening cross-selling opportunities. Samsung Electro-Mechanics meanwhile secured multi-million-USD contracts to supply BYD with automotive-grade MLCCs, providing a hedge against handset cyclicality. Japanese manufacturers benefit from government-backed financing that accelerates cutting-edge kiln upgrades and know-how protection.
Chinese challengers such as Viiyong compete aggressively on price in commodity segments, especially for 0603 and 0805 X5R parts. However, premium handset OEMs still raise quality concerns around dielectric consistency and long-term reliability. As a result, incumbents retain bargaining power in high-capacitance and high-voltage grades where defect tolerances are razor thin.
Smartphone MLCC Industry Leaders
Kyocera AVX Components Corporation (Kyocera Corporation)
Taiyo Yuden Co., Ltd
Yageo Corporation
Samsung Electro-Mechanics Co., Ltd.
Murata Manufacturing Co., Ltd.
- *Disclaimer: Major Players sorted in no particular order

Recent Industry Developments
- May 2025: Yageo raised its tender offer for Shibaura Electronics to JPY 6,200 per share, surpassing MinebeaMitsumi’s bid.
- April 2025: Samsung Electro-Mechanics expanded automotive MLCC supply contracts with BYD, unlocking multi-million-USD revenue.
- January 2025: Yageo Corporation secured regulatory approval for its USD 759.4 million acquisition of Shibaura Electronics, expanding its sensor product line.
- August 2024: Murata announced a USD 78.2 million expansion in the Philippines to meet handset and EV demand.


Global Smartphone MLCC Market Report Scope
4G Smartphones, 5G Smartphones, Others are covered as segments by Technology. Android, iOS are covered as segments by Operating System. 0 201, 0 402, 0 603, 0 805, 1 210, Others are covered as segments by Case Size. 10V to 20V, Above 20V, Less than 10V are covered as segments by Voltage. 10 μF to 100 μF, Less than 10 μF, More than 100 μF are covered as segments by Capacitance. Class 1, Class 2 are covered as segments by Dielectric Type. Budget smartphones (Less than USD 300), Mid-range smartphones (USD 300 - USD 700), Premium smartphones (More than USD 700) are covered as segments by Price Range. Asia-Pacific, Europe, North America are covered as segments by Region.| Class 1 |
| Class 2 |
| 201 |
| 402 |
| 603 |
| 1005 |
| 1210 |
| Other Case Sizes |
| Low Voltage (less than or equal to 100 V) |
| Mid Voltage (100 – 500 V) |
| High Voltage (above 500 V) |
| Metal-Cap |
| Radial-Lead |
| Surface-Mount |
| North America | United States |
| Rest of North America | |
| Europe | Germany |
| United Kingdom | |
| Rest of Europe | |
| Asia-Pacific | China |
| Japan | |
| South Korea | |
| India | |
| Rest of Asia-Pacific | |
| Rest of the World |
| By Dielectric Type | Class 1 | |
| Class 2 | ||
| By Case Size | 201 | |
| 402 | ||
| 603 | ||
| 1005 | ||
| 1210 | ||
| Other Case Sizes | ||
| By Voltage | Low Voltage (less than or equal to 100 V) | |
| Mid Voltage (100 – 500 V) | ||
| High Voltage (above 500 V) | ||
| By MLCC Mounting Type | Metal-Cap | |
| Radial-Lead | ||
| Surface-Mount | ||
| By Geography | North America | United States |
| Rest of North America | ||
| Europe | Germany | |
| United Kingdom | ||
| Rest of Europe | ||
| Asia-Pacific | China | |
| Japan | ||
| South Korea | ||
| India | ||
| Rest of Asia-Pacific | ||
| Rest of the World | ||


Market Definition
- MLCC (Multilayer Ceramic Capacitor) - A type of capacitor that consists of multiple layers of ceramic material, alternating with conductive layers, used for energy storage and filtering in electronic circuits.
- Voltage - The maximum voltage that a capacitor can safely withstand without experiencing breakdown or failure. It is typically expressed in volts (V)
- Capacitance - The measure of a capacitor's ability to store electrical charge, expressed in farads (F). It determines the amount of energy that can be stored in the capacitor
- Case Size - The physical dimensions of an MLCC, typically expressed in codes or millimeters, indicating its length, width, and height
| Keyword | Definition |
|---|---|
| MLCC (Multilayer Ceramic Capacitor) | A type of capacitor that consists of multiple layers of ceramic material, alternating with conductive layers, used for energy storage and filtering in electronic circuits. |
| Capacitance | The measure of a capacitor's ability to store electrical charge, expressed in farads (F). It determines the amount of energy that can be stored in the capacitor |
| Voltage Rating | The maximum voltage that a capacitor can safely withstand without experiencing breakdown or failure. It is typically expressed in volts (V) |
| ESR (Equivalent Series Resistance) | The total resistance of a capacitor, including its internal resistance and parasitic resistances. It affects the capacitor's ability to filter high-frequency noise and maintain stability in a circuit. |
| Dielectric Material | The insulating material used between the conductive layers of a capacitor. In MLCCs, commonly used dielectric materials include ceramic materials like barium titanate and ferroelectric materials |
| SMT (Surface Mount Technology) | A method of electronic component assembly that involves mounting components directly onto the surface of a printed circuit board (PCB) instead of through-hole mounting. |
| Solderability | The ability of a component, such as an MLCC, to form a reliable and durable solder joint when subjected to soldering processes. Good solderability is crucial for proper assembly and functionality of MLCCs on PCBs. |
| RoHS (Restriction of Hazardous Substances) | A directive that restricts the use of certain hazardous materials, such as lead, mercury, and cadmium, in electrical and electronic equipment. Compliance with RoHS is essential for automotive MLCCs due to environmental regulations |
| Case Size | The physical dimensions of an MLCC, typically expressed in codes or millimeters, indicating its length, width, and height |
| Flex Cracking | A phenomenon where MLCCs can develop cracks or fractures due to mechanical stress caused by bending or flexing of the PCB. Flex cracking can lead to electrical failures and should be avoided during PCB assembly and handling. |
| Aging | MLCCs can experience changes in their electrical properties over time due to factors like temperature, humidity, and applied voltage. Aging refers to the gradual alteration of MLCC characteristics, which can impact the performance of electronic circuits. |
| ASPs (Average Selling Prices) | The average price at which MLCCs are sold in the market, expressed in USD million. It reflects the average price per unit |
| Voltage | The electrical potential difference across an MLCC, often categorized into low-range voltage, mid-range voltage, and high-range voltage, indicating different voltage levels |
| MLCC RoHS Compliance | Compliance with the Restriction of Hazardous Substances (RoHS) directive, which restricts the use of certain hazardous substances, such as lead, mercury, cadmium, and others, in the manufacturing of MLCCs, promoting environmental protection and safety |
| Mounting Type | The method used to attach MLCCs to a circuit board, such as surface mount, metal cap, and radial lead, which indicates the different mounting configurations |
| Dielectric Type | The type of dielectric material used in MLCCs, often categorized into Class 1 and Class 2, representing different dielectric characteristics and performance |
| Low-Range Voltage | MLCCs designed for applications that require lower voltage levels, typically in the low voltage range |
| Mid-Range Voltage | MLCCs designed for applications that require moderate voltage levels, typically in the middle range of voltage requirements |
| High-Range Voltage | MLCCs designed for applications that require higher voltage levels, typically in the high voltage range |
| Low-Range Capacitance | MLCCs with lower capacitance values, suitable for applications that require smaller energy storage |
| Mid-Range Capacitance | MLCCs with moderate capacitance values, suitable for applications that require intermediate energy storage |
| High-Range Capacitance | MLCCs with higher capacitance values, suitable for applications that require larger energy storage |
| Surface Mount | MLCCs designed for direct surface mounting onto a printed circuit board (PCB), allowing for efficient space utilization and automated assembly |
| Class 1 Dielectric | MLCCs with Class 1 dielectric material, characterized by a high level of stability, low dissipation factor, and low capacitance change over temperature. They are suitable for applications requiring precise capacitance values and stability |
| Class 2 Dielectric | MLCCs with Class 2 dielectric material, characterized by a high capacitance value, high volumetric efficiency, and moderate stability. They are suitable for applications that require higher capacitance values and are less sensitive to capacitance changes over temperature |
| RF (Radio Frequency) | It refers to the range of electromagnetic frequencies used in wireless communication and other applications, typically from 3 kHz to 300 GHz, enabling the transmission and reception of radio signals for various wireless devices and systems. |
| Metal Cap | A protective metal cover used in certain MLCCs (Multilayer Ceramic Capacitors) to enhance durability and shield against external factors like moisture and mechanical stress |
| Radial Lead | A terminal configuration in specific MLCCs where electrical leads extend radially from the ceramic body, facilitating easy insertion and soldering in through-hole mounting applications. |
| Temperature Stability | The ability of MLCCs to maintain their capacitance values and performance characteristics across a range of temperatures, ensuring reliable operation in varying environmental conditions. |
| Low ESR (Equivalent Series Resistance) | MLCCs with low ESR values have minimal resistance to the flow of AC signals, allowing for efficient energy transfer and reduced power losses in high-frequency applications. |


Research Methodology
Mordor Intelligence has followed the following methodology in all our MLCC reports.
- Step 1: Identify Data Points: In this step, we identified key data points crucial for comprehending the MLCC market. This included historical and current production figures, as well as critical device metrics such as attachment rate, sales, production volume, and average selling price. Additionally, we estimated future production volumes and attachment rates for MLCCs in each device category. Lead times were also determined, aiding in forecasting market dynamics by understanding the time required for production and delivery, thereby enhancing the accuracy of our projections.
- Step 2: Identify Key Variables: In this step, we focused on identifying crucial variables essential for constructing a robust forecasting model for the MLCC market. These variables include lead times, trends in raw material prices used in MLCC manufacturing, automotive sales data, consumer electronics sales figures, and electric vehicle (EV) sales statistics. Through an iterative process, we determined the necessary variables for accurate market forecasting and proceeded to develop the forecasting model based on these identified variables.
- Step 3: Build a Market Model: In this step, we utilized production data and key industry trend variables, such as average pricing, attachment rate, and forecasted production data, to construct a comprehensive market estimation model. By integrating these critical variables, we developed a robust framework for accurately forecasting market trends and dynamics, thereby facilitating informed decision-making within the MLCC market landscape.
- Step 4: Validate and Finalize: In this crucial step, all market numbers and variables derived through an internal mathematical model were validated through an extensive network of primary research experts from all the markets studied. The respondents are selected across levels and functions to generate a holistic picture of the market studied.
- Step 5: Research Outputs: Syndicated Reports, Custom Consulting Assignments, Databases, and Subscription Platform


