Europe MLCC Market Size and Share
Market Overview
| Study Period | 2020 - 2031 |
|---|---|
| Forecast Data Period | 2026 - 2031 |
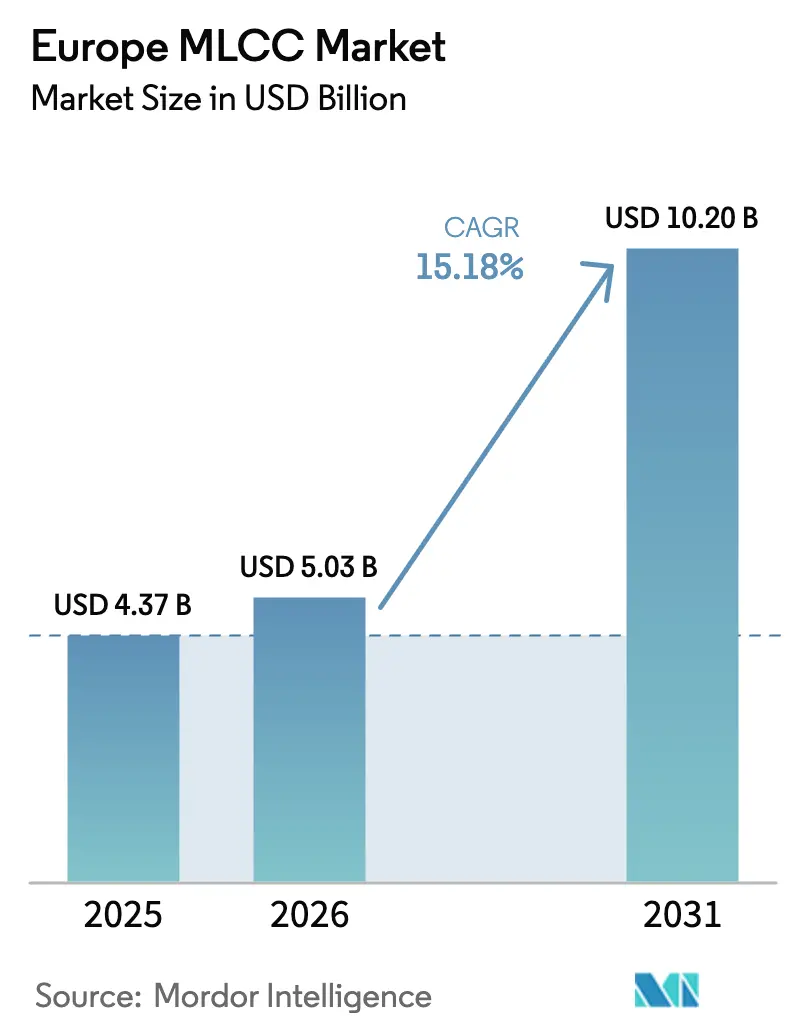
| Base Year Market Size (2025) | USD 4.37 Billion |
| Market Size (2026) | USD 5.03 Billion |
| Market Size (2031) | USD 10.2 Billion |
| Growth Rate (2026 - 2031) | 15.18% CAGR |
| Market Concentration | Medium |
Major Players *Disclaimer: Major Players sorted in no particular order Image © Mordor Intelligence. Reuse requires attribution under CC BY 4.0. | |
Europe MLCC Market Analysis by Mordor Intelligence
Europe MLCC market size in 2026 is estimated at USD 5.03 billion, growing from 2025 value of USD 4.37 billion with 2031 projections showing USD 10.2 billion, growing at 15.18% CAGR over 2026-2031. Heightened geopolitical frictions, renewed attention to electronics sovereignty, and stringent local-content rules continue to drive the Europe MLCC market's expansion, as OEMs shift sourcing closer to end-assembly plants to mitigate freight risks and reduce environmental compliance costs. The electrification of drivetrains, accelerated 5G rollouts, and miniaturization of medical implants collectively increase design-in volumes while pushing specifications toward tighter tolerances, wider temperature ranges, and higher capacitance density. Germany’s industrial core and electric-vehicle production build-out, the EU Carbon Border Adjustment Mechanism (CBAM), and a growing slate of regional battery gigafactories also recalibrate bargaining power in favor of component suppliers that provide full traceability, REACH documentation, and verified low-carbon footprints.
Key Report Takeaways
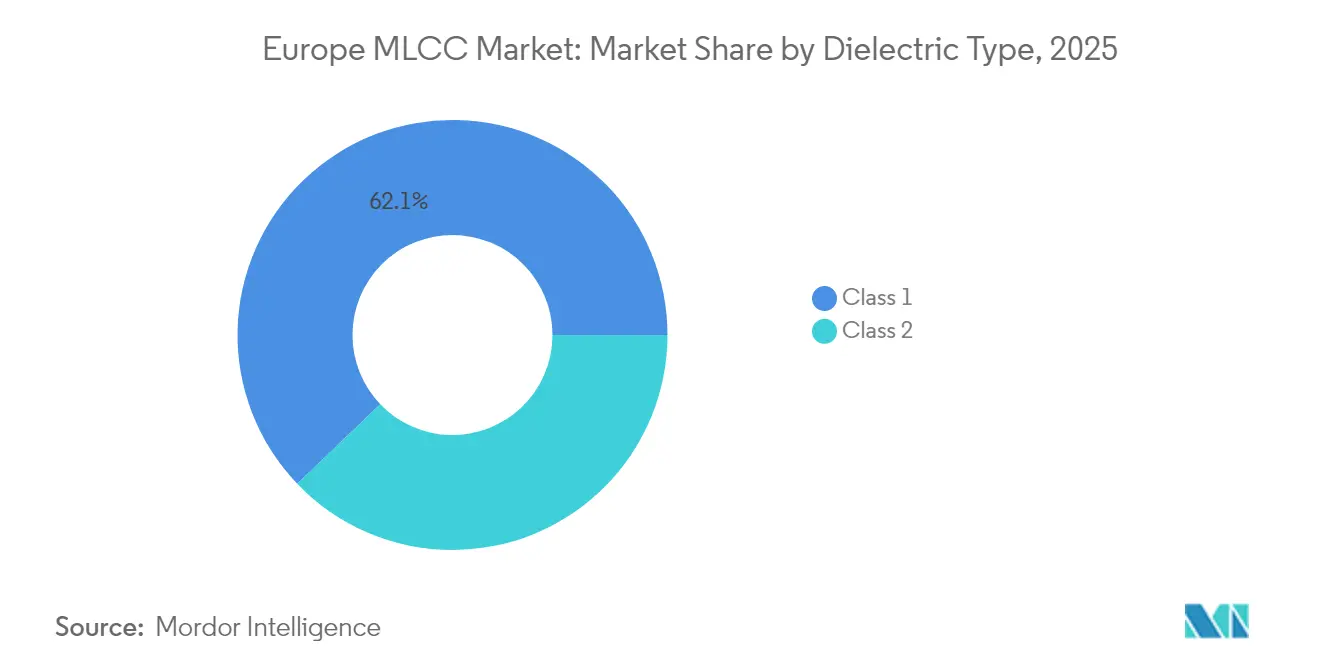
- By dielectric type, Class 1 devices captured 62.15% of the Europe MLCC market share in 2025 and are projected to grow at a 16.42% CAGR through 2031, driven by industrial control and medical device precision requirements.
- By case size, the 201 format held 55.90% revenue share of the Europe MLCC market size in 2025, while the 402 format is forecast to expand at a 16.25% CAGR over 2026-2031 as smartphone and wearable integrators migrate to smaller footprints.
- By voltage, ≤100 V MLCCs accounted for 58.80% of the Europe MLCC market size in 2025 and are advancing at a 16.22% CAGR, whereas mid-voltage (100-500 V) units serve 48 V architecture transitions at automotive OEMs.
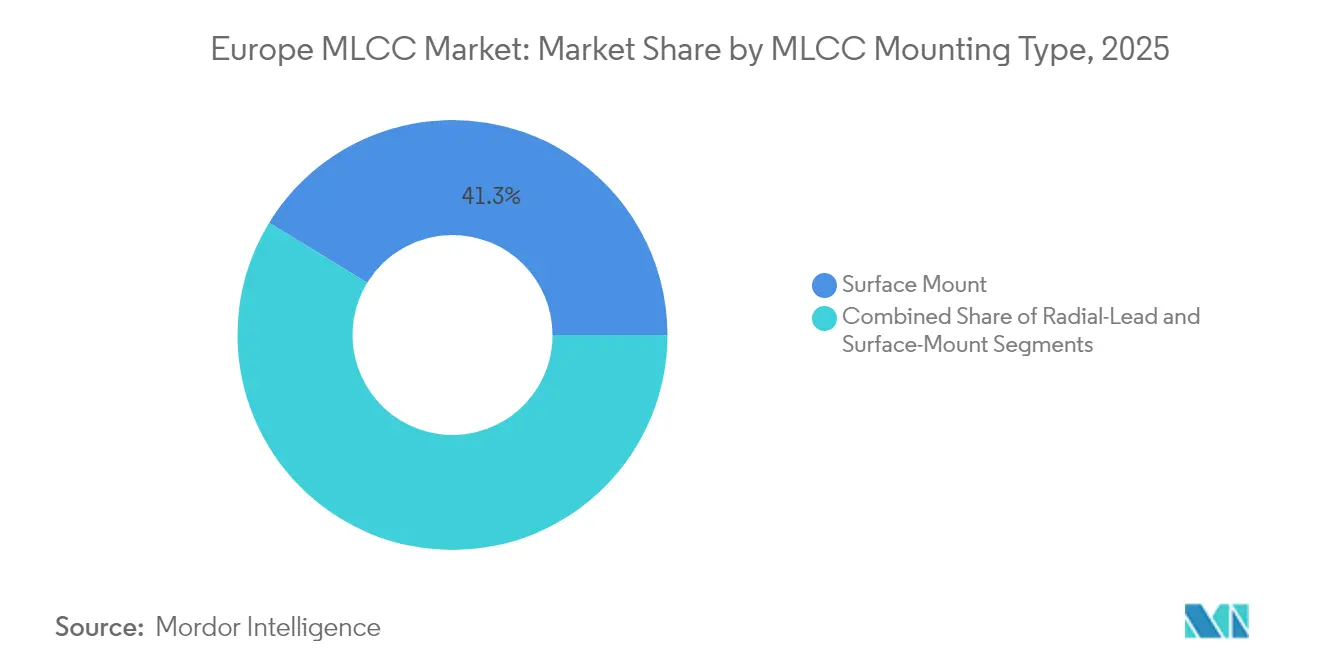
- By mounting type, surface-mount MLCCs commanded 41.25% share in 2025; metal-cap variants, optimized for vibration resilience, are set to rise at a 16.05% CAGR through 2031 as ADAS penetration intensifies.
- By end-user application, consumer electronics remained the largest segment at a 50.85% revenue share in 2025; however, automotive applications are projected to post the fastest growth rate of 16.55% CAGR, reflecting the surge in on-board electronic content per vehicle.
- By geography, Germany led the Europe MLCC market with a 40.70% market share in 2025 and is projected to grow at a 16.68% CAGR, driven by vertically integrated EV, battery, and industrial automation clusters.
Note: Market size and forecast figures in this report are generated using Mordor Intelligence’s proprietary estimation framework, updated with the latest available data and insights as of 2026.
Europe MLCC Market Trends and Insights
Drivers Impact Analysis*
| Driver | (~) % Impact on CAGR Forecast | Geographic Relevance | Impact Timeline |
|---|---|---|---|
| Proliferation of Advanced Driver-Assistance Systems (ADAS) in European automotive electronics | +3.2% | Germany, France, Italy | Medium term (2-4 years) |
| Growing 5G smartphone penetration requiring higher-capacitance-density components | +2.8% | Germany, UK, Nordic countries | Short term (≤2 years) |
| Rapid expansion of European EV battery production facilities boosting MLCC demand | +4.1% | Germany, Sweden, Hungary | Medium term (2-4 years) |
| EU Carbon Border Adjustment Mechanism incentivizing local MLCC sourcing | +2.3% | EU-wide | Long term (≥4 years) |
| Shift toward miniaturized medical implants using high-Q Class 1 MLCCs | +1.8% | Germany, Switzerland, Netherlands | Long term (≥4 years) |
| Re-shoring of European defense-electronics supply chains post-Ukraine conflict | +1.3% | Eastern Europe, Germany, France | Medium term (2-4 years) |
| Source: Mordor Intelligence | |||
Proliferation of Advanced Driver-Assistance Systems (ADAS) in European Automotive Electronics
Regulatory mandates that tighten NCAP safety-score thresholds and consumer appetite for semi-autonomous driving push average MLCC counts toward 20,000 units per electric vehicle, compared to roughly 3,000 units in earlier 12V platforms. Automotive-grade MLCCs carry a 3× price premium relative to IT-grade parts, thereby elevating revenue pools even when unit growth plateaus. Samsung Electro-Mechanics’ 2.2 µF, 10 V MLCC in the 1005 package raises voltage headroom by 60% over previous 6.3 V benchmarks, specifically tailored for LiDAR transceiver boards. [1]Samsung Electro-Mechanics, “World’s First MLCC for LiDAR Applications,” samsungsem.com Simultaneously, the transition to 48 V mild-hybrid architectures increases demand for decoupling capacitors that can smooth high-frequency transients, thereby boosting specification counts in power-conversion modules. Commercial truck and bus electrification multiplies those effects as European fleet operators adopt zero-emission mandates.
Growing 5G Smartphone Penetration Requiring Higher Capacitance Density Components
Although Europe’s 5G subscriber penetration lags behind that of its Asian peers, operators are condensing multi-year rollouts into tighter investment windows, thereby increasing the procurement intensity of radio subsystems and premium handsets. [2]Credit Suisse, “Telecom Equipment: 5G – telco capex update,” credit-suisse.com The 26 GHz millimeter-wave allocation demands ultra-low ESR MLCCs for RF power amplifiers, while premium smartphones now exceed 1,000 embedded MLCCs. Murata’s 006003-inch footprint shrinks volumetric occupancy by 75%, catering to handset OEMs battling board congestion. European telcos’ fiber-to-the-home bias shifts some demand toward transport-layer equipment rather than macro cells, favoring MLCCs rated for higher voltage rails in coherent optical modules.
Rapid Expansion of European EV Battery Production Facilities Boosting MLCC Demand
Northvolt’s 60 GWh plant in Heide represents one of more than 40 announced gigafactory projects across the bloc, each deploying millions of MLCCs in battery-management boards, formation chargers, and inverter stages. Proximity sourcing becomes strategic as OEMs seek to mitigate logistics risks and align with circular economy targets. McKinsey projects a cumulative capital allocation of USD 150 billion into EU cell manufacturing by 2040, translating into a sizable multiplier effect for passive-component suppliers willing to co-locate or establish bonded inventories near battery campuses.
EU Carbon Border Adjustment Mechanism Incentivizing Local MLCC Sourcing
CBAM’s initial scope excludes electronics; yet, OEMs already embed carbon-intensity metrics in supplier scorecards to preempt downstream inclusion after 2030. The administrative burden of documenting embedded emissions favors incumbents with robust life-cycle data and accelerates the qualification of regional capacity. Asian suppliers risk cost disadvantages if carbon levies applied at the point of import are not fully creditable, especially for nickel-electrode MLCCs produced in coal-heavy grids.
Restraints Impact Analysis*
| Restraint | (~) % Impact on CAGR Forecast | Geographic Relevance | Impact Timeline |
|---|---|---|---|
| Volatility in critical raw-material prices (nickel, copper, palladium) | −2.1% | Global; affects European imports | Short term (≤2 years) |
| Supply–demand imbalance due to lengthy capacity-expansion cycles | −1.8% | Global; European supply chains | Medium term (2-4 years) |
| EU REACH limits on lead-containing dielectrics raising compliance costs | −1.5% | EU-wide | Long term (≥4 years) |
| Declining European electronics manufacturing share weakening economies of scale | −1.2% | EU-wide | Medium term (2-4 years) |
| Source: Mordor Intelligence | |||
Volatility in Critical Raw Material Prices (Nickel, Copper, Palladium)
A 20% nickel-spot swing compresses MLCC gross margins by up to 150 bps and lengthens price-adjustment negotiations with automotive Tier-1s, many of whom operate under 18-month price locks. [3]Dennis M. Zogbi, “MLCC and Thick Film Chip Resistors: Supply Chain Review,” tti.com The shift from palladium to base-metal electrodes only partially shields costs because a handful of metallurgical specialists bottleneck the ultra-fine nickel powder supply, which is concentrated in East Asia. European OEMs face increased foreign exchange exposure, as LME-denominated nickel trades predominantly in USD.
Supply–Demand Imbalance Due to Lengthy Capacity Expansion Cycles
Green-field MLCC fabs require up to seven years from permitting to automotive qualification, resulting in a chronic lag between demand spikes and supply responses. Machinery supply is another bottleneck: only a small group of Japanese toolmakers produces high-accuracy sheet-lamination and sintering lines, each with a 12-month lead time. As European consumption rises faster than on-continent capacity, OEMs become increasingly dependent on Asian suppliers, who are also servicing robust domestic demand, thereby amplifying allocation risk during peak cycles.
*Our forecasts treat driver/restraint impacts as directional, not additive. The impact forecasts reflect baseline growth, mix effects, and variable interactions.
Segment Analysis
By Dielectric Type: Class 1 Dominance Reflects European Precision Focus
Class 1 devices held a 62.15% market share in the European MLCC market in 2025 and are projected to grow at a 16.42% CAGR, a trajectory that underscores users’ preference for stable temperature coefficients in safety-critical controls. This premium segment benefits from medical and automation projects where device longevity takes precedence over volumetric efficiency, thereby strengthening margin profiles for suppliers. Class 2 capacitors still power bulk-capacitance slots in consumer handsets and laptops, yet their lower dielectric constants are increasingly challenged by polymer alternatives that offer better DC-bias performance.
Ahead, the Europe MLCC market will likely favor Class 1 devices for emerging gallium-nitride inverter stacks, where high-frequency switching elevates the need for negligible ESR. EU REACH limits on lead zirconate titanate are pushing R&D toward lead-free perovskite systems capable of retaining permittivity above 2,000; however, mass adoption hinges on electrode compatibility and cost. Consequently, Class 1 revenues are set to widen their lead even in a scenario of stable unit share.


By Case Size: Miniaturization Pressures Drive 402 Growth
The 201 footprint retained 55.90% share in 2025, yet 402 packages will clock a 16.25% CAGR until 2031 as portable OEMs chase thinner boards and bezel-less form factors. Europe MLCC market size tied to 402 packages will therefore outpace overall growth, although 603 and larger formats sustain relevance where voltage derating margins are mandatory.
Automotive modules, especially inverters and DC–DC converters, continue to demand 0805 and 1210 formats to achieve higher ripple-current capability. Würth Elektronik’s soft-termination series in 0603-to-1210 packages mitigates board-flex crack risk, fulfilling AEC-Q200 surge tests and reinforcing its niche in high-vibration environments.
By Voltage: Low-Voltage Segments Dominate Amid Power Density Trends
Low-voltage (≤100 V) components contributed 58.80% to the European MLCC market size in 2025 and are expected to grow at a 16.22% CAGR, driven by the proliferation of smartphones, PCs, and IoT nodes. The mid-voltage (100-500 V) tier is leveraged by 48 V automotive networks and industrial drives, presenting a rising share of design-ins as OEMs migrate away from 12 V buses.
TDK’s 100 V MLCC with 10 µF capacitance in the 3225 package reduces board occupation by 50% for 48 V converters, illustrating how suppliers extend voltage ratings within existing case sizes to meet emerging power topologies. At the high-voltage (>500 V) frontier, demand crystallizes in renewable-energy inverters and X2-class safety nodes for AC mains filters, a sub-segment expected to grow in double digits, albeit from a small base.
By MLCC Mounting Type: Surface-Mount Dominance with Metal Cap Acceleration
Surface-mount products retained a 41.25% share in 2025, epitomizing automated assembly norms at European EMS houses. Metal-cap versions, offering superior vibration robustness, are on a 16.05% CAGR track as ADAS and e-mobility electronics migrate under the hood, where thermomechanical stress intensifies.
Soft-termination technology blurs the line between the two camps by dispersing board flex strain via conductive polymer edge layers, winning spots in battery-control modules and powertrain inverters. Radial-lead MLCCs persist in avionics and rail signaling platforms that value through-hole mechanical anchoring.
By End-User Application: Automotive Acceleration Transforms Market Dynamics
Consumer electronics still command a 50.85% share; yet, automotive modules expand at a 16.55% CAGR, rewriting supplier qualification priorities toward AEC-Q200 proofing and PPAP documentation. Each electric-drive train embeds up to ten times more MLCCs than internal-combustion benchmarks, shifting volume growth decisively to vehicle platforms.
Industrial automation maintains a steady mid-teens growth rate as EU factories digitize and retrofit their sensor networks, while demand for high-Q capacitors in medical equipment secures premium pricing. Telecom infrastructure capital outlays exhibit lumpy timing, yet updates to radio and transport gear require stringent reliability screening, which sustains a profitable niche for suppliers skilled in high-frequency design.
Geography Analysis
Germany’s dominance stems from its automotive manufacturing complex, which encompasses drive units, infotainment systems, and battery management systems. The nation’s 40.70% European MLCC market share in 2025 aligns with a 16.68% CAGR through 2031, as expanding EV capacity at Tesla-Berlin and Northvolt-Heide agglomerates drives downstream component pull. Industrial robots and machine-tool exports add a stable base by demanding Class 1 capacitors for servo drives and PLCs. Renewable-energy investment, especially in offshore-wind converters, introduces additional high-voltage MLCC demand.
In the United Kingdom, aerospace primes such as BAE Systems and Rolls-Royce specify high-reliability MLCCs rated for temperatures ranging from −55 °C to +200 °C, thereby bolstering revenue despite smaller unit volumes. Britain’s telecom sector, driven by private-equity-backed fiber operators, fuels mid-voltage MLCC consumption in optical transport gear. London’s low-latency trading infrastructure upgrades utilize low-ESR MLCCs on FPGA accelerator cards, diversifying the application mix.
The Rest-of-Europe block benefits from Poland’s and Czechia’s vehicle plants, Sweden’s battery initiatives, and the Netherlands' medical device cluster. France’s aerospace sector demands Class 1 NP0 parts for flight-control computers, whereas Italy’s industrial equipment exports draw on mid-voltage segments. Spain and Portugal fast-track solar-PV and grid-storage installations, thus absorbing high-voltage safety-certified MLCCs in inverter filters. Across these nations, REACH compliance harmonizes sourcing requirements, simplifying multi-country procurement frameworks.
Competitive Landscape
Innovation and Customization Drive Future Success
The European MLCC market is moderately concentrated, with Japanese and South Korean giants-Murata, TDK, and Samsung Electro-Mechanics-dominating the high-end supply through their vertically integrated competencies in ceramic powder and electrode printing. Their automotive and telecom portfolios meet AEC-Q200 and IEC reliability standards, and each pair's technical breadth is complemented by carbon-neutrality pledges that align with EU procurement policies.
European contenders focus on niche propositions. Würth Elektronik positions all-in-one local warehousing, soft-termination technology, and full traceability as differentiators, cultivating loyalty among industrial and medical OEMs that prioritize supply continuity over the best price bids. Panasonic Industry promotes polymer capacitors as drop-in substitutes in power supplies where DC-bias derating undermines MLCC efficiency, capturing share in server and telecom backplanes.
Product innovation cycles keep intensifying. TDK’s 10 µF/100 V automotive MLCC line reduces board area by 50% while meeting 1,000-cycle thermal shock requirements. Murata’s tie-up with QuantumScape leverages ceramic know-how for solid-state battery separators, underscoring a strategy to diversify beyond commoditized capacitance and into adjacent ceramic platforms. Meanwhile, Samsung Electro-Mechanics extends AEC-Q200 qualification down to 1005 footprints, betting that advanced driver-monitoring and LiDAR modules will favor suppliers offering high-density packages without reliability trade-offs.
Europe MLCC Industry Leaders
KYOCERA AVX Components Corporation
Maruwa Co., Ltd.
Murata Manufacturing Co., Ltd.
Nippon Chemi-Con Corporation
Samsung Electro-Mechanics Co., Ltd.
- *Disclaimer: Major Players sorted in no particular order


Recent Industry Developments
- June 2025: TDK introduced commercial-grade MLCCs with record capacitance at 100 V in a 1608 footprint for compact industrial and consumer boards.
- April 2025: Murata Manufacturing and QuantumScape initiated collaboration for high-volume ceramic film manufacturing aimed at solid-state lithium-metal batteries, leveraging Murata’s MLCC ceramic expertise to expand into EV battery separators
- April 2025: TDK launched an automotive MLCC series that achieves 10 µF at 100 V in a 3225 case, enabling 50% component-count reduction for 48 V power architectures
- February 2025: Samsung Electro-Mechanics unveiled a 2.2 µF, 10 V MLCC in 1005 size, qualified to AEC-Q200, for automotive LiDAR power-rails


Europe MLCC Market Report Scope
Class 1, Class 2 are covered as segments by Dielectric Type. 0 201, 0 402, 0 603, 1 005, 1 210, Others are covered as segments by Case Size. 500V to 1000V, Less than 500V, More than 1000V are covered as segments by Voltage. 100µF to 1000µF, Less than 100µF, More than 1000µF are covered as segments by Capacitance. Metal Cap, Radial Lead, Surface Mount are covered as segments by Mlcc Mounting Type. Aerospace and Defence, Automotive, Consumer Electronics, Industrial, Medical Devices, Power and Utilities, Telecommunication, Others are covered as segments by End User. Germany, United Kingdom, Others are covered as segments by Country.| Class 1 |
| Class 2 |
| 201 |
| 402 |
| 603 |
| 1005 |
| 1210 |
| Other Case Sizes |
| Low Voltage (less than or equal to 100 V) |
| Mid Voltage (100 – 500 V) |
| High Voltage (above 500 V) |
| Metal Cap |
| Radial Lead |
| Surface-Mount |
| Aerospace and Defence |
| Automotive |
| Consumer Electronics |
| Industrial |
| Medical Devices |
| Power and Utilities |
| Telecommunication |
| Other End-User Applications |
| Germany |
| United Kingdom |
| Rest of Europe |
| By Dielectric Type | Class 1 |
| Class 2 | |
| By Case Size | 201 |
| 402 | |
| 603 | |
| 1005 | |
| 1210 | |
| Other Case Sizes | |
| By Voltage | Low Voltage (less than or equal to 100 V) |
| Mid Voltage (100 – 500 V) | |
| High Voltage (above 500 V) | |
| By MLCC Mounting Type | Metal Cap |
| Radial Lead | |
| Surface-Mount | |
| By End-User Application | Aerospace and Defence |
| Automotive | |
| Consumer Electronics | |
| Industrial | |
| Medical Devices | |
| Power and Utilities | |
| Telecommunication | |
| Other End-User Applications | |
| By Geography | Germany |
| United Kingdom | |
| Rest of Europe |


Market Definition
- MLCC (Multilayer Ceramic Capacitor) - A type of capacitor that consists of multiple layers of ceramic material, alternating with conductive layers, used for energy storage and filtering in electronic circuits.
- Voltage - The maximum voltage that a capacitor can safely withstand without experiencing breakdown or failure. It is typically expressed in volts (V)
- Capacitance - The measure of a capacitor's ability to store electrical charge, expressed in farads (F). It determines the amount of energy that can be stored in the capacitor
- Case Size - The physical dimensions of an MLCC, typically expressed in codes or millimeters, indicating its length, width, and height
| Keyword | Definition |
|---|---|
| MLCC (Multilayer Ceramic Capacitor) | A type of capacitor that consists of multiple layers of ceramic material, alternating with conductive layers, used for energy storage and filtering in electronic circuits. |
| Capacitance | The measure of a capacitor's ability to store electrical charge, expressed in farads (F). It determines the amount of energy that can be stored in the capacitor |
| Voltage Rating | The maximum voltage that a capacitor can safely withstand without experiencing breakdown or failure. It is typically expressed in volts (V) |
| ESR (Equivalent Series Resistance) | The total resistance of a capacitor, including its internal resistance and parasitic resistances. It affects the capacitor's ability to filter high-frequency noise and maintain stability in a circuit. |
| Dielectric Material | The insulating material used between the conductive layers of a capacitor. In MLCCs, commonly used dielectric materials include ceramic materials like barium titanate and ferroelectric materials |
| SMT (Surface Mount Technology) | A method of electronic component assembly that involves mounting components directly onto the surface of a printed circuit board (PCB) instead of through-hole mounting. |
| Solderability | The ability of a component, such as an MLCC, to form a reliable and durable solder joint when subjected to soldering processes. Good solderability is crucial for proper assembly and functionality of MLCCs on PCBs. |
| RoHS (Restriction of Hazardous Substances) | A directive that restricts the use of certain hazardous materials, such as lead, mercury, and cadmium, in electrical and electronic equipment. Compliance with RoHS is essential for automotive MLCCs due to environmental regulations |
| Case Size | The physical dimensions of an MLCC, typically expressed in codes or millimeters, indicating its length, width, and height |
| Flex Cracking | A phenomenon where MLCCs can develop cracks or fractures due to mechanical stress caused by bending or flexing of the PCB. Flex cracking can lead to electrical failures and should be avoided during PCB assembly and handling. |
| Aging | MLCCs can experience changes in their electrical properties over time due to factors like temperature, humidity, and applied voltage. Aging refers to the gradual alteration of MLCC characteristics, which can impact the performance of electronic circuits. |
| ASPs (Average Selling Prices) | The average price at which MLCCs are sold in the market, expressed in USD million. It reflects the average price per unit |
| Voltage | The electrical potential difference across an MLCC, often categorized into low-range voltage, mid-range voltage, and high-range voltage, indicating different voltage levels |
| MLCC RoHS Compliance | Compliance with the Restriction of Hazardous Substances (RoHS) directive, which restricts the use of certain hazardous substances, such as lead, mercury, cadmium, and others, in the manufacturing of MLCCs, promoting environmental protection and safety |
| Mounting Type | The method used to attach MLCCs to a circuit board, such as surface mount, metal cap, and radial lead, which indicates the different mounting configurations |
| Dielectric Type | The type of dielectric material used in MLCCs, often categorized into Class 1 and Class 2, representing different dielectric characteristics and performance |
| Low-Range Voltage | MLCCs designed for applications that require lower voltage levels, typically in the low voltage range |
| Mid-Range Voltage | MLCCs designed for applications that require moderate voltage levels, typically in the middle range of voltage requirements |
| High-Range Voltage | MLCCs designed for applications that require higher voltage levels, typically in the high voltage range |
| Low-Range Capacitance | MLCCs with lower capacitance values, suitable for applications that require smaller energy storage |
| Mid-Range Capacitance | MLCCs with moderate capacitance values, suitable for applications that require intermediate energy storage |
| High-Range Capacitance | MLCCs with higher capacitance values, suitable for applications that require larger energy storage |
| Surface Mount | MLCCs designed for direct surface mounting onto a printed circuit board (PCB), allowing for efficient space utilization and automated assembly |
| Class 1 Dielectric | MLCCs with Class 1 dielectric material, characterized by a high level of stability, low dissipation factor, and low capacitance change over temperature. They are suitable for applications requiring precise capacitance values and stability |
| Class 2 Dielectric | MLCCs with Class 2 dielectric material, characterized by a high capacitance value, high volumetric efficiency, and moderate stability. They are suitable for applications that require higher capacitance values and are less sensitive to capacitance changes over temperature |
| RF (Radio Frequency) | It refers to the range of electromagnetic frequencies used in wireless communication and other applications, typically from 3 kHz to 300 GHz, enabling the transmission and reception of radio signals for various wireless devices and systems. |
| Metal Cap | A protective metal cover used in certain MLCCs (Multilayer Ceramic Capacitors) to enhance durability and shield against external factors like moisture and mechanical stress |
| Radial Lead | A terminal configuration in specific MLCCs where electrical leads extend radially from the ceramic body, facilitating easy insertion and soldering in through-hole mounting applications. |
| Temperature Stability | The ability of MLCCs to maintain their capacitance values and performance characteristics across a range of temperatures, ensuring reliable operation in varying environmental conditions. |
| Low ESR (Equivalent Series Resistance) | MLCCs with low ESR values have minimal resistance to the flow of AC signals, allowing for efficient energy transfer and reduced power losses in high-frequency applications. |


Research Methodology
Mordor Intelligence has followed the following methodology in all our MLCC reports.
- Step 1: Identify Data Points: In this step, we identified key data points crucial for comprehending the MLCC market. This included historical and current production figures, as well as critical device metrics such as attachment rate, sales, production volume, and average selling price. Additionally, we estimated future production volumes and attachment rates for MLCCs in each device category. Lead times were also determined, aiding in forecasting market dynamics by understanding the time required for production and delivery, thereby enhancing the accuracy of our projections.
- Step 2: Identify Key Variables: In this step, we focused on identifying crucial variables essential for constructing a robust forecasting model for the MLCC market. These variables include lead times, trends in raw material prices used in MLCC manufacturing, automotive sales data, consumer electronics sales figures, and electric vehicle (EV) sales statistics. Through an iterative process, we determined the necessary variables for accurate market forecasting and proceeded to develop the forecasting model based on these identified variables.
- Step 3: Build a Market Model: In this step, we utilized production data and key industry trend variables, such as average pricing, attachment rate, and forecasted production data, to construct a comprehensive market estimation model. By integrating these critical variables, we developed a robust framework for accurately forecasting market trends and dynamics, thereby facilitating informed decision-making within the MLCC market landscape.
- Step 4: Validate and Finalize: In this crucial step, all market numbers and variables derived through an internal mathematical model were validated through an extensive network of primary research experts from all the markets studied. The respondents are selected across levels and functions to generate a holistic picture of the market studied.
- Step 5: Research Outputs: Syndicated Reports, Custom Consulting Assignments, Databases, and Subscription Platform


