Multilayer Ceramic Capacitor (MLCC) Market Size and Share
Market Overview
| Study Period | 2020 - 2031 |
|---|---|
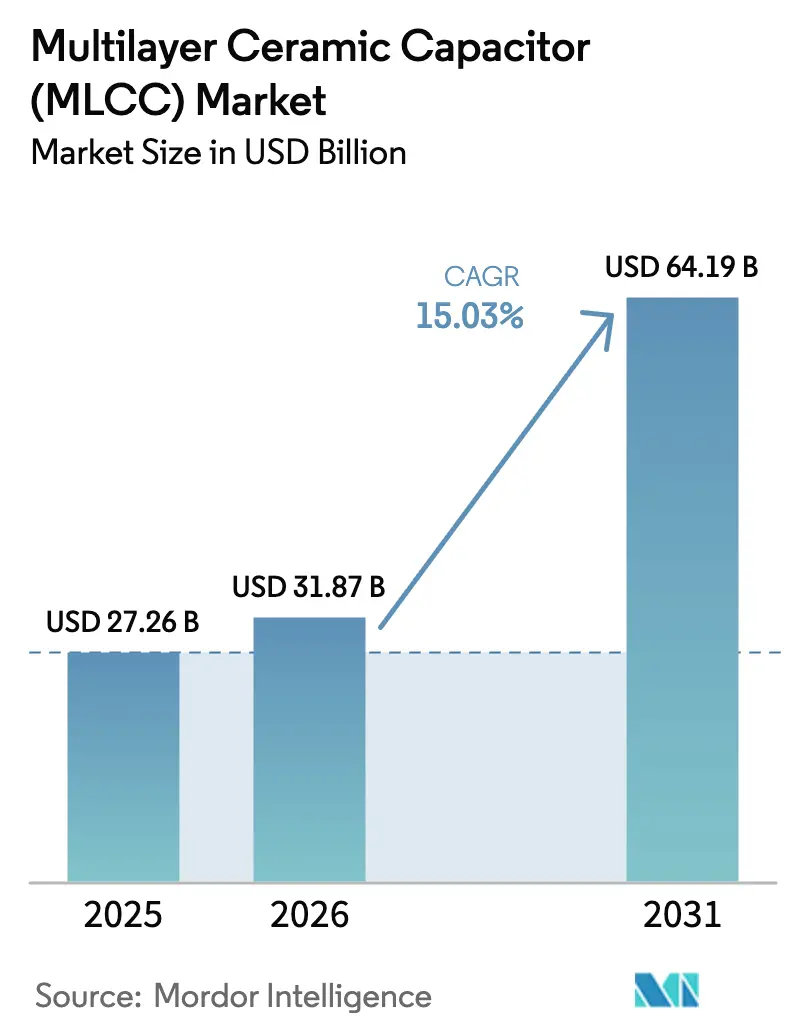
| Market Size (2026) | USD 31.87 Billion |
| Market Size (2031) | USD 64.19 Billion |
| Growth Rate (2026 - 2031) | 15.03% CAGR |
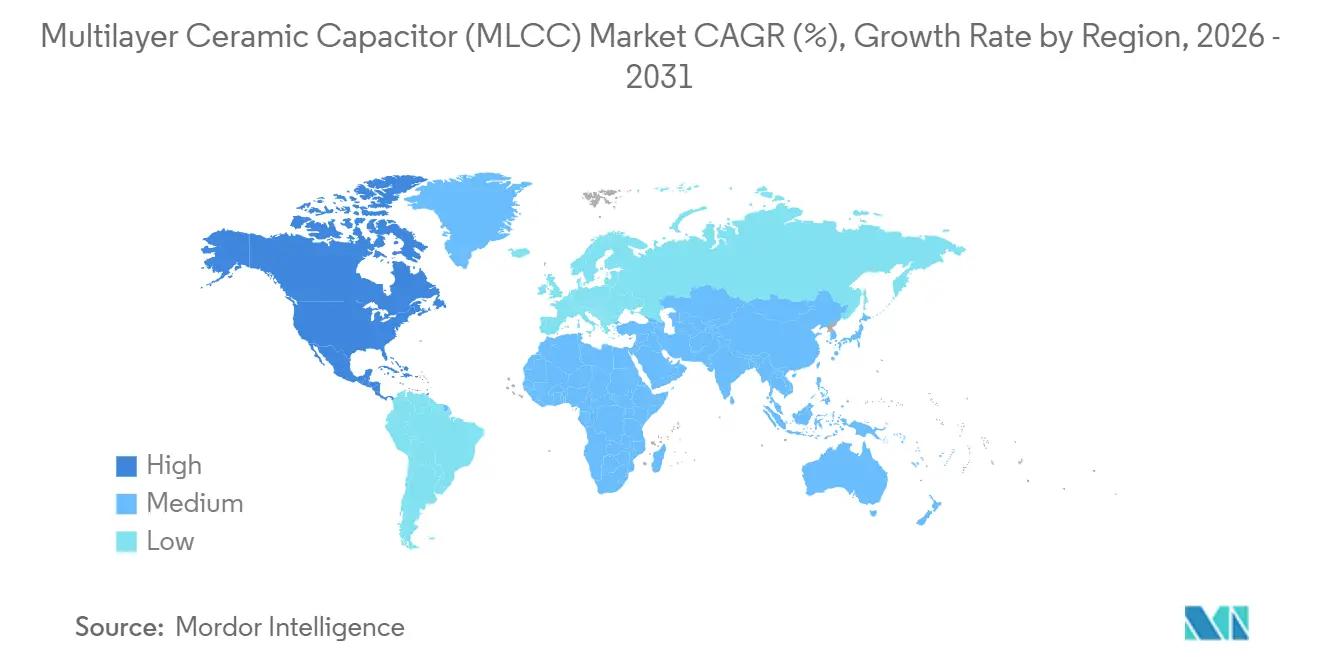
| Fastest Growing Market | North America |
| Largest Market | Asia-Pacific |
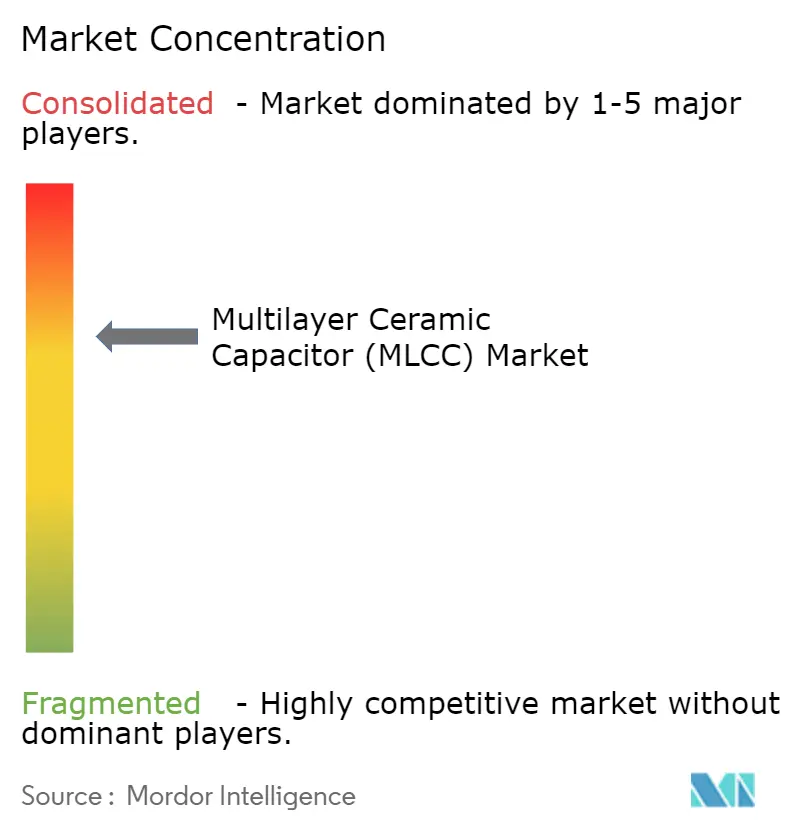
| Market Concentration | Medium |
Major Players
*Disclaimer: Major Players sorted in no particular order Image © Mordor Intelligence. Reuse requires attribution under CC BY 4.0. |
|
Multilayer Ceramic Capacitor (MLCC) Market Analysis by Mordor Intelligence
The multilayer ceramic capacitor (MLCC) market size is projected to expand from USD 27.26 billion in 2025 and USD 31.87 billion in 2026 to USD 64.19 billion by 2031, registering a CAGR of 15.03% between 2026 to 2031. Demand is moving beyond consumer electronics toward automotive power systems, AI servers, and connected devices with more demanding electrical requirements. These uses require reliable components that retain their electrical characteristics under heat, voltage, vibration, and continuous operation. Suppliers with advanced ceramic materials and established qualification processes are better placed to serve these applications. High-end production capacity remains important because small changes in layer thickness and capacitance can affect yields and delivery schedules. The multilayer ceramic capacitor (MLCC) market is therefore separating more clearly between high-volume standard parts and specialized components that need closer engineering support.
Key Report Takeaways
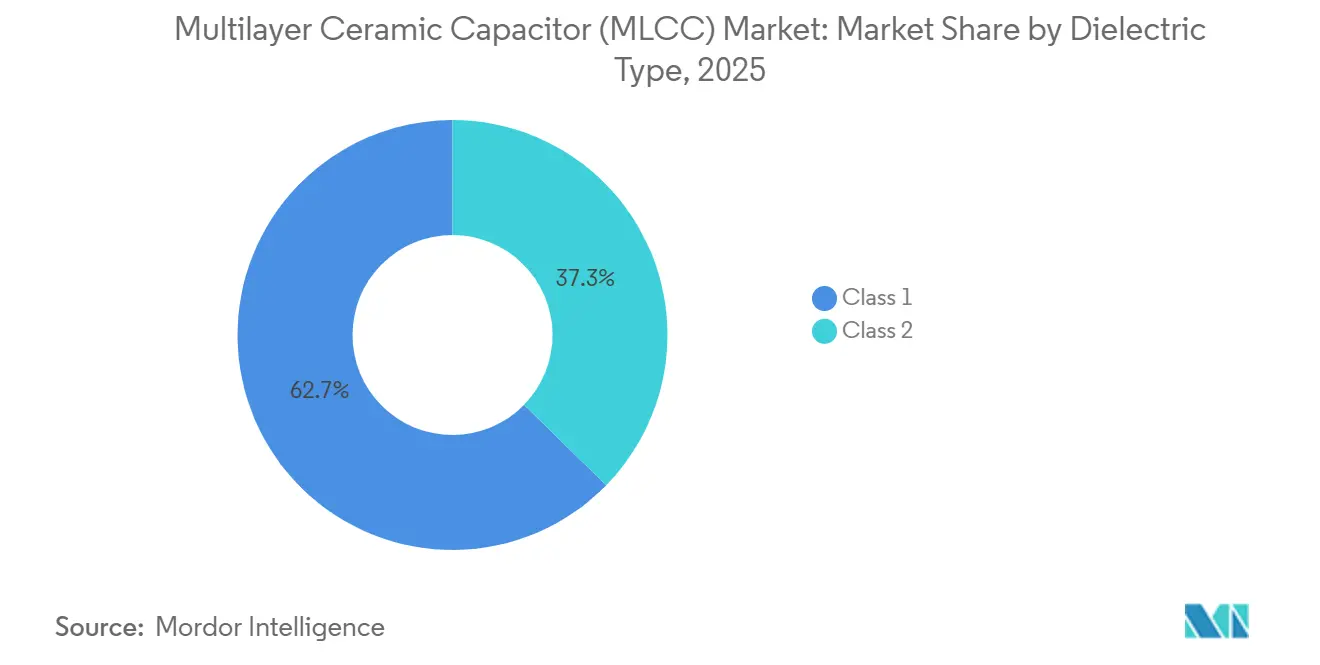
- By dielectric type, Class 1 MLCCs led with 62.69% share of the multilayer ceramic capacitor (MLCC) market in 2025. Class 1 MLCCs also expected to record the highest growth outlook within this segmentation, advancing at a 15.83% CAGR through 2031.
- By case size, the 0201 format captured 56.48% share of the multilayer ceramic capacitor (MLCC) market. The 0402 format is projected to expand at a 16.02% CAGR to 2031.
- By voltage rating, low-voltage parts below 500 V represented 59.34% share of the MLCC market in 2025. Mid-voltage parts between 500 V and 1,000 V post the strongest momentum, rising at a 15.46% CAGR through 2031.
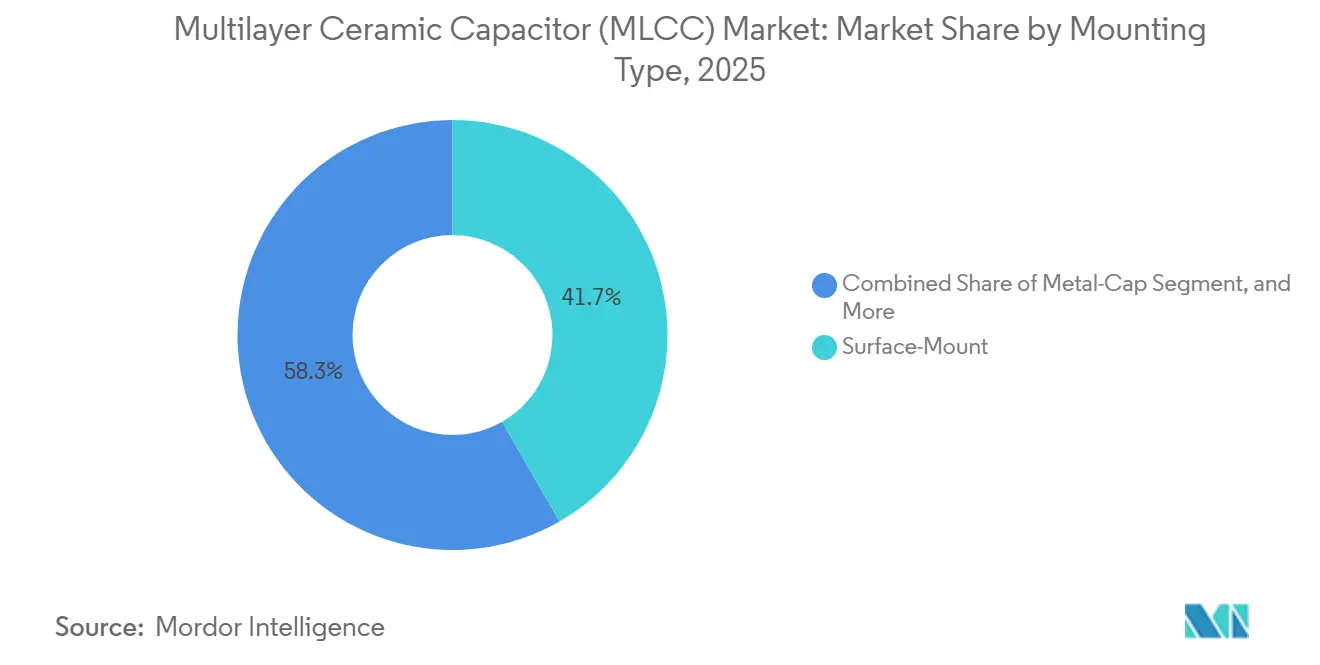
- By mounting type, surface-mount technology held 41.71% share of the MLCC market in 2025. Metal-cap variants show the sharpest climb, moving at an 15.67% CAGR to 2031.
- By end-use application, consumer electronics accounted for 51.46% share of the multilayer ceramic capacitor market in 2025. Automotive applications are growing the quickest, registering a 19.63% CAGR during 2026-2031.
- By geography, Asia-Pacific dominated with 57.69% share of worldwide revenue of the MLCC market in 2025. North America is the fastest-advancing region, expanding at a 16.07% CAGR to 2031.
Note: Market size and forecast figures in this report are generated using Mordor Intelligence’s proprietary estimation framework, updated with the latest available data and insights as of January 2026.
Global Multilayer Ceramic Capacitor (MLCC) Market Trends and Insights
Drivers Impact Analysis*
| Driver | (~) % Impact on CAGR Forecast | Geographic Relevance | Impact Timeline |
|---|---|---|---|
| 800 V EV Architectures Drive High-Voltage MLCC Demand | +4.5% | North America, Europe, China, South Korea | Medium term (2-4 years) |
| AI Server Build-Out Drives Low-ESL, High-CV MLCC Adoption | +3.8% | North America, Asia-Pacific | Short term (≤ 2 years) |
| On-Device AI and Wearables Require Miniature MLCCs | +2.1% | Global, led by Asia-Pacific | Medium term (2-4 years) |
| Diversified Passive-Component Supply Chains | +1.9% | North America, Europe, India, Southeast Asia | Long term (≥ 4 years) |
| Sustainability Requirements Favor Lead-Free and Recycled-Ceramic MLCCs | +0.9% | Europe, Japan, North America | Long term (≥ 4 years) |
| Semiconductor and Subsystem Co-Design Embeds MLCCs in Chiplets | +0.7% | Global, led by North America and East Asia | Long term (≥ 4 years) |
| Source: Mordor Intelligence | |||


800 V EV Architectures Drive High-Voltage MLCC Demand
The move from 400 V to 800 V electric vehicle systems changes the component requirements for traction inverters, onboard chargers, and battery management systems. A battery electric vehicle used 10,000-18,000 MLCCs, compared with 3,000 in a conventional vehicle. Automotive parts must meet lengthy reliability testing before entering a vehicle bill of materials. This requirement favors suppliers that can develop high-voltage ceramics and complete qualification work near their manufacturing sites. Samsung Electro-Mechanics introduced 1,000-1,500 V MLCCs with C0G and X8G characteristics for xEV powertrains in 2026.[1]Samsung Electro-Mechanics, “Samsung Introduces Ultra-High-Voltage 1,500 V MLCCs for xEV Powertrains,” Samsung Electro-Mechanics, product.samsungsem.com The multilayer ceramic capacitor (MLCC) market gains value from this shift because electrical stability becomes a functional requirement rather than an optional feature. Higher-voltage vehicle designs also create a longer design cycle than consumer device programs. Suppliers must demonstrate stable performance across repeated temperature changes and electrical stress. The need for qualified parts limits the ability of smaller producers to enter automotive programs quickly. Murata began mass production of 7 AEC-Q200-qualified MLCCs in April 2026 for automotive electronic circuits. These launches support the use of smaller components in advanced driver-assistance systems and in-vehicle power lines. The multilayer ceramic capacitor (MLCC) market benefits when automakers standardize higher-voltage architectures across several vehicle platforms.
AI Server Build-Out Drives Low-ESL, High-CV MLCC Adoption
AI servers use far more capacitors than conventional enterprise servers because their processors and memory systems require dense power delivery. An advanced AI server baseboard required 15,000-20,000 MLCCs, and an NVIDIA GB300 NVL rack contained 440,000 units. Designers favor low equivalent series inductance and high capacitance values near high-current devices. These specifications increase the importance of component placement, layer control, and reliable supply. Samsung Electro-Mechanics secured cumulative AI-server MLCC contracts exceeding KRW 2.3 trillion, equivalent to USD 1.67 billion, through mid-2026.[2]Samsung Electro-Mechanics, “Samsung Electro-Mechanics Signs 300 Billion Won MLCC Supply Deal for AI Servers,” The Elec, thelec.net The multilayer ceramic capacitor (MLCC) market is supported by long-term supply agreements because data-center buyers need assured access to qualified components. Platform changes can sharply raise the number of MLCCs needed on each board. AMD's MI450 validation work replaced aluminum electrolytic and tantalum capacitors with MLCCs in a relevant power-delivery design. The number of 47 µF, 2.5 V, X6S 0402 units increased from 1,440 to 10,544 per board. This change focused demand on parts that combine high capacitance with a very small footprint. Murata expanded its Izumo capacity, but the facility was not expected to reach full qualification capacity until 2027. The multilayer ceramic capacitor (MLCC) market therefore faces tight availability in high-capacitance grades even when total component output appears adequate.
On-Device AI and Wearables Require Miniature MLCCs
Smartphones, wearables, and other devices with local AI functions need more computing power within limited board space. Smaller MLCCs help designers place decoupling capacitance close to processors and memory. Reducing package size also narrows electrode spacing and increases the need for consistent dielectric quality. Murata introduced a 0.22 µF, 6.3 V, 0201 MLCC in 2025 using barium titanate grains below 50 nm. KYOCERA AVX began volume production of a 47 µF 0402 MLCC in December 2025. The multilayer ceramic capacitor (MLCC) market gains from these products because device makers continue to seek thinner boards and greater power density. Miniature products need manufacturing control that standard commodity lines may not provide. Fine ceramic powders, thin dielectric layers, and precise electrode formation can affect both yield and reliability. Taiyo Yuden commercialized a 1005M embeddable MLCC with 22 µF capacitance in October 2025 for AI servers and high-performance information devices.[3]Taiyo Yuden Co. Ltd., "TAIYO YUDEN Commercializes 1005 Size Embeddable Multilayer Ceramic Capacitor with 22 μF Capacitance for AI Servers, " yuden.co.jp The product supports power-line decoupling while reducing the inductance associated with surface-mounted designs. These advances help suppliers compete on electrical performance rather than on unit price alone. The multilayer ceramic capacitor (MLCC) market is likely to see longer qualification and delivery cycles for components below the 1005 size range.
Diversified Passive-Component Supply Chains
Rare earth materials used in barium titanate formulations have made supply continuity a larger concern for MLCC producers. Yttrium, lanthanum, and neodymium support material properties needed in high-reliability applications. Murata announced a 3-year plan in March 2026 to separate China-based rare-earth supply chains from its global operations. The company also began packaging and shipping from its Chennai facility in 2025. Samsung Electro-Mechanics committed USD 1.2 billion to its Thai Nguyen facility expansion alongside domestic investment in South Korea. The multilayer ceramic capacitor (MLCC) market is affected because geographic diversification requires time, capital, and repeated qualification work. New manufacturing locations can reduce exposure to a single supply base, but they can also increase near-term operating costs. Established clusters have specialized materials suppliers, technical labor, and testing capabilities that new sites may lack. Producers must keep product quality consistent while moving parts of the production process to new locations. These conditions favor large companies with resources to support parallel qualification programs. Buyers also need to balance supply resilience with the cost of managing more approved suppliers. The multilayer ceramic capacitor (MLCC) market will continue to be shaped by investments in India, Southeast Asia, North America, and Europe.
Restraints Impact Analysis*
| Restraint | (~) % Impact on CAGR Forecast | Geographic Relevance | Impact Timeline |
|---|---|---|---|
| Nickel and Palladium Price Volatility Raises Bill-of-Materials Costs | -2.4% | Global, especially mid-tier Asian producers | Short term (≤ 2 years) |
| Automotive-Grade MLCC Capacity Mismatch | -1.8% | North America, Europe, China | Medium term (2-4 years) |
| China-Led Pricing Pressure in Commodity MLCCs | -1.3% | Global, centered on consumer electronics | Medium term (2-4 years) |
| Physical Limits on Dielectric Layer Thickness | -0.9% | Global | Long term (≥ 4 years) |
| Source: Mordor Intelligence | |||
Nickel and Palladium Price Volatility Raises Bill-of-Materials Costs
Nickel and palladium represented 18-24% of production costs for high-purity MLCC grades. Changes in electrode-metal prices can reduce margins where consumer-product prices already face annual erosion. Nickel rose 42% in early 2024 and then fell 18% by late 2025. Palladium traded between USD 900 and USD 1,400 per troy ounce during the period discussed in the draft. A 10% increase in electrode-metal cost raised finished MLCC bill-of-material costs by 3-5%. The multilayer ceramic capacitor (MLCC) market is exposed because high-quality materials cannot always be substituted quickly. TDK reported that raw-material inflation reduced its passive-component operating margin by 120 basis points in fiscal 2026. The company accelerated its copper-electrode substitution work in response. Murata also used quarterly price clauses linked to nickel futures in negotiations with data-center clients. These arrangements can share input risk, but they can make purchasing discussions harder for consumer-electronics buyers. Smaller producers without hedging programs reduced automotive MLCC output in late 2025. The result can be tighter availability in applications already facing strong demand.
Automotive-Grade MLCC Capacity Mismatch
Automotive-grade MLCCs is a major contrinuter to voulmetric demand. AEC-Q200 testing and thermal shock requirements can extend production ramps to 18-24 months. This timeline remains relevant even when a manufacturer adds physical production capacity. Samsung Electro-Mechanics reported 26-week lead times for automotive-grade parts in early 2025. Murata's Izumo expansion was not expected to complete automotive qualification until late 2027. The multilayer ceramic capacitor (MLCC) market cannot resolve this constraint solely by adding general-purpose capacity. Automakers may pay 30-50% premiums for constrained AEC-Q200 inventory. They may also freeze component specifications earlier than usual to secure allocation. Both responses reduce design flexibility and increase vehicle electronics costs. Functional safety requirements prevent automakers from replacing qualified parts with commercial-grade alternatives. This protects automotive pricing from the pressure visible in standard consumer components. It also makes rigorous testing capacity a critical part of the competitive position of major suppliers.
*Our forecasts treat driver/restraint impacts as directional, not additive. The impact forecasts reflect baseline growth, mix effects, and variable interactions.
Segment Analysis
By Dielectric Type: Class 1 Leads Precision Applications
Class 1 held 62.69% of the multilayer ceramic capacitor (MLCC) market share in 2025 and is projected to expand at a 15.83% CAGR through 2031. Its C0G, NP0, and C0H formulations provide stable capacitance across temperature changes and DC-bias conditions. This stability matters in EV converters and AI-server power regulators where electrical drift can affect system performance. The segment’s leadership in both revenue and growth reflects demand for more reliable components. Samsung Electro-Mechanics developed 1,000-1,500 V C0G and X8G products for xEV powertrains. These products operate over a temperature range from -55°C to +150°C. The multilayer ceramic capacitor (MLCC) industry relies on this material performance when applications cannot accept variation in capacitance. The segment is consequently less exposed to price competition than standard component categories.
Class 2 products, including X7R, X5R, and X6S, remain important for consumer devices and general power decoupling. These materials can provide higher capacitance in a given footprint than Class 1 alternatives. X6S products are increasingly used for high-capacitance rails in AI servers. GPU power delivery networks need values from 47 µF to 100 µF that Class 1 chemistry cannot provide at similar scale. Research published in Advanced Materials in 2026 identified grain-boundary segregation as a route to improve DC-bias performance in barium titanate MLCCs with layers below 400 nm.[4]Ji-Sang An et al., “Microstructure Optimization Via Grain-Boundary Segregation to Enhance DC Bias Dielectric Performance of BaTiO₃ Multilayer Ceramic Capacitors,” Advanced Materials, doi.org This work may narrow the performance gap between precise Class 1 materials and higher-capacitance Class 2 materials. The multilayer ceramic capacitor (MLCC) market will depend on progress in both chemistries because end uses have different needs for stability and capacitance density.


By Case Size: 0201 Anchors Revenue While 0402 Gains From AI Designs
The 0201 case size held 56.48% of revenue in 2025. It remains common in consumer electronics, 5G radio front ends, and industrial automation circuit boards. Its small 0.6 × 0.3 mm footprint supports dense board layouts. The 0402 format is projected to expand at a 16.02% CAGR through 2031. AI server power networks need capacitors placed within 2 mm of GPU and high-bandwidth memory dies. This placement requirement favors 0402 products over larger case sizes. The multilayer ceramic capacitor (MLCC) market size for smaller formats is supported by the need to keep power paths short. Designers must balance this demand with the technical difficulty of making thin, reliable dielectric layers.
Murata introduced a 47 µF, 4 V, 0402 MLCC with 800 dielectric layers of 0.6 µm thickness in July 2025. The product showed how added layer counts can increase capacitance without moving to a larger package. The 0603 format remains relevant in industrial and telecommunications power-management systems. The 1005 and 1210 sizes continue to serve high-voltage automotive uses that need greater voltage-withstand margins. Taiyo Yuden commercialized a 22 µF 1005M embeddable MLCC in October 2025 for AI-server decoupling. Murata also introduced bulk-case packaging for 0201 and 01005 components in 2026.[5]Norio Nakajima, “Murata Introduces Bulk Case Packaging to Replace T&R, Improving MLCC Supply Chain Efficiency,” Murata Manufacturing Co., Ltd., "corporate.murata.com The system raised packing density to 500,000 units per case from 20,000 units per reel. This change can reduce logistics and material use as demand for miniature parts increases.
By Voltage Rating: Low Voltage Retains Scale While Mid Voltage Gains Designs
Low-voltage products below 500 V held 59.34% of revenue in 2025. They serve smartphones, consumer products, and industrial control boards that operate on 3.3 V to 48 V rails. This installed base gives low-voltage products a broad and stable demand foundation. Mid-voltage products from 500-1,000 V are projected to expand at a 15.46% CAGR through 2031. They are used in 48 V automotive buses, server intermediate-bus converters, and solar-linked inverter designs. These applications sit between conventional low-voltage circuits and high-voltage EV inverters. The multilayer ceramic capacitor (MLCC) market provides a design opportunity for suppliers that can qualify mid-voltage products for automotive use while maintaining compact case sizes.
High-voltage products above 1,000 V are important in automotive powertrain circuits. Samsung Electro-Mechanics and Murata expanded 1,000-1,500 V product lines for 800 V inverter and onboard-charger designs. High-voltage circuits require components that can withstand repeated electrical and thermal stress. Research in Nature Communications reported a lead-free Bi₀.₅Na₀.₅TiO₃ (BNT)-based multilayer capacitor with high recoverable energy density in 2025. Such materials could reduce the number of capacitors needed in some inverter stages. The RoHS Directive continues to direct qualification work toward lead-free dielectrics. The multilayer ceramic capacitor (MLCC) market will rely on careful materials development as voltage requirements become more demanding.
By Mounting Type: Surface-Mount Leads While Metal-Cap Serves High Power
Surface-mount MLCCs held 41.71% of revenue in 2025. The format supports automated assembly across consumer, industrial, and communications circuit boards. Its revenue share understates its importance in unit volumes because many high-volume applications use surface-mount products exclusively. Metal-cap MLCCs are projected to expand at a 15.67% CAGR through 2031. They are used in high-voltage automotive and power-electronics applications that need strong mechanical performance. The form factor can provide a lower-inductance current path than some surface-mount alternatives. The multilayer ceramic capacitor (MLCC) market serves these applications where vibration, heat, and voltage transients can affect component reliability.
Metal-cap products are increasingly specified for 800 V EV DC-link filter assemblies. These parts must withstand kilovolt-level transients and repeated thermal cycling. Radial-lead MLCCs remain relevant in selected industrial, medical, and aerospace circuit boards. Their use is declining in new designs as manufacturers seek to reduce board area through surface mounting. Murata introduced a 2.2 µF, 100 Vdc soft-termination chip MLCC in the 0805 package in June 2026. It reduced mounting area by 51% compared with 1206 solutions while addressing flex-cracking concerns.[6]Norio Nakajima, “Murata Introduces World’s First 2.2μF/100Vdc Soft-Termination Chip MLCC in 0805-inch Size for Automotive Applications,” Murata Manufacturing Co., Ltd., "corporate.murata.com This product shows that surface-mount designs can serve more demanding automotive power applications. The multilayer ceramic capacitor (MLCC) industry is consequently extending the range of applications served by compact components.
By End-Use Application: Consumer Electronics Holds Revenue While Automotive Grows Fastest
Consumer electronics held 51.46% of revenue in 2025. Smartphones, true wireless stereo earbuds, tablets, and other portable devices continue to require dense power management. New processor designs increase the number of power rails that need local decoupling. Automotive is projected to expand at a 19.63% CAGR through 2031. Electric vehicles use 10,000-18,000 MLCCs across power and control functions. Advanced driver-assistance systems also need low-inductance decoupling in redundant power domains. The multilayer ceramic capacitor (MLCC) market is shifting toward automotive uses because vehicle electronics require more components per unit than many consumer products.
Industrial applications support demand through smart factories, servo drives, and edge-computing systems. These environments can expose components to higher temperatures and vibration. Telecommunications applications benefit from 5G radio densification and data-center power distribution. Medical devices offer high value per unit because equipment makers seek tight tolerances and long-term electrical stability. Power and utilities applications include smart-grid inverters and advanced metering systems. Aerospace and defense volumes remain limited, but strict qualification standards support premium pricing. The multilayer ceramic capacitor (MLCC) market has a wide end-use base, which reduces reliance on a single device category. It also requires suppliers to maintain different qualification, packaging, and reliability approaches across applications.
Geography Analysis
Asia-Pacific held 57.69% of the multilayer ceramic capacitor (MLCC) market share in 2025. The region combines materials supply, component manufacturing, and electronic-device assembly. China is the largest country market in the region and accounted for more than 40% of global MLCC consumption. Its demand comes from electric vehicles, AI-server assembly, and consumer-electronics production. Japan produces 54% of global MLCC revenue by manufacturer origin. Murata Manufacturing, Taiyo Yuden, TDK, and Kyocera AVX support this position through their expertise in ceramic powder preparation and nickel-electrode processing.
South Korea has an important role in AI-server components through Samsung Electro-Mechanics. Its proximity to semiconductor and mobile-device ecosystems can shorten product-development cycles. India is becoming a production location as companies seek non-China sources. Murata’s Chennai facility entered volume production in 2025 and served smartphone, EV, and industrial-machine manufacturers.[7]BL Chennai Bureau, "iPhone component maker Murata inaugurates Chennai plant to produce multilayer ceramic capacitors, " Businessline, thehindubusinessline.com Production-linked incentives support the conditions for future additions in India. The multilayer ceramic capacitor (MLCC) market in Asia-Pacific will remain central because the region has both component demand and manufacturing capability.
North America is projected to expand at a 16.07% CAGR through 2031. Semiconductor investment, localized EV powertrains, and data-center construction support this growth. New high-Q and small-format production lines in Texas and Arizona reached early production in 2026. Canada can support regional supply planning through nickel availability. Europe remains important because German vehicle manufacturers and their suppliers need qualified automotive components. Eastern Europe is also attracting assembly and testing investment, while South America, the Middle East, and Africa contribute smaller import-led volumes linked to data-center and EV infrastructure spending.

Competitive Landscape
The multilayer ceramic capacitor (MLCC) market is concentrated in premium products and more fragmented in standard commodity products. Murata Manufacturing, Samsung Electro-Mechanics, Taiyo Yuden, TDK, and Kyocera AVX collectively held almost two-third of revenue by 2024 manufacturer metrics. Murata held 31.8% global revenue share and had a leading position in high-capacitance AI-server components. Its capacity to manufacture dielectric layers below 0.6 µm supports a strong position in specialized applications. Samsung Electro-Mechanics held the second overall position and used long-term customer agreements to secure demand in AI-server products.
Samsung Electro-Mechanics announced a KRW 295.1 billion, USD 213.8 million, MLCC supply contract for AI-server and data-center systems in July 2026. The contract covered January 1, 2027, through December 31, 2027, with an undisclosed global customer. The company also announced KRW 23 trillion, USD 16.67 billion, of investment in Sejong and Busan facilities through 2040. These moves support high-value MLCC production and package-substrate capacity for AI-server uses. Murata began mass production of 7 automotive MLCC products in April 2026. Taiyo Yuden commercialized a 220 µF AEC-Q200-qualified MLCC in June 2026 for automotive applications. The multilayer ceramic capacitor (MLCC) market rewards these product launches because automotive and AI buyers need qualified, high-capacitance components.
Yageo held 25% of global commodity MLCC capacity. It can benefit when Japanese and Korean suppliers allocate more production to higher-end components. Chinese suppliers, including Fenghua Advanced Technology and Three-Circle Group, held 10% of global revenue and increased their presence in mid-tier X5R products. Their automotive-grade localization rate remained below 5%, which limited near-term gains in the fastest-growing end use. Samsung Electro-Mechanics also finalized plans for an MLCC-embedded semiconductor-substrate line in Vietnam in April 2026. The move targets a packaging layer that connects MLCC design more closely with semiconductor products. The multilayer ceramic capacitor (MLCC) market will remain defined by the different capabilities required for standard parts, automotive qualification, and advanced packaging.
Multilayer Ceramic Capacitor (MLCC) Industry Leaders
-
Murata Manufacturing Co., Ltd.
-
Samsung Electro-Mechanics Co., Ltd.
-
Taiyo Yuden Co., Ltd.
-
Yageo Corporation
-
TDK Corporation
- *Disclaimer: Major Players sorted in no particular order

Recent Industry Developments
- July 2026: Samsung Electro-Mechanics announced a KRW 295.1 billion, USD 213.8 million, MLCC supply contract for AI server and data-center systems, valid from January 1, 2027, to December 31, 2027, with a major undisclosed global client. The deal brought the company’s cumulative AI server component long-term agreements to KRW 2.3 trillion, USD 1.67 billion.
- July 2026: Samsung Electro-Mechanics announced a total investment of KRW 23 trillion, USD 16.67 billion, across its Sejong and Busan domestic manufacturing facilities through 2040. The investment established high-value MLCC mother lines and advanced package-substrate capacity for AI server applications.
- June 2026: Murata Manufacturing introduced the GCJ21BD72A225KE02, a 2.2 µF, 100 Vdc soft-termination chip MLCC in the 0805 size. The product reduced board mounting area by 51% compared with prior 1206 solutions.
- May 2026: Taiyo Yuden commercialized the MAASA32MAD7227MP1D71, a 220 µF AEC-Q200-qualified MLCC in the 3225 size, at its Tamamura Plant. The product more than doubled the capacitance of the company’s prior 100 µF offering in the same package footprint.
- April 2026: Murata Manufacturing began mass production of 7 AEC-Q200-qualified MLCCs for automotive applications. The products covered 2.5-4 Vdc circuits for advanced driver-assistance systems and 25 Vdc in-vehicle power lines.


Global Multilayer Ceramic Capacitor (MLCC) Market Report Scope
The Multilayer Ceramic Capacitor (MLCC) Market Report is Segmented by Dielectric Type (Class 1, and Class 2), Case Size (0201, 0402, 0603, 1005, 1210, and Other Case Sizes), Voltage Rating (Low Voltage, Mid Voltage, and High Voltage), Mounting Type (Surface-Mount, Metal-Cap, and Radial-Lead), End-Use Application (Aerospace and Defense, Automotive, Consumer Electronics, Industrial, Medical Devices, Power and Utilities, Telecommunications, and Other End-Use Applications), and Geography (North America, Europe, Asia-Pacific, and Rest of the World). The Market Forecasts are Provided in Terms of Value (USD).
| Class 1 |
| Class 2 |
| 0201 |
| 0402 |
| 0603 |
| 1005 |
| 1210 |
| Other Case Sizes |
| Low Voltage (Less than 500 V) |
| Mid Voltage (500 - 1000 V) |
| High Voltage (Above 1000 V) |
| Surface-Mount |
| Metal-Cap |
| Radial-Lead |
| Aerospace and Defense |
| Automotive |
| Consumer Electronics |
| Industrial |
| Medical Devices |
| Power and Utilities |
| Telecommunications |
| Rest of End-Use Applications |
| North America | United States |
| Rest of North America | |
| Europe | Germany |
| Rest of Europe | |
| Asia-Pacific | China |
| Japan | |
| South Korea | |
| India | |
| Rest of Asia-Pacific | |
| Rest of the World |
| By Dielectric Type | Class 1 | |
| Class 2 | ||
| By Case Size | 0201 | |
| 0402 | ||
| 0603 | ||
| 1005 | ||
| 1210 | ||
| Other Case Sizes | ||
| By Voltage Rating | Low Voltage (Less than 500 V) | |
| Mid Voltage (500 - 1000 V) | ||
| High Voltage (Above 1000 V) | ||
| By Mounting Type | Surface-Mount | |
| Metal-Cap | ||
| Radial-Lead | ||
| By End-Use Application | Aerospace and Defense | |
| Automotive | ||
| Consumer Electronics | ||
| Industrial | ||
| Medical Devices | ||
| Power and Utilities | ||
| Telecommunications | ||
| Rest of End-Use Applications | ||
| By Geography | North America | United States |
| Rest of North America | ||
| Europe | Germany | |
| Rest of Europe | ||
| Asia-Pacific | China | |
| Japan | ||
| South Korea | ||
| India | ||
| Rest of Asia-Pacific | ||
| Rest of the World | ||


Market Definition
- MLCC (Multilayer Ceramic Capacitor) - A type of capacitor that consists of multiple layers of ceramic material, alternating with conductive layers, used for energy storage and filtering in electronic circuits.
- Voltage - The maximum voltage that a capacitor can safely withstand without experiencing breakdown or failure. It is typically expressed in volts (V)
- Capacitance - The measure of a capacitor's ability to store electrical charge, expressed in farads (F). It determines the amount of energy that can be stored in the capacitor
- Case Size - The physical dimensions of an MLCC, typically expressed in codes or millimeters, indicating its length, width, and height
| Keyword | Definition |
|---|---|
| MLCC (Multilayer Ceramic Capacitor) | A type of capacitor that consists of multiple layers of ceramic material, alternating with conductive layers, used for energy storage and filtering in electronic circuits. |
| Capacitance | The measure of a capacitor's ability to store electrical charge, expressed in farads (F). It determines the amount of energy that can be stored in the capacitor |
| Voltage Rating | The maximum voltage that a capacitor can safely withstand without experiencing breakdown or failure. It is typically expressed in volts (V) |
| ESR (Equivalent Series Resistance) | The total resistance of a capacitor, including its internal resistance and parasitic resistances. It affects the capacitor's ability to filter high-frequency noise and maintain stability in a circuit. |
| Dielectric Material | The insulating material used between the conductive layers of a capacitor. In MLCCs, commonly used dielectric materials include ceramic materials like barium titanate and ferroelectric materials |
| SMT (Surface Mount Technology) | A method of electronic component assembly that involves mounting components directly onto the surface of a printed circuit board (PCB) instead of through-hole mounting. |
| Solderability | The ability of a component, such as an MLCC, to form a reliable and durable solder joint when subjected to soldering processes. Good solderability is crucial for proper assembly and functionality of MLCCs on PCBs. |
| RoHS (Restriction of Hazardous Substances) | A directive that restricts the use of certain hazardous materials, such as lead, mercury, and cadmium, in electrical and electronic equipment. Compliance with RoHS is essential for automotive MLCCs due to environmental regulations |
| Case Size | The physical dimensions of an MLCC, typically expressed in codes or millimeters, indicating its length, width, and height |
| Flex Cracking | A phenomenon where MLCCs can develop cracks or fractures due to mechanical stress caused by bending or flexing of the PCB. Flex cracking can lead to electrical failures and should be avoided during PCB assembly and handling. |
| Aging | MLCCs can experience changes in their electrical properties over time due to factors like temperature, humidity, and applied voltage. Aging refers to the gradual alteration of MLCC characteristics, which can impact the performance of electronic circuits. |
| ASPs (Average Selling Prices) | The average price at which MLCCs are sold in the market, expressed in USD million. It reflects the average price per unit |
| Voltage | The electrical potential difference across an MLCC, often categorized into low-range voltage, mid-range voltage, and high-range voltage, indicating different voltage levels |
| MLCC RoHS Compliance | Compliance with the Restriction of Hazardous Substances (RoHS) directive, which restricts the use of certain hazardous substances, such as lead, mercury, cadmium, and others, in the manufacturing of MLCCs, promoting environmental protection and safety |
| Mounting Type | The method used to attach MLCCs to a circuit board, such as surface mount, metal cap, and radial lead, which indicates the different mounting configurations |
| Dielectric Type | The type of dielectric material used in MLCCs, often categorized into Class 1 and Class 2, representing different dielectric characteristics and performance |
| Low-Range Voltage | MLCCs designed for applications that require lower voltage levels, typically in the low voltage range |
| Mid-Range Voltage | MLCCs designed for applications that require moderate voltage levels, typically in the middle range of voltage requirements |
| High-Range Voltage | MLCCs designed for applications that require higher voltage levels, typically in the high voltage range |
| Low-Range Capacitance | MLCCs with lower capacitance values, suitable for applications that require smaller energy storage |
| Mid-Range Capacitance | MLCCs with moderate capacitance values, suitable for applications that require intermediate energy storage |
| High-Range Capacitance | MLCCs with higher capacitance values, suitable for applications that require larger energy storage |
| Surface Mount | MLCCs designed for direct surface mounting onto a printed circuit board (PCB), allowing for efficient space utilization and automated assembly |
| Class 1 Dielectric | MLCCs with Class 1 dielectric material, characterized by a high level of stability, low dissipation factor, and low capacitance change over temperature. They are suitable for applications requiring precise capacitance values and stability |
| Class 2 Dielectric | MLCCs with Class 2 dielectric material, characterized by a high capacitance value, high volumetric efficiency, and moderate stability. They are suitable for applications that require higher capacitance values and are less sensitive to capacitance changes over temperature |
| RF (Radio Frequency) | It refers to the range of electromagnetic frequencies used in wireless communication and other applications, typically from 3 kHz to 300 GHz, enabling the transmission and reception of radio signals for various wireless devices and systems. |
| Metal Cap | A protective metal cover used in certain MLCCs (Multilayer Ceramic Capacitors) to enhance durability and shield against external factors like moisture and mechanical stress |
| Radial Lead | A terminal configuration in specific MLCCs where electrical leads extend radially from the ceramic body, facilitating easy insertion and soldering in through-hole mounting applications. |
| Temperature Stability | The ability of MLCCs to maintain their capacitance values and performance characteristics across a range of temperatures, ensuring reliable operation in varying environmental conditions. |
| Low ESR (Equivalent Series Resistance) | MLCCs with low ESR values have minimal resistance to the flow of AC signals, allowing for efficient energy transfer and reduced power losses in high-frequency applications. |


Research Methodology
Mordor Intelligence has followed the following methodology in all our MLCC reports.
- Step 1: Identify Data Points: In this step, we identified key data points crucial for comprehending the MLCC market. This included historical and current production figures, as well as critical device metrics such as attachment rate, sales, production volume, and average selling price. Additionally, we estimated future production volumes and attachment rates for MLCCs in each device category. Lead times were also determined, aiding in forecasting market dynamics by understanding the time required for production and delivery, thereby enhancing the accuracy of our projections.
- Step 2: Identify Key Variables: In this step, we focused on identifying crucial variables essential for constructing a robust forecasting model for the MLCC market. These variables include lead times, trends in raw material prices used in MLCC manufacturing, automotive sales data, consumer electronics sales figures, and electric vehicle (EV) sales statistics. Through an iterative process, we determined the necessary variables for accurate market forecasting and proceeded to develop the forecasting model based on these identified variables.
- Step 3: Build a Market Model: In this step, we utilized production data and key industry trend variables, such as average pricing, attachment rate, and forecasted production data, to construct a comprehensive market estimation model. By integrating these critical variables, we developed a robust framework for accurately forecasting market trends and dynamics, thereby facilitating informed decision-making within the MLCC market landscape.
- Step 4: Validate and Finalize: In this crucial step, all market numbers and variables derived through an internal mathematical model were validated through an extensive network of primary research experts from all the markets studied. The respondents are selected across levels and functions to generate a holistic picture of the market studied.
- Step 5: Research Outputs: Syndicated Reports, Custom Consulting Assignments, Databases, and Subscription Platform


