Canada Hyperscale Data Center Market Size and Share
Market Overview
| Study Period | 2020 - 2031 |
|---|---|
| Forecast Data Period | 2025 - 2031 |
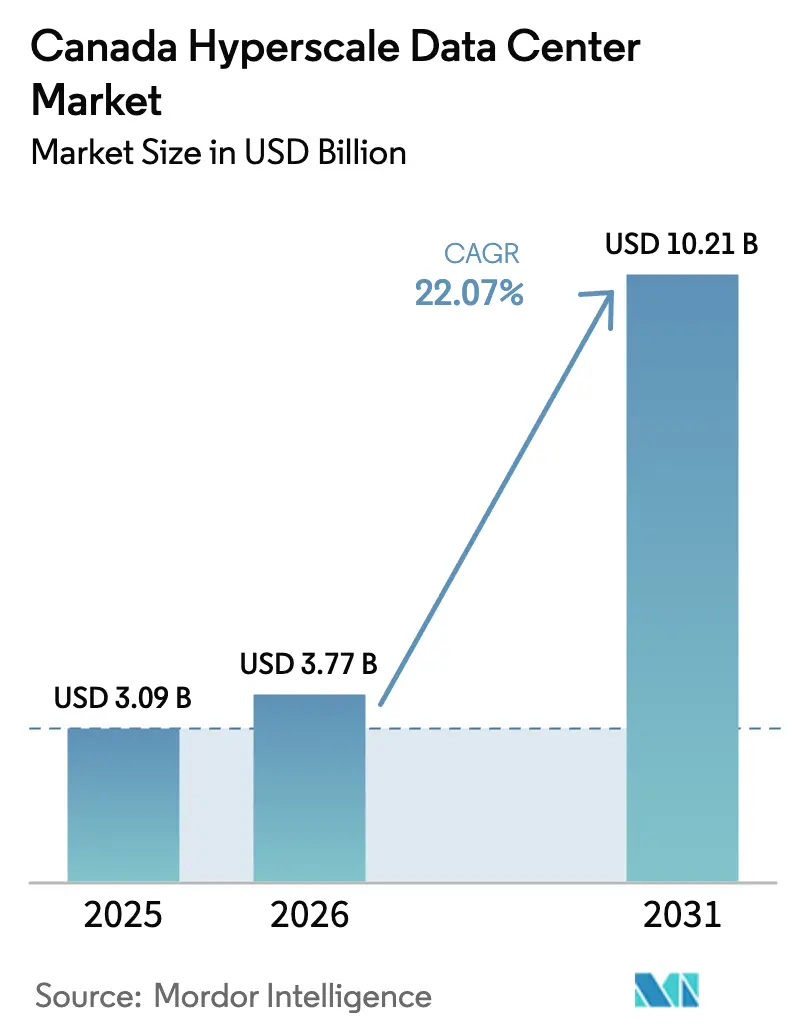
| Base Year Market Size (2025) | USD 3.09 Billion |
| Market Size (2026) | USD 3.77 Billion |
| Market Size (2031) | USD 10.21 Billion |
| Growth Rate (2025 - 2030) | 22.07% CAGR |
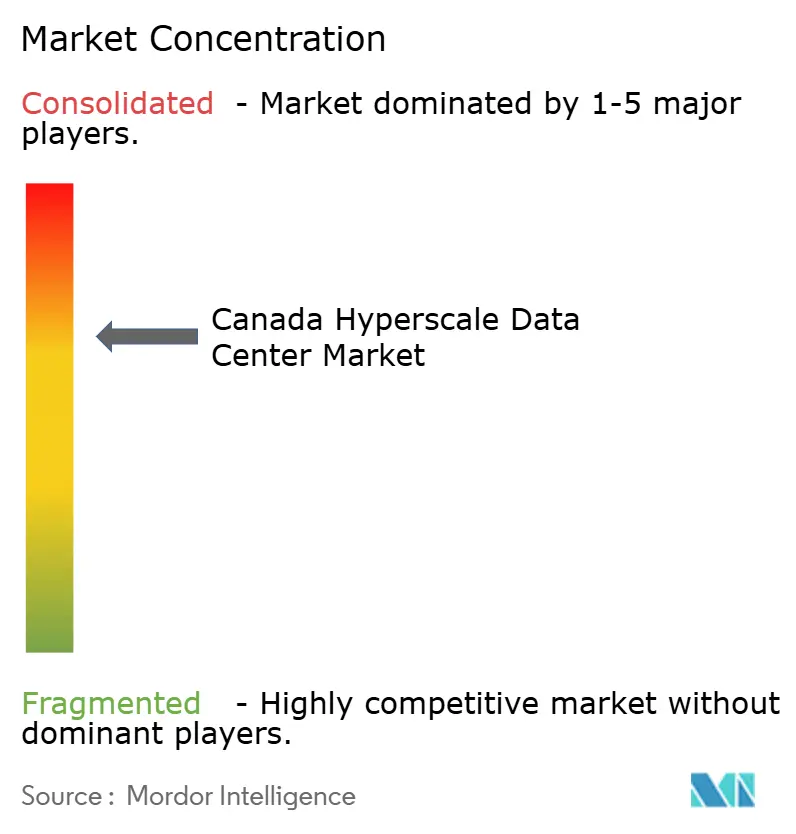
| Market Concentration | Medium |
Major Players *Disclaimer: Major Players sorted in no particular order Image © Mordor Intelligence. Reuse requires attribution under CC BY 4.0. | |
Canada Hyperscale Data Center Market Analysis by Mordor Intelligence
The Canada hyperscale data center market size is expected to increase from USD 3.09 billion in 2025 to USD 3.77 billion in 2026 and reach USD 10.21 billion by 2031, growing at a CAGR of 22.07% over 2026-2031. Rapid capital deployment by U.S. cloud providers, sustained provincial green-energy incentives, and densifying GPU-based workloads are reinforcing Canada’s position as the preferred low-carbon expansion node for North American compute. Self-build deployments still dominate capacity, yet accelerating colocation demand signals a structural pivot toward asset-light growth strategies. Mechanical-infrastructure upgrades designed for racks above 50 kilowatts are pulling thermal-management spending forward, while Tier IV certifications are gaining currency as AI training costs magnify the penalty of downtime. Across provinces, Quebec and Ontario anchor scale footprints, Alberta delivers fastest incremental build activity, and British Columbia captures specialized, renewables-backed projects.
Key Report Takeaways
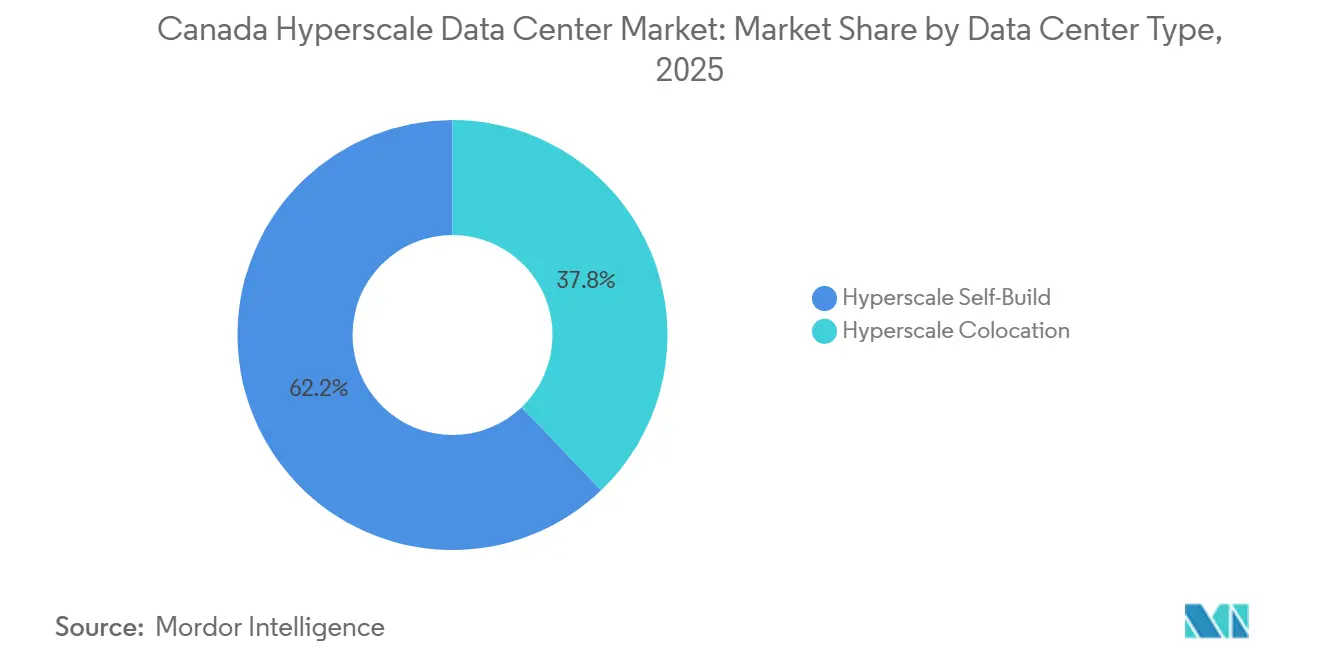
- By data center type, hyperscale self-build deployments held 62.16% of share in 2025, whereas hyperscale colocation is forecast to expand at a 23.54% CAGR through 2031.
- By component, IT infrastructure commanded 42.28% of the Canada hyperscale data center market size in 2025, while mechanical infrastructure is projected to grow at a 23.63% CAGR between 2026-2031.
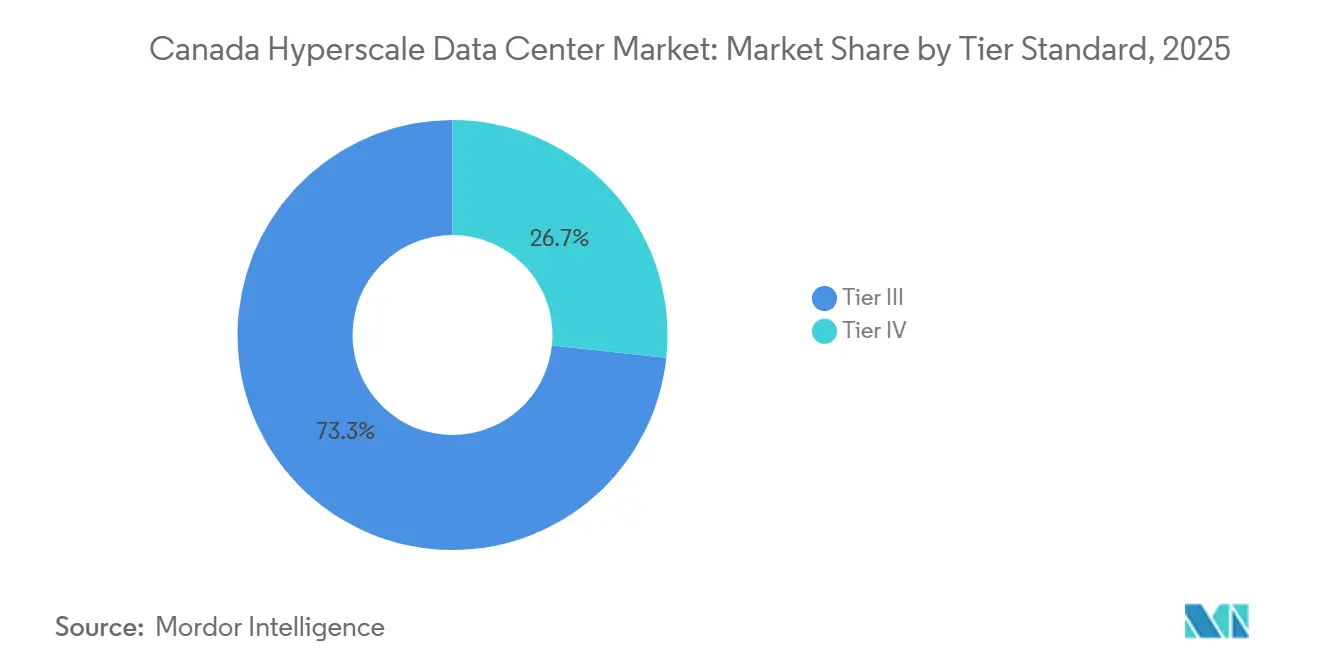
- By tier, Tier III installations led with 73.32% of the Canada hyperscale data center market share in 2025, yet Tier IV capacity is advancing at a 23.72% CAGR to 2031.
- By facility size, massive-scale sites between 25 MW and 60 MW captured 41.42% of the Canada hyperscale data center market size in 2025, whereas mega-scale campuses above 60 MW are set to expand at a 23.89% CAGR over 2026-2031.
Note: Market size and forecast figures in this report are generated using Mordor Intelligence’s proprietary estimation framework, updated with the latest available data and insights as of January 2026.
Proportional positioning is established by comparing country level and regional contributions against the global total, including that of Canada. The hyperscale data center market share in our global report expresses these relative weights.
Canada Hyperscale Data Center Market Trends and Insights
Drivers Impact Analysis*
| DRIVER | (~) % IMPACT ON CAGR FORECAST | GEOGRAPHIC RELEVANCE | IMPACT TIMELINE |
|---|---|---|---|
| Soaring Cloud-AI Training Clusters with Racks Exceeding 50 kW in Montreal and Calgary | +5.2% | Quebec and Alberta, spillover to Ontario | Medium term (2-4 years) |
| Rapid Build-to-Suit Demand From U.S. Hyperscalers Seeking Low-Carbon Grid Access | +4.8% | National, concentrated in Quebec, Ontario, Alberta | Short term (≤ 2 years) |
| Government Green-Energy Incentives (Hydro-Québec, Alberta Renewables PPAs) | +3.9% | Quebec and Alberta, emerging in British Columbia | Medium term (2-4 years) |
| Record CDN-Streaming and Gaming Traffic Densifying Toronto Edge Nodes | +3.1% | Ontario (GTA), secondary hubs in Montreal and Vancouver | Short term (≤ 2 years) |
| GenAI Inference Campuses Adopting Liquid or Immersion Cooling | +2.7% | National, early adoption in Montreal, Calgary, Toronto | Medium term (2-4 years) |
| First-Mover SMR-Powered Data-Center Pilots at Nuclear Sites | +1.5% | Ontario, Alberta, exploratory in Saskatchewan | Long term (≥ 4 years) |
| Source: Mordor Intelligence | |||
Soaring Cloud-AI Training Clusters with Racks Exceeding 50 Kilowatts
GPU-dense nodes are reshaping site layouts in Montreal and Calgary as rack power climbs to triple traditional levels. At eStruxture’s CAL-3 campus, racks reach 125 kW and rely on direct-to-chip liquid cooling to maintain a PUE near 1.1.[1]eStruxture Data Centers, “CAL-3 Calgary Data Center,” ESTRUXTURE.COM Provincial data-sovereignty rules drive enterprises to keep sensitive AI training workloads inside Canada, accelerating demand for sovereign GPU clusters at scale. Forward-buying of transformers and switchgear has become mandatory as global supply tightens, pulling cash flows forward for operators able to pre-secure long-lead equipment. The resulting capex rush increases bargaining power for contractors that possess immersion-cooling and high-pressure plumbing expertise, further lengthening bidding cycles.
Rapid Build-to-Suit Demand from U.S. Hyperscalers Seeking Low-Carbon Grid Access
Microsoft allocated CAD 7.5 billion (USD 5.4 billion) to expand Azure’s Canada Central and Canada East regions, citing Quebec’s 99% hydro grid and sub-10 ms latency to Northeast U.S. metros. Meta’s partnership with Pembina Pipeline and Kineticor embeds an AI compute campus inside Alberta transmission corridors, bypassing lengthy interconnect queues. Direct land purchases, carve-out tax abatements, and 20-year power purchase commitments compress development timelines versus U.S. locations where renewable-certificate scarcity inflates project risk. Cloud providers also lock guaranteed fiber routes to New York and Chicago, ensuring symmetrical latency across border crossings.
Government Green-Energy Incentives Including Hydro-Québec and Alberta PPAs
Hydro-Québec’s 2025 framework offers locked-in industrial tariffs below CAD 0.05 per kWh (USD 0.036 per kWh) to operators that commit to 20-year flexible load profiles.[2]Hydro-Québec, “Data Center Power Agreements Framework,” HYDROQUEBEC.COM Alberta’s Independent System Operator facilitates merchant PPAs that let developers hedge volatile pool prices while claiming zero-scope-2 electrons for ESG disclosures. British Columbia’s Clean Energy for Industry rebates copy the formula but face grid-capacity competition from LNG export terminals, a constraint that delays hyperscale final-investment decisions in the Lower Mainland. Altogether, incentive packages shave up to 9% from lifetime opex, tipping project NPV strongly in favor of Canada over peer U.S. markets.
Record CDN Streaming and Gaming Traffic Densifying Toronto Edge Nodes
Netflix added Open Connect cache appliances across Toronto carrier hotels, cutting upstream transit costs for local ISPs and unlocking 4K streaming without buffering. Cloud gaming platforms such as NVIDIA GeForce Now require round-trip latency under 20 ms to deliver lowest input lag, a threshold only attainable via metro-edge nodes. As a result, Equinix, Digital Realty and Cologix race to retrofit older halls with additional meet-me rooms and 400 Gbps cross connects, monetizing port density over square footage. The densification trend also drives shorter lease terms as content providers iterate edge footprints alongside subscriber load patterns.
Restraints Impact Analysis*
| Restraint | (~) % Impact on CAGR Forecast | Geographic Relevance | Impact Timeline |
|---|---|---|---|
| Lengthy Power-Interconnect Permitting (>24 Months) | -3.2% | Ontario, British Columbia, moderate in Alberta | Short term (≤ 2 years) |
| Acute Skilled-Labor Shortages for Large-Scale MEP Builds | -2.1% | National, severe in GTA and Vancouver | Medium term (2-4 years) |
| Proposed Federal Clean-Electricity Regulations Raising Cap-Ex | -1.8% | National, higher in Alberta coal-to-gas regions | Medium term (2-4 years) |
| Provincial Water-Use Moratoria Affecting Evaporative Cooling | -1.3% | Quebec, Ontario, emerging in Alberta | Short term (≤ 2 years) |
| Source: Mordor Intelligence | |||
Lengthy Power-Interconnect Permitting Exceeding 24 Months
Ontario’s Hydro One warns new 50 MW connections face 18-36 month wait times as substation upgrades queue behind electrified transit and housing mega-projects.[3]Hydro One, “Large User Connection Timelines,” HYDROONE.COM BC Hydro flags similar congestion in the Lower Mainland, with data center requests competing against mining electrification and EV charging corridors. Developers unable to secure firm power defer construction or split builds into 10-MW slices that fly under expedited-review thresholds, stretching ROI horizons and constraining near-term capacity growth.
Acute Skilled-Labor Shortages for Large-Scale Mechanical-Electrical-Plumbing Builds
BuildForce Canada projects an 80,000-person skilled-trades gap by 2027, with pronounced shortages in high-voltage electricians, HVAC commission engineers, and liquid-cooling technicians. Vantage Data Centers disclosed a six-month slip at its QC24 Quebec City site due to a scarcity of HVAC subcontractors, illustrating how labor bottlenecks can erode first-mover advantage. Wage inflation above 8% annually forces contractors to rebid scopes mid-project, inflating budgets and complicating lender drawdowns.
*Our forecasts treat driver/restraint impacts as directional, not additive. The impact forecasts reflect baseline growth, mix effects, and variable interactions.
Segment Analysis
By Data Center Type: Self-Build Strength Meets Rising Colocation Appeal
Self-build facilities dominated the Canada hyperscale data center market with a 62.16% share in 2025, yet hyperscale colocation is racing ahead with a 23.54% CAGR to 2031. Cologix’s USD 1.5 billion capital raise targets liquid-ready expansions in Toronto, Montreal, and Vancouver, underscoring investor faith in third-party models. Equinix’s earlier purchase of 13 Bell Canada sites seeded a 25-facility footprint that blends enterprise colocation with wholesale hyperscale leases. Sale-leaseback transactions now blur ownership lines, allowing cloud providers to monetize stabilized assets while retaining operational control.
Over time, power-shell agreements become common, with landlords financing the core and shell while tenants install proprietary cooling and security systems. This hybrid approach optimizes capital allocation, shrinking time-to-market for the Canada hyperscale data center market and satisfying board-level return hurdles. Meanwhile, self-build mega-campuses remain indispensable for sovereign-cloud mandates that require end-to-end control over data flows and risk domains, particularly for financial services and healthcare workloads.


By Component: Thermal Engineering Drives Mechanical Infrastructure Boom
IT infrastructure commanded 42.28% of the market share in 2025. However, Mechanical systems are expanding at a 23.63% CAGR, the fastest within the Canada hyperscale data center market. Vertiv’s liquid-cooling skids installed at eStruxture’s CAL-3 campus circulate chilled water directly across GPU modules, holding inlet temperatures below 30 °C even at 125 kW per rack. GRC’s immersion baths deliver PUEs below 1.05 while capturing waste heat for district-energy loops in Quebec eco-districts. Electrical infrastructure growth moderates as modular UPS blocks enable just-in-time power provisioning, helping operators sidestep stranded-capacity write-downs.
General construction spends pivot toward taller halls with reinforced slabs that host immersion tanks and overhead busways. STACK Infrastructure’s prefab modules, assembled in controlled factories, shave six months from field schedules while mitigating skilled-labor shortages. Network-infrastructure budgets swell as 400 Gbps and 800 Gbps Ethernet fabrics connect multi-site AI clusters, ensuring synchronous GPU training across provinces.
By Tier Standard: Fault Tolerance Becomes A Revenue Catalyst
Tier III sites accounted for 73.32% of share in 2025, yet Tier IV footprints are set to post a 23.72% CAGR, outpacing overall Canada hyperscale data center market growth. Uptime Institute’s 2025 survey shows 68% of Canadian operators reporting at least one outage in the prior year, renewing interest in 2N+1 architectures. Schneider Electric’s EcoStruxure analytics suite predicts component failures and dynamically rebalances load, letting some Tier III halls approach Tier IV SLA levels without full redundancy costs.
Nonetheless, mission-critical AI model training commands premiums for fully certified Tier IV halls, locking in higher lease rates and multi-year commitments. Tier II remains relegated to edge micro-sites compliant with relaxed service-level agreements, while Tier I installations disappear from hyperscale RFPs altogether. Certification marketing now appears in tenant RFP scorecards, translating technical reliability into commercial advantage for early adopters.
By Data Center Size: Mega-Scale Campuses Anchor Long-Term Expansion
Facilities above 60 MW register the fastest expansion at 23.89%, aligning with hyperscalers’ preference to consolidate GPU clusters. Vantage’s 30 MW QC61 hall went live in January 2026, but the surrounding Montreal site can scale beyond 120 MW under existing zoning. Massive-scale (25-60 MW) sites still captured 41.42% of 2025 outlays, favored in metros where land and transmission headroom limit mega-campus feasibility. Digital Realty’s land-constrained TOR1 expansion in Vaughan illustrates how urban edge demands co-exist with rural mega-builds.
Large-scale ( less than 25 MW) facilities grow slowly but are essential for distributed render farms, gaming edges, and compliance-heavy workloads requiring proximity to city centers. Developers increasingly adopt land-banking strategies, securing 40-acre parcels near 230 kV lines years before energization. This approach ensures future phases can scale up to 200 MW without relocating transformers.
Geography Analysis
Quebec leads the Canada hyperscale data center market thanks to a 99% renewable grid and locked-in industrial power near USD 0.036 per kWh, drawing multi-megawatt pre-leases from AI labs chasing low-carbon credentials. Cologix’s 21 MW LEED-Gold MTL8 hall adds GPU-as-a-service capacity tied into the Montréal Internet Exchange, supporting cross-border data replication with sub-10 ms latency. Quebec City’s QC24 campus embeds heat-recovery loops that feed municipal district-energy grids, further lowering net emissions claims.
Ontario places second by megawatts but first in enterprise colocation demand. Cologix’s full take-over of TOR4 and TOR5 adds 14 MW of new capacity directly connected to Canada’s largest carrier hotel ecosystem. However, Hydro One’s congested interconnect queues and carbon intensity roughly 15-times higher than Quebec’s hydro grid temper new hyperscale announcements. Consequently, Microsoft balances its Azure Canada Central investments with equivalent capacity in Quebec, hedging both grid-carbon and timeline risk.
Alberta emerges as the fastest-growing province, leveraging deregulated electricity auctions and abundant wind-solar PPAs. Meta’s Edmonton AI campus embeds compute adjacent to pipeline rights-of-way, reducing transmission buildout and enabling direct renewable offtake contracts. eStruxture’s 90 MW CAL-3 complex in Calgary flaunts rack densities topping 125 kW, capitalizing on cheaper industrial land and proximity to gas-peaking plants that firm renewable power. British Columbia and prairie provinces capture opportunistic builds tied to university super-computing or mining digital-twins, but grid-capacity competition with LNG and metals refining constrains headline megawatt additions.
Competitive Landscape
The Canada hyperscale data center market hosts a moderately concentrated field where four U.S. cloud majors run captive capacity while colocation specialists monetize interconnection density. Cologix’s USD 1.5 billion fundraising illustrates capital inflows backing carrier-neutral growth. Digital Realty’s metro Toronto assets maintain >200 network partners, reinforcing its appeal to fintech tenants requiring diversified peering. CoreWeave and QScale attack the GPU-as-a-service niche, pairing liquid cooling with per-node rental models that sidestep hyperscaler GPU supply constraints.
Technology adoption drives competitive gaps. Schneider Electric’s AI-enabled DCIM forecasts power train anomalies up to 48 hours ahead, cutting unplanned downtime by 30%. ARC Clean Technology’s small modular reactor pilot with Deep Atomic positions nuclear-powered compute as a future differentiator once federal clean-electricity rules crystallize. Certification strategy matters: fewer than 15% of domestic halls hold Tier IV stamps, so operators that secure them early wield pricing leverage in the Canada hyperscale data center market.
Global debt markets remain open; Vantage raised USD 13 billion in 2024 alone, pre-funding Canadian mega-campus inventory. That liquidity accelerates speculative shells, shrinking bid windows for tenants and pressuring smaller independents to pursue strategic exits or niche specialization. Overall, scale, interconnection richness and energy-procurement creativity decide share shifts over the forecast window.
Canada Hyperscale Data Center Industry Leaders
Amazon Web Services, Inc. (AWS)
Microsoft Corporation
Alphabet Inc. (Google)
Digital Realty Trust Inc.
Cologix Inc.
- *Disclaimer: Major Players sorted in no particular order

Recent Industry Developments
- January 2026: Vantage Data Centers completed the 30 MW QC61 Montreal campus featuring dual utility feeds and N+1 cooling redundancy.
- December 2025: Microsoft committed CAD 7.5 billion (USD 5.4 billion) to expand Azure Canada Central and Canada East regions, with capacity online by H2 2026.
- October 2025: Meta, Pembina Pipeline and Kineticor agreed to co-develop an AI-optimized data center in Edmonton’s Industrial Heartland.
- October 2025: Cologix acquired a Calgary carrier hotel, adding a key Western Canada interconnection node.


Research Methodology Framework and Report Scope
Market Definitions and Key Coverage
Our study defines the Canadian hyperscale data-center market as revenue generated inside purpose-built or leased halls that individually exceed 25 MW of critical IT load and host thousands of servers for cloud, AI, and internet-platform workloads, whether self-built by the operator or contracted as hyperscale colocation.
Scope exclusions include edge sites below 5 MW, enterprise on-premise rooms, and legacy carrier hotels, which are not counted.
Segmentation Overview
- By Data Center Type
- Hyperscale Self-Build
- Hyperscale Colocation
- By Component
- IT Infrastructure
- Server Infrastructure
- Storage Infrastructure
- Network Infrastructure
- Electrical Infrastructure
- Power Distribution Units
- Transfer Switches and Switchgears
- UPS Systems
- Generators
- Other Electrical Infrastructure
- Mechanical Infrastructure
- Cooling Systems
- Racks
- Other Mechanical Infrastructure
- General Construction
- Core and Shell Development
- Installation and Commissioning Services
- Design Engineering
- Fire Detection, Suppression and Physical Security
- DCIM/BMS Solutions
- IT Infrastructure
- By Tier Standard
- Tier III
- Tier IV
- By Data Center Size
- Large ( Less than or equal to 25 MW)
- Massive (Greater than 25 MW and Less than equal to 60 MW)
- Mega (Greater than 60 MW)
Detailed Research Methodology and Data Validation
Primary Research
Mordor analysts spoke with design engineers at major hyperscale builders in Ontario and Québec, power-utility planners, liquid-cooling OEM specialists, and global cloud-procurement teams. Their insights filled deployment timing gaps, verified average build costs, and fine-tuned our utilization ramps across different rack density tiers.
Desk Research
We began with national datasets such as Statistics Canada electricity-use tables, Innovation, Science & Economic Development Canada spectrum filings, Canada Energy Regulator power-pipeline reports, and Hydro-Québec tariff schedules, which indicate where low-carbon megawatt hours are available. Trade groups, including the Uptime Institute and the Open Compute Project, provided density benchmarks and adoption curves, while company filings retrieved from D&B Hoovers and news flows screened through Dow Jones Factiva helped size operator CAPEX and new-build announcements. These sources establish the factual backbone of market demand, supply additions, and pricing.
Because public information is still patchy, the desk-research list above is illustrative, not exhaustive, and many additional records were reviewed for validation and clarification.
Market-Sizing & Forecasting
A top-down reconstruction of installed and announced megawatts by province formed the starting point, complemented by bottom-up sampling of facility-level ASP × capacity to cross-check totals. Key variables, like pipeline MW filings, average build cost per MW, rack density migration above 50 kW, renewable power price spreads, and GPU adoption rates, drive the multivariate regression forecast. Where capacity details were missing, we applied conservative fill rates based on historical Québec and GTA commissioning patterns before triangulating them with channel checks.
Data Validation & Update Cycle
Every model pass runs variance screens against independent capacity trackers and utility interconnection logs; anomalies trigger peer review and follow-up calls. Reports refresh annually, with mid-cycle updates when material project announcements move the baseline.
Why Mordor's Canada Hyperscale Data Center Baseline Commands Reliability
Published estimates diverge because firms differ on what counts as hyperscale revenue, how they convert capital investment to market value, and how often they refresh models.
Key gap drivers include scope dilution, which involves mixing colocation or enterprise rooms, reliance on regional ratios instead of facility data, currency conversion timing, and inconsistent treatment of hardware spend versus service revenue. Mordor's disciplined facility screen and annual refresh minimize these distortions.
Benchmark comparison
| Market Size | Anonymized source | Primary gap driver |
|---|---|---|
| USD 3.09 B (2025) | Mordor Intelligence | |
| USD 5.44 B (2024) | Regional Consultancy A | Totals capital investment across all data-center types, not revenue. |
| USD 10.26 B (2023) | Global Consultancy B | Uses broad data-center revenue and regional scaling, lacks facility counts. |
| USD 45.53 B (2024) | Trade Journal C | Adds hardware and services for every facility class, no hyperscale filter. |
These comparisons show that when scope is tightened around true hyperscale halls and validated through on-the-ground capacity checks, our 2025 baseline gives decision-makers a balanced, transparent figure they can trace back to clear variables and repeatable steps.


Key Questions Answered in the Report
How fast is hyperscale capacity growing in Canada?
Installed capacity is on pace for a 22.07% CAGR between 2026-2031, driven by mega-scale builds in Quebec, Ontario and Alberta.
What is the projected market size of the Canada hyperscale data center segment by 2031?
The Canada hyperscale data center market size is expected to reach USD 10.21 billion by 2031.
Which province offers the lowest power cost for data centers?
Quebec provides industrial tariffs near USD 0.036 per kWh, anchored by a 99% renewable grid.
Why are operators adopting liquid cooling in Canada?
GPU racks that exceed 50 kW require direct-to-chip or immersion cooling to maintain PUE below 1.1 and support AI workloads.
Who are the leading colocation providers?
Digital Realty, Equinix and Cologix lead on interconnection density, while Vantage Data Centers and STACK Infrastructure drive powered-shell mega-campus supply.
How are power-interconnect delays affecting construction?
Ontario and British Columbia face 18-36 month queue times, prompting some developers to pivot deployments toward Alberta's deregulated market.
Page last updated on:


