North America Golf Cart Market Size and Share
Market Overview
| Study Period | 2019 - 2030 |
|---|---|
| Forecast Data Period | 2025 - 2030 |
| Historical Data Period | 2019 - 2023 |
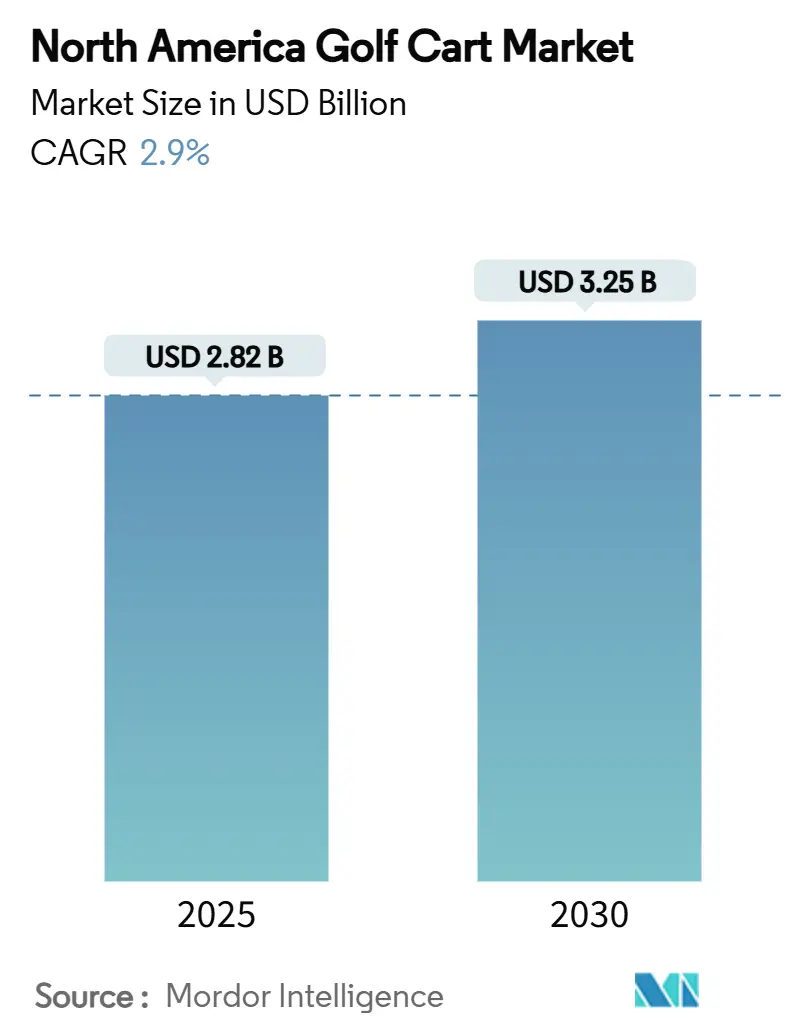
| Market Size (2025) | USD 2.82 Billion |
| Market Size (2030) | USD 3.25 Billion |
| Growth Rate (2025 - 2030) | 2.90% CAGR |
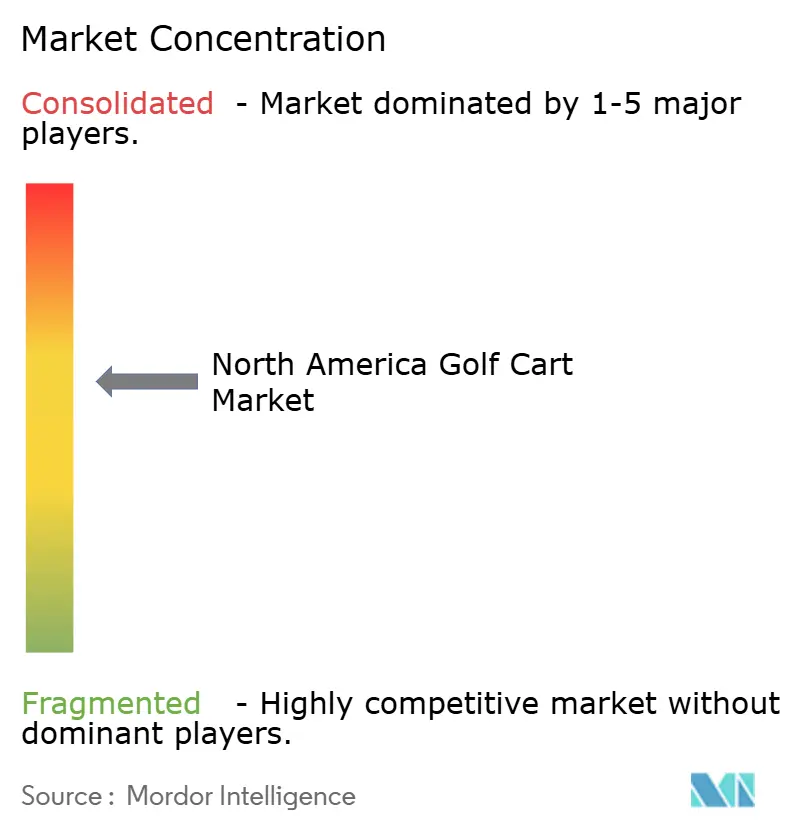
| Market Concentration | Medium |
Major Players *Disclaimer: Major Players sorted in no particular order Image © Mordor Intelligence. Reuse requires attribution under CC BY 4.0. | |
North America Golf Cart Market Analysis by Mordor Intelligence
The North America golf cart market size reached USD 2.82 billion in 2025 and is projected to advance to USD 3.25 billion by 2030, reflecting a 2.90% CAGR. This market size growth links directly to state-level electrification mandates, persistent sustainability targets in gated communities, and the increasing use of carts as short-range people-movers in resort, corporate, and residential settings. Electric propulsion, already dominant, benefits from California Air Resources Board (CARB) zero-emission rules that have influenced procurement policies across multiple states. Simultaneously, solar-hybrid technologies, tighter corporate fleet decarbonization goals, and premium guest-experience requirements in hospitality settings reinforce demand for alternative energy models.
Key Report Takeaways
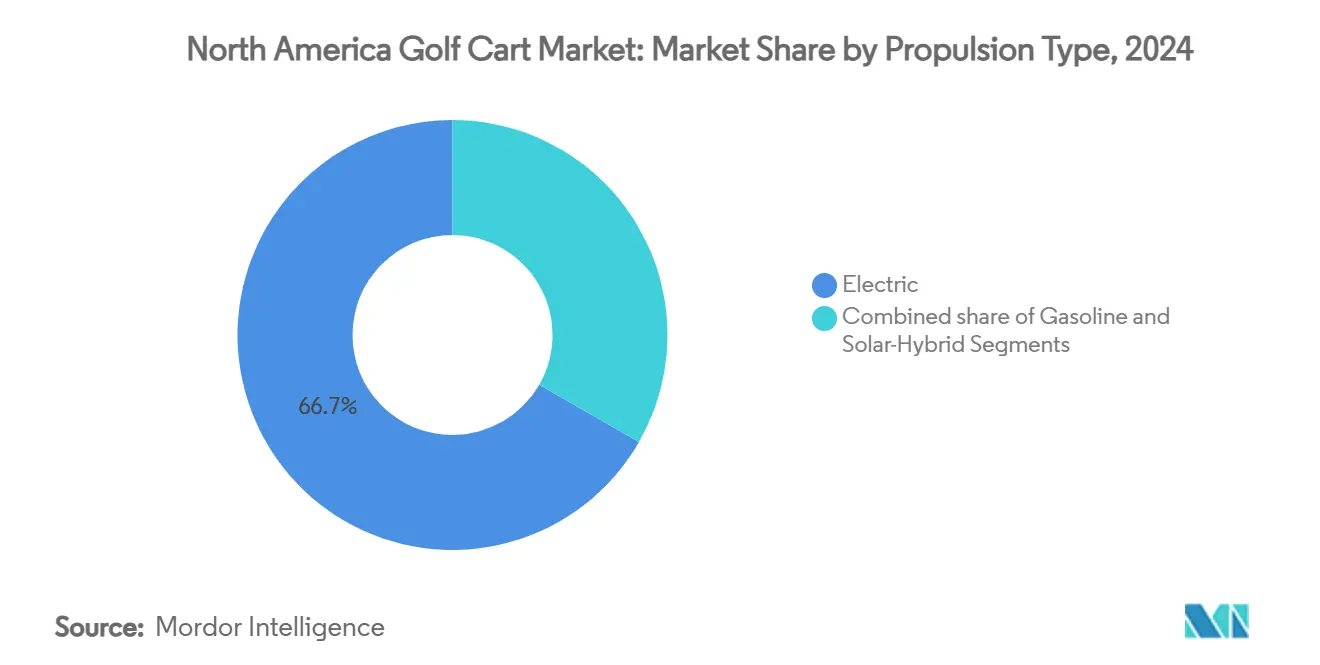
- By propulsion type, electric variants led with 66.72% of the North America golf cart market share in 2024, while solar-hybrid units are projected to deliver a 4.13% CAGR through 2030.
- By application, golf courses commanded 45.77% of the North America golf cart market size in 2024; personal transportation is set to record a 3.24% CAGR through 2030.
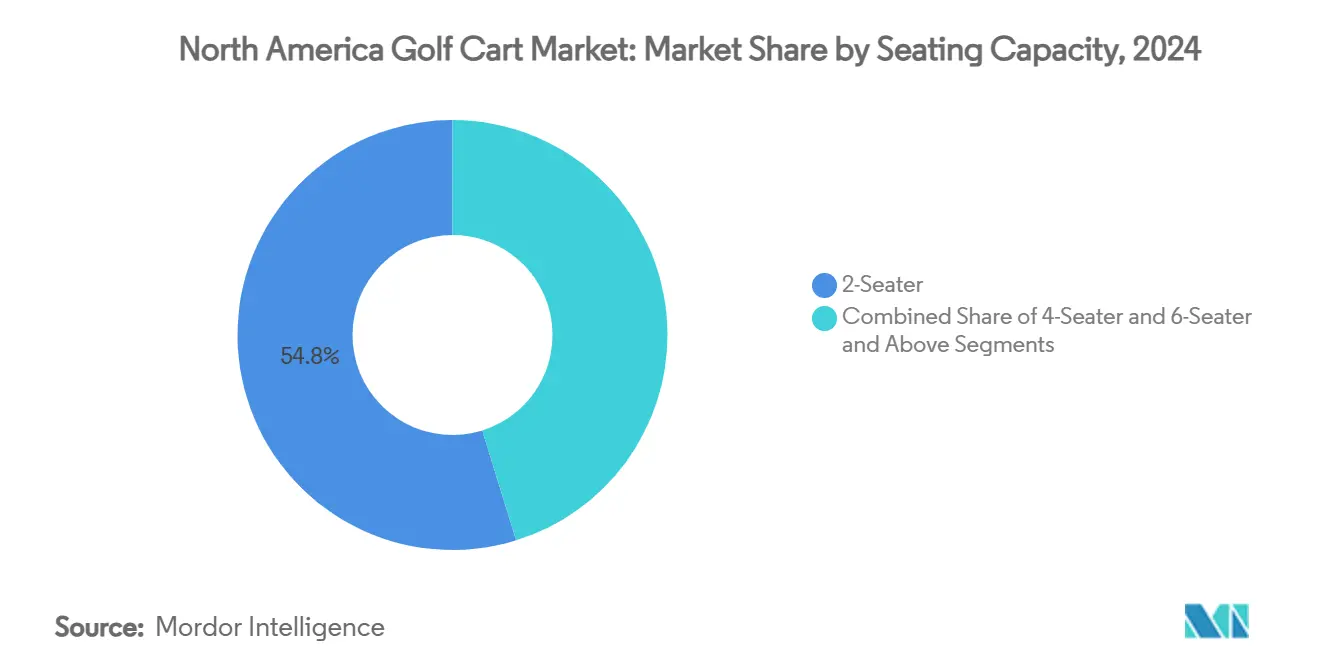
- By seating capacity, two-seater units held 54.81% share of the North America golf cart market size in 2024, whereas six-seater and larger models will expand at a 3.93% CAGR over the forecast horizon.
- By ownership model, personal ownership captured 46.33% of the North America golf cart market size in 2024; rental and shared services are projected to accelerate at a 3.88% CAGR to 2030.
- By geography, the United States accounted for 81.17% of the North America golf cart market share in 2024; Canada is forecast to progress at a 3.77% CAGR through 2030.
Worldwide, activity is shaped by contributions from multiple regions, with North america representing one of the more structurally developed among them. The global report on golf cart market by Mordor Intelligence reflects how these regional layers combine into a single system.
North America Golf Cart Market Trends and Insights
Drivers Impact Analysis*
| Driver | ( ) % Impact on CAGR Forecast | Geographic Relevance | Impact Timeline |
|---|---|---|---|
| Electrification Mandates in Gated Communities | +0.8% | California, Florida, and other Sun Belt hubs | Medium term (2-4 years) |
| Boom in Resort-Based Real-Estate Developments | +0.7% | Sun Belt coastal and desert states | Long term (≥ 4 years) |
| Corporate Fleet Decarbonization Programs | +0.6% | Nationwide with federal leadership | Medium term (2-4 years) |
| Rapid Uptake of Lithium-Iron-Phosphate Cells | +0.5% | Technology-focused buyers across the region | Short term (≤ 2 years) |
| Emergence of Solar-Integrated Canopy Roofs | +0.4% | Southwestern high-irradiance states | Long term (≥ 4 years) |
| State-Level Subsidies for Low-Speed EVs | +0.3% | United States—state-specific | Medium term (2-4 years) |
| Source: Mordor Intelligence | |||
Electrification mandates in gated communities
Municipal adherence to CARB’s long-standing zero-emission requirement for golf carts drives broad fleet replacement in many private developments [1]“Zero-Emission Golf Carts in Ozone Non-Attainment Areas,” California Air Resources Board, arb.ca.gov. Real-estate developers now list electric cart infrastructure alongside fiber-optic internet and solar rooftops when marketing new properties. Homeowner associations see measurable reductions in noise complaints and maintenance outlays once internal-combustion fleets are retired. The rule-driven transition also prompts suppliers to standardize smart charging posts that interface with building-level energy-management systems. Equipment makers gain brand leverage by certifying carts to the strictest California thresholds, which simplifies later market entry into other states.
Boom in resort-based real-estate developments
Post-pandemic travel recovery pushes resort operators to redesign site logistics around quiet, zero-tailpipe-emission vehicles. Resorts in Arizona, Nevada, and coastal Florida upgraded fleets in 2024-2025 to reinforce green branding while shortening guest transfer times. Telematics, pioneered in Textron’s Pace Technology Walk™ portfolio, now integrates cart positioning with concierge apps, raising service scores and ancillary spending [2]“Pace Technology Walk™ Launch Details,” Textron Specialized Vehicles, textronsv.com. Developers allocate dedicated solar-covered parking bays that both shade vehicles and feed microgrids during peak-sun hours. Resort brand standards increasingly stipulate LFP batteries to avoid lead-acid disposal issues.
Corporate fleet decarbonization programs
Federal directives requiring fully zero-emission light-duty acquisitions by 2035 encourage corporations to pilot electric golf carts before converting vans and trucks. Facilities managers cite predictable daily mileage and centralized overnight parking as ideal conditions for early wins. Federal and state incentives offset premium battery costs, and fleet-wide telematics platforms track carbon savings in real time. These early pilots become proofs-of-concept for larger corporate electrification roadmaps across the North America golf cart market.
Rapid uptake of lithium-iron-phosphate batteries
LFP chemistry now dominates new-model release roadmaps at Yamaha, Club Car, and Textron. The National Golf Foundation notes electric carts compose 55% of incoming fleets, largely because LFP’s improved thermal stability satisfies insurance underwriters concerned about clubhouse fire exposure. Operators report longer lifecycles and lower watering labor versus lead-acid packs, supporting favorable total cost-of-ownership calculations even where upfront purchase premiums persist. Supply integration remains agile because LFP uses iron and phosphate rather than nickel and cobalt, reducing geopolitical sourcing risks.
Restraints Impact Analysis*
| Restraint | ( ) % Impact on CAGR Forecast | Geographic Relevance | Impact Timeline |
|---|---|---|---|
| Under-Supply of Golf-Cart-Grade Semiconductors | -0.5% | Global but with local assembly bottlenecks | Short term (≤ 2 years) |
| Lead-Acid Disposal Regulations Tightening | -0.4% | Federal and state jurisdictions | Medium term (2-4 years) |
| Rising Theft and Vandalism Insurance Premiums | -0.3% | Urban and tourist centers | Short term (≤ 2 years) |
| Zoning Restrictions on Non-Road Vehicles in Cores | -0.2% | Municipal level across United States metropolitan | Long term (≥ 4 years) |
| Source: Mordor Intelligence | |||
Under-supply of golf-cart-grade semiconductors
Low-speed vehicle controllers share supply chains with e-bike and scooter industries, which have surged since 2024. Silicon carbide MOSFET availability tightened in early 2025, forcing several manufacturers to lengthen lead times to eight months for high-spec models. While global foundry expansions promise relief after 2026, near-term supply gaps hinder production planning and dealer inventory consistency, dampening the North America golf cart market during peak buying cycles.
Lead-acid disposal regulations tightening
EPA hazardous-waste rules under RCRA Part 273 impose stricter storage, manifest, and handler training obligations for spent batteries [3]“Universal Waste Regulations for Batteries,” United States Environmental Protection Agency, epa.gov. Smaller golf facilities scramble to locate certified recyclers within reasonable hauling distance, adding logistics expenses that push many toward LFP retrofitting. State inspectors in Arizona and North Carolina elevated fine schedules in 2025, signaling broader enforcement momentum. Compliance complexity accelerates consolidation because multi-course operators can amortize disposal programs over larger volumes.
*Our forecasts treat driver/restraint impacts as directional, not additive. The impact forecasts reflect baseline growth, mix effects, and variable interactions.
Segment Analysis
By Propulsion Type: Electric Models Set the Tone
Electric carts captured 66.72% in the North American golf cart market share in 2024 and continue to displace gasoline competitors through the forecast period. After switching to lithium-based drivetrains and aligning with off-peak utility tariffs, fleet managers report notable annual fuel cost savings per vehicle, enhancing project returns. Though representing a small installed base, solar-hybrid carts will outpace the aggregate market at 4.13% CAGR as panel efficiencies climb and integrated charge controllers mature. Gasoline platforms remain relevant in hilly courses and remote ranches where charging infrastructure lags, but their share erodes each procurement cycle. Manufacturers hedge technology risk by offering modular platforms that accept battery, hybrid, or fuel-injected powertrains at final assembly.
Battery chemistry emerges as the second competitive front. LFP packs dominate surfacing RFPs because they mitigate thermal runaway incidents. National insurers now provide some rebate in annual policy premiums for fleets documented with LFP safety certifications, further solidifying the chemistry’s position. Telematics tie-ins that monitor real-time voltage and temperature minimize unplanned downtime and feed warranty analytics. Over-the-air firmware updates let OEMs tweak efficiency curves or throttle outputs based on localized terrain, adding customizable value propositions for operators across the North America golf cart market.


By Application: Personal Transportation Builds Momentum
Golf courses held a 45.77% share of the North America golf cart market size in 2024 and will remain foundational for OEM revenue streams. Course superintendents favor platform continuity to simplify parts inventory and mechanical training. Yet personal transportation grew at a 3.24% CAGR, fueled by 55+ active-living communities in Florida and Arizona that permit street-legal carts on internal roadways. Homeowners value the low operating cost, porch-to-clubhouse convenience, and ability to spec custom paint or infotainment upgrades.
Commercial and utility services use case demand stays steady in campus security patrols, maintenance crews, and airport shuttle operations. Real-time dispatch software integrates carts with broader facility work-order systems, allowing task assignment by proximity, which trims idle time. Resorts apply geofenced speed governors for pedestrian zones while lifting caps on service roads to accelerate housekeeping or baggage runs. OEM accessory catalogs expand with ladder racks, enclosed cargo boxes, and ADA-compliant wheelchair ramps that widen the addressable market.
By Seating Capacity: Multiseater Units Ascend
Two-seater configurations contributed 54.81% market share in 2024, reflecting legacy single-foursome golf layouts and couples’ use in residential communities. However, six-seat and larger models chart a 3.93% CAGR through 2030, appealing to resorts that must transfer entire vacation parties plus luggage in one trip. Family-oriented subdivision developers plagued narrow lanes and limited parking spaces, favoring one shared six-seat cart over two smaller units. Extended-wheelbase frames adopt upgraded suspension to accommodate higher gross vehicle weight ratings without sacrificing ride comfort.
Four-seat units sit between carry capacity and maneuverability, finding traction among corporate campuses with small work teams moving between buildings. OEMs retrofit swiveling middle rows or convertible flatbeds to optimize utilization across cargo and passenger roles. State regulations cap maximum seating based on braking distance at posted low-speed limits; consequently, manufacturers invest in regenerative braking and four-wheel disc systems to unlock future eight-seat approvals.
By Ownership Model: Sharing Economy Gains Scale
Personal ownership retained 46.33% share in 2024 as homeowners treat carts akin to personal recreation assets, customizing paint schemes, seat embroidery, and sound systems. Rental and shared-service fleets accelerate at 3.88% CAGR, especially where municipal authorities license operators for tourist circuits in historic districts. Smartphone booking platforms slash idle inventory by matching real-time demand with station availability, slightly compressing daily rental rates while expanding overall utilization.
Fleet and corporate ownership continues to underpin institutional demand. Multicourse operators negotiate bulk purchase discounts that include parts consignment and technician training. In 2025, enterprises layered ESG reporting requirements onto fleet procurement policies, valuing lifecycle emission dashboards bundled by OEMs. Subscription models appear in pilot phases, with manufacturers retaining title and swapping batteries at three-year intervals in exchange for fixed monthly charges covering maintenance, software, and telemetry.
Geography Analysis
The United States contributed 81.17% market share in the North America golf cart market in 2024, anchored by 15,500-plus golf facilities, wide gated-community footprints, and robust resort pipelines. California sustains regulatory leadership through CARB’s zero-emission stipulations, prompting suppliers to pre-certify vehicles for stricter standards before distribution nationwide. Florida hosts the highest cart density due to retiree in-migration and master-planned towns such as The Villages that permit carts on 100-plus miles of dedicated paths. Tariffs on Chinese units insulate domestic assembly in Georgia and Texas, tipping the total cost of ownership scales in favor of locally produced electric models.
Canada records a 3.77% CAGR to 2030 as British Columbia’s resort corridors and Ontario’s cottage-country developments integrate cart networks to bridge parking lots, marinas, and amenity nodes. Provincial clean-energy mandates complement federal climate targets, driving operators to prefer electric platforms. Cold-weather storage and battery-heating solutions represent incremental cost, yet manufacturers bundle insulated covers and smart chargers calibrated for sub-zero environments, removing a historical adoption barrier.
Mexico and other rest-of-region pockets adopt a follow-the-leader pattern. Luxury resorts along the Riviera Maya import US-made carts to satisfy guest expectations of quiet, odor-free transfers. Municipal golf-course investment remains modest, but private residential enclaves in Jalisco and Baja California show rising interest as property developers court US buyers familiar with cart culture. Currency fluctuations and homologation regulations constitute principal hurdles but easing under the United States-Mexico-Canada Trade Agreement streamlines spare-parts flow.
Competitive Landscape
Moderate concentration characterizes the North America golf cart market. Club Car, Yamaha Golf-Car Company, and Textron Specialized Vehicles together hold a clear majority, supported by dealer networks, financing arms, and full-range accessory lines. Tariffs on specific Chinese imports from 2024 onward dampen price-led competition, yet Kandi Technologies’ 2025 launch of a Texas assembly plant illustrates how foreign firms localize operations to bypass duties and respond quickly to regional design codes.
Strategic thrusts focus on battery platforms and digital services. Textron’s Pace Technology Suite now bundles real-time pace-of-play analytics for course superintendents, whereas Club Car leverages over-the-air diagnostics to schedule predictive maintenance visits. Yamaha expands LFP supply agreements to guarantee cell allocations amid semiconductor volatility. OEMs actively court solar-canopy start-ups, viewing co-development as a pathway to differentiated range claims without increasing battery weight.
New entrants target niche applications—autonomous security patrol units, refrigerated cargo bodies for stadium concessions, or ADA-compliant shuttles. Incumbents counter by launching modular chassis that accept bolt-on kits delivered through regional upfitters, thereby preserving core volume while satisfying bespoke orders. Textron’s USD 62 million Q1 2025 revenue dip, attributed to mix shifts toward lower-margin models, signals that commoditization pressures mount despite overall market expansion.
North America Golf Cart Industry Leaders
Textron Specialized Vehicles Inc. (E-Z-GO)
Club Car
Yamaha Motor Co., Ltd.
ICON Electric Vehicles
Garia A/S
- *Disclaimer: Major Players sorted in no particular order

Recent Industry Developments
- May 2025: Kandi Technologies started production at its Garland, Texas plant, rolling out the first domestically assembled electric golf cart under its “Made in North America” initiative.
- May 2025: HeyYa Rentals Inc. launched Canada’s first street-legal golf cart rental operation in Victoria, beginning with five electric units and targeting fifteen by month-end.
- March 2025: Club Car unveiled next-generation Tempo upgrades featuring an Automatic Park Brake system that engages without a separate pedal press, enhancing user convenience.
- November 2024: Massimo Group introduced the MVR Series electric carts, including the MVR 2X Golf Cart and MVR Cargo Max Utility Cart, aimed at recreation and professional segments.


North America Golf Cart Market Report Scope
| Electric |
| Gasoline |
| Solar-Hybrid |
| Golf Course |
| Personal Transportation |
| Commercial/Utility Services |
| 2-Seater |
| 4-Seater |
| 6-Seater and Above |
| Personal Ownership |
| Fleet/Corporate |
| Rental and Shared Services |
| United States |
| Canada |
| Rest of North America |
| By Propulsion Type | Electric |
| Gasoline | |
| Solar-Hybrid | |
| By Application | Golf Course |
| Personal Transportation | |
| Commercial/Utility Services | |
| By Seating Capacity | 2-Seater |
| 4-Seater | |
| 6-Seater and Above | |
| By Ownership Model | Personal Ownership |
| Fleet/Corporate | |
| Rental and Shared Services | |
| By Country | United States |
| Canada | |
| Rest of North America |


Key Questions Answered in the Report
What is the current size of the North America golf cart market?
The market stands at USD 2.82 billion in 2025 and is projected to reach USD 3.25 billion by 2030.
Which propulsion type holds the largest share in the North America golf cart market?
Electric models accounted for 66.72% of unit shipments in 2024.
Which application segment is growing fastest?
Personal transportation leads growth with a projected 6.24% CAGR through 2030.
How big is the United States’ share of the market?
The United States represented 81.17% of regional revenue in 2024.
Page last updated on:


