Golf Cart Battery Market Size and Share
Market Overview
| Study Period | 2019 - 2030 |
|---|---|
| Market Size (2025) | USD 167.24 Million |
| Market Size (2030) | USD 224.97 Million |
| Growth Rate (2025 - 2030) | 6.11% CAGR |
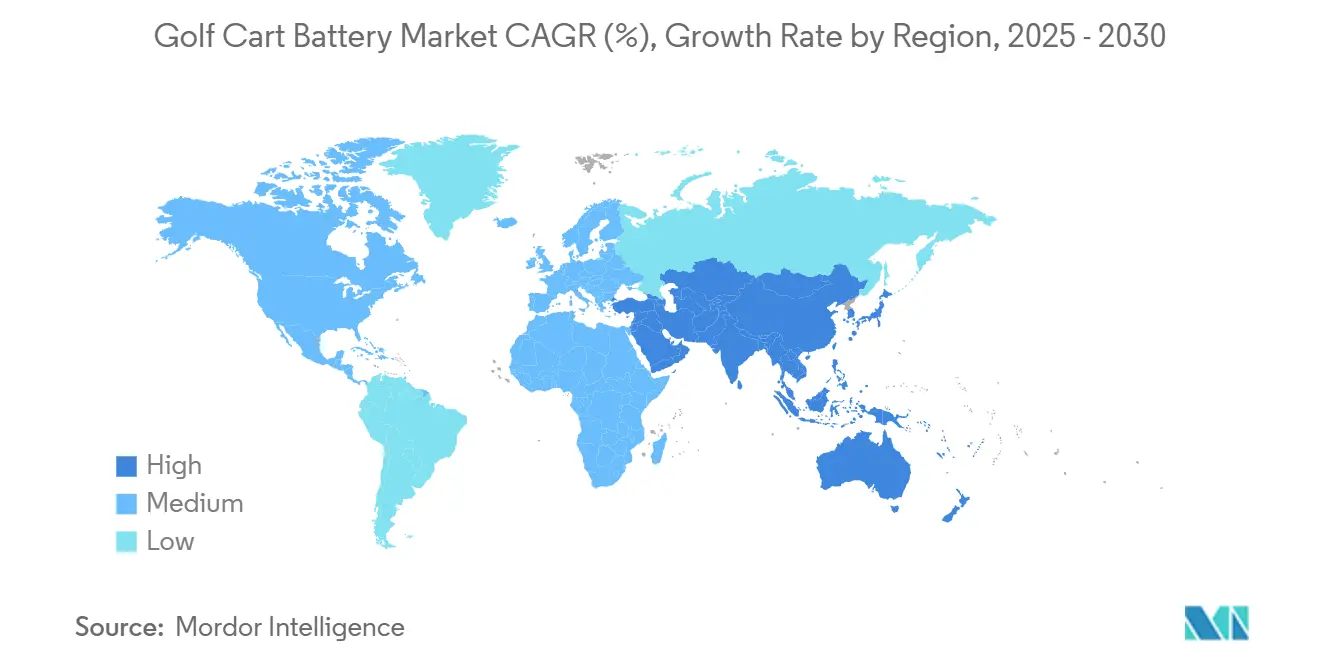
| Fastest Growing Market | Middle East and Africa |
| Largest Market | Asia Pacific |
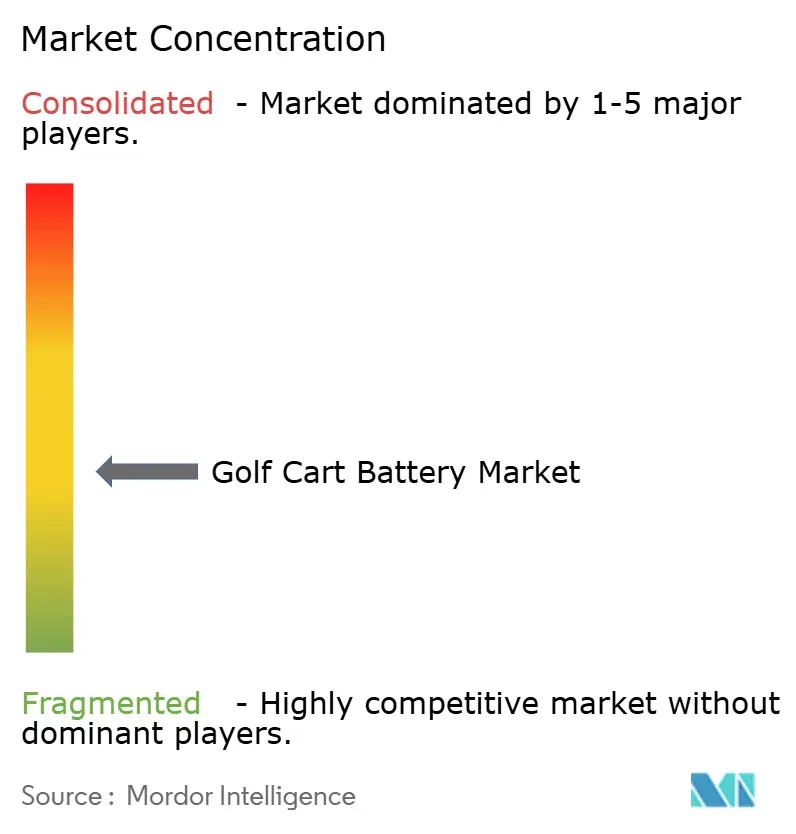
| Market Concentration | Medium |
Major Players *Disclaimer: Major Players sorted in no particular order Image © Mordor Intelligence. Reuse requires attribution under CC BY 4.0. | |
Golf Cart Battery Market Analysis by Mordor Intelligence
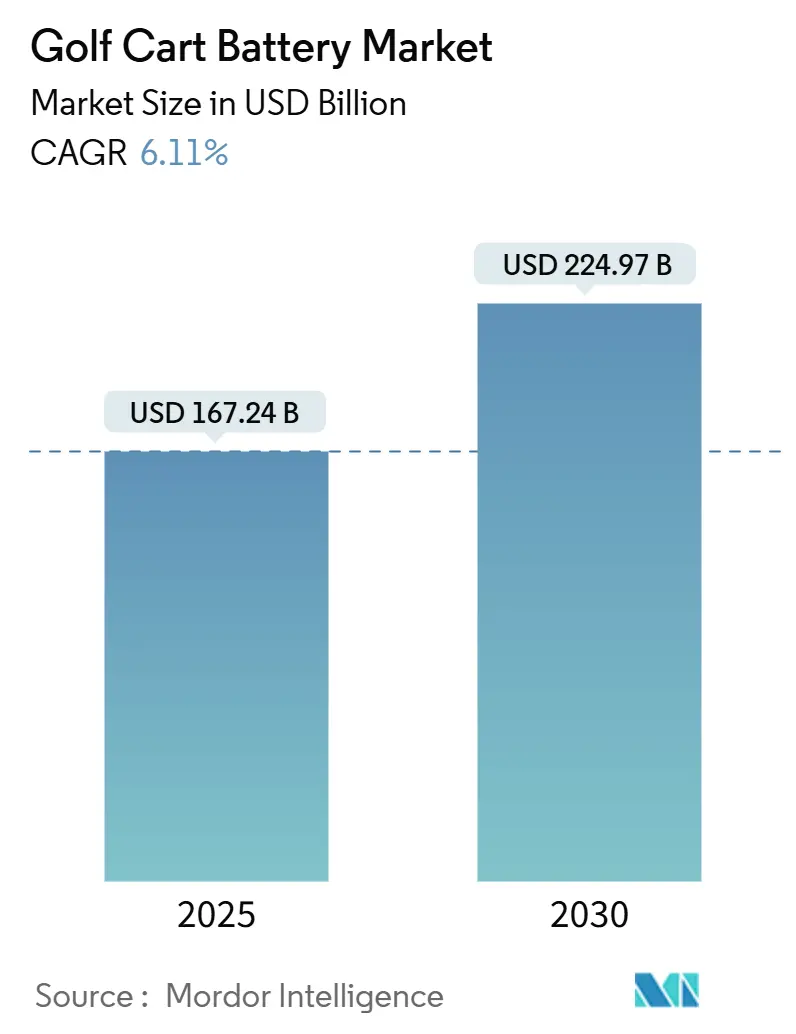
The Golf Cart Battery Market size is estimated at USD 167.24 million in 2025, and is expected to reach USD 224.97 million by 2030, at a CAGR of 6.11% during the forecast period (2025-2030). This expansion rides on rapid lithium-ion cost declines, tightening air-quality regulations for low-speed vehicles, and fleet operators’ preference for higher-performance LiFePO₄ systems that cut total ownership costs. Factory-installed lithium packs from leading OEMs, integrated telematics, and second-life repurposing economics bolster adoption, while cost pressures from lead recycling compliance accelerate the technology shift. Asia-Pacific retains volume leadership due to mature battery supply chains. Yet, the Middle East & Africa are expected to register the fastest regional growth, fueled by new golf tourism investments and government EV mandates. Competitive intensity rises as legacy lead-acid incumbents defend share against lithium specialists and automotive battery giants that bundle cells, software, and service into turnkey solutions.
Key Report Takeaways
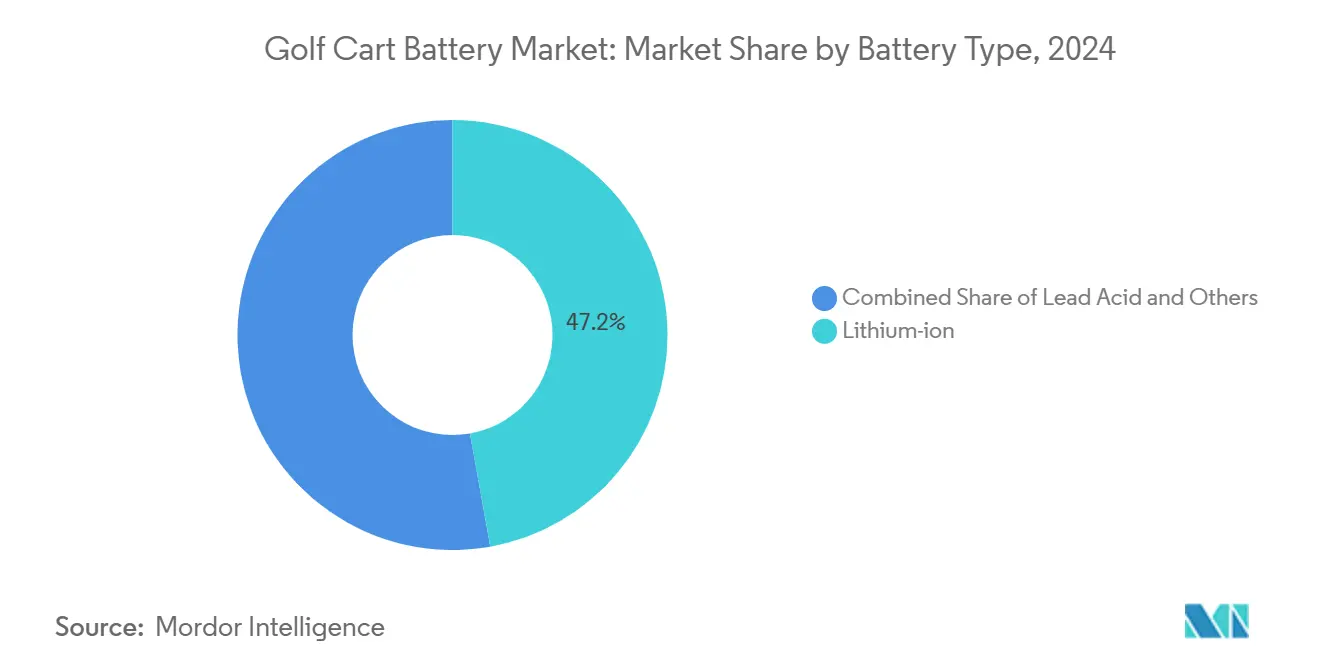
- By battery type, lithium-ion batteries account for a 47.18% share of the golf cart battery market in 2024 and are expected to grow at a 6.14% CAGR during the forecast period (2025-2030).
- By voltage type, 6V batteries held a 43.45% share of the golf cart battery market in 2024. The 12V systems segment is expected to grow at a 6.22% CAGR during the forecast period (2025-2030).
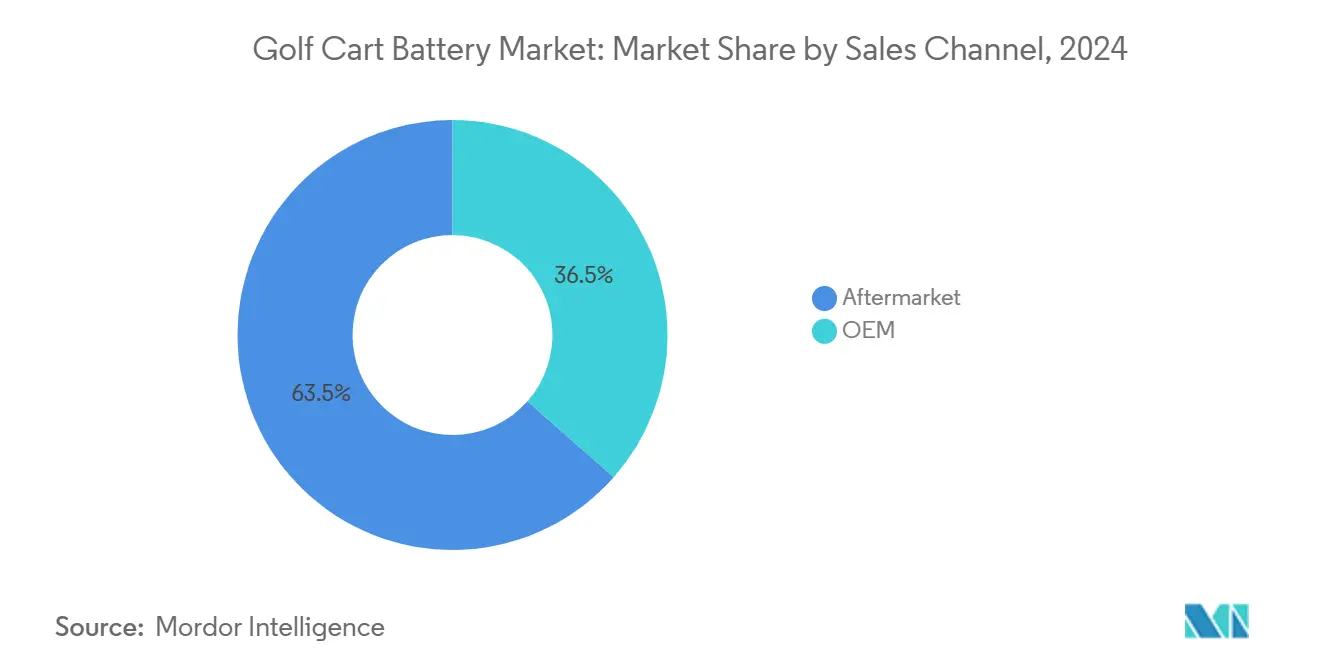
- By sales channel, the aftermarket segment accounted for a 63.49% share of the golf cart battery market in 2024, while the same channel posts the highest projected CAGR at 6.18% during the forecast period (2025-2030).
- By application, golf courses commanded a 57.71% share of the golf cart battery market in 2024, whereas commercial use cases are expected to expand at a 6.15% CAGR during the forecast period (2025-2030).
- By geography, Asia-Pacific accounted for a 38.73% share of the golf cart battery market in 2024, while the Middle East & Africa is forecast to expand at a 6.21% CAGR during the forecast period (2025-2030).
Global Golf Cart Battery Market Trends and Insights
Drivers Impact Analysis*
| Driver | (~) % Impact on CAGR Forecast | Geographic Relevance | Impact Timeline |
|---|---|---|---|
| Rapid Lithium-Ion Cost Decline | +1.2% | Global, with strongest impact in North America and Europe | Medium term (2-4 years) |
| Regulatory Push For Low-Speed EV Decarbonisation | +1.1% | North America and Europe, expanding to Asia Pacific | Long term (≥ 4 years) |
| Surging Resort and Gated-Community Fleet Replacements | +0.9% | Global, concentrated in tourism hubs | Short term (≤ 2 years) |
| OEM Shift To Factory-Installed LiFePO₄ Packs | +0.8% | North America and Europe, with Asia Pacific manufacturing | Medium term (2-4 years) |
| Smart BMS and Telematics Unlocking Fleet ROI | +0.7% | Global, led by developed markets | Medium term (2-4 years) |
| Second-Life Battery | +0.6% | Global, with regulatory support in EU and California | Long term (≥ 4 years) |
| Source: Mordor Intelligence | |||
Rapid Lithium-Ion Cost Decline & Performance Gains
In recent years, prices for lithium cells have dropped significantly, enhancing their affordability. This trend is poised to persist, bolstered by supportive measures like U.S. tax incentives. Consequently, LiFePO₄ battery packs are emerging as a more economical and sustainable choice compared to conventional lead-acid systems, which typically necessitate frequent replacements. With cycle lives surpassing thousands, consistent voltage under load, and charging speeds significantly faster, these advancements enhance fleet uptime and reduce labor associated with maintenance tasks like watering and equalization. CloudEnergy’s module, boasting a substantial capacity and a high discharge rate, operates maintenance-free in a wide temperature range. This capability allows carts to power GPS and lighting accessories without compromising their range.
Regulatory Push For Low-Speed EV Decarbonization
California mandates zero-emission golf carts in ozone non-attainment zones under Advanced Clean Cars II, creating a compliance floor that ripples to South Carolina and other states adopting clean-air frameworks [1]“Advanced Clean Cars II Regulation,” California Air Resources Board, arb.ca.gov. NHTSA’s FMVSS 305a outlines battery safety, thermal event alerts, and emergency documentation for EVs, establishing design expectations soon to filter into low-speed applications. Tightening European sustainability rules advance similar momentum, steering fleet buyers toward lithium solutions that meet future-proof safety and reporting norms.
Surging Resort & Gated-Community Fleet Replacements
Hospitality operators swap aging lead-acid packs to reduce noise, emissions, and unplanned downtime, aligning with net-zero property targets that improve guest experience. Bulk conversions standardize charging hardware and unlock supplier discounts, while gated communities favor quiet late-evening patrols that maintain neighborhood property values. Hawai‘i utilities model rising distributed storage from resort PV-plus-battery installations, showing synergy between cart batteries and broader energy-resilience goals.
OEM Shift To Factory-Installed LiFePO₄ Packs
E-Z-GO and Samsung SDI have deployed over two lakh ELiTE lithium carts across three thousand plus courses, each sold with an 8-year warranty and embedded telematics, bypassing traditional distributors. Club Car and Yamaha partner with cell suppliers to co-engineer packs tuned to vehicle firmware, supporting regenerative braking and predictive maintenance. This shifts value from aftermarket retrofits to integrated platforms, raising entry barriers for generic battery vendors.
Restraints Impact Analysis*
| Restraint | (~) % Impact on CAGR Forecast | Geographic Relevance | Impact Timeline |
|---|---|---|---|
| Lead Recycling/Handling Compliance Costs | -0.4% | Global, with strictest enforcement in North America and EU | Short term (≤ 2 years) |
| Lithium Supply-Chain Metal Volatility | -0.3% | Global, with supply concentration in South America and Australia | Medium term (2-4 years) |
| Safety / Thermal-Runaway Perception Risks | -0.2% | Global, with heightened concerns in developed markets | Short term (≤ 2 years) |
| Limited Charging Infra | -0.1% | Rural areas globally, concentrated in developing regions | Medium term (2-4 years) |
| Source: Mordor Intelligence | |||
Lead Recycling / Handling Compliance Costs
EPA rule 40 CFR Part 63 Subpart X obligates smelters and fleet shops to monitor emissions, document inventories, and train staff, raising overhead for operators still using lead-acid batteries. California's new regulations impose extra fees on every unit sold and mandate spill-prevention equipment. As a result, many smaller courses are shifting to lithium battery packs. While these packs have a steeper upfront price, they sidestep the need for hazardous material handling.
Lithium Supply-Chain Metal Volatility
Lithium carbonate spot prices slid half from 2022 highs but could swing upward once demand surpasses new mine output by 2026, complicating long-term budget planning for replacement packs. Suppliers hedge with fixed-cost contracts, yet risk premiums filter into unit prices and dent margins. Diversification into sodium-ion chemistries under development by Clarios helps buffer future raw-material shocks.
*Our forecasts treat driver/restraint impacts as directional, not additive. The impact forecasts reflect baseline growth, mix effects, and variable interactions.
Segment Analysis
By Battery Type: Lithium-Ion Extends Lead
Lithium-ion batteries captured 47.18% of the golf cart battery market share in 2024 and are growing at a 6.14% CAGR during the forecast period (2025-2030), driven by superior energy density, 6,000-cycle durability, and faster charging that lowers lifetime costs. Lead-acid still serves price-sensitive buyers but sees share erosion as operators recalculate total ownership economics. E-Z-GO’s ELiTE packs showcase the mainstreaming of factory-installed lithium platforms that include intelligent BMS and 8-year warranties. Emerging sodium-ion prototypes could widen chemistries in the segment after 2027.
Lead-acid incumbents respond with enhanced-flooded designs and AGM variants, yet cycle-life gaps persist. Meanwhile, second-life pathways boost residual values for lithium modules, supporting fleet upgrade business cases. Competitive pressure centres on warranty terms, safety certifications, and telematics integration, not cell pricing alone. Market participants that deliver turnkey packs, documentation, and recycling programs will capture an outsized share during the forecast window.


By Voltage Type: 12 V Systems Accelerate
The 6 V segment held 43.45% of the golf cart battery market size in 2024, a legacy of series-string lead-acid architecture that simplifies modular replacements. Yet 12 V lithium packs are expected to grow at a 6.22% CAGR during the forecast period (2025-2030), as OEMs trim wiring complexity and parts count. Operators appreciate reduced maintenance touchpoints and improved accessory power for GPS and HVAC kits.
Higher-voltage 48 V and 72 V systems sit in the “Others” bucket, targeting utility carts that haul equipment or people movers in airports. NHTSA’s emphasis on electrical isolation and thermal controls nudges designs toward integrated 48 V solutions with sealed connectors and on-board diagnostics. As accessory loads climb, the case for 12 V and above strengthens, tilting purchasing toward suppliers offering drop-in upgrades that meet legacy charger footprints while boosting performance.
By Sales Channel: Aftermarket Dominance Holds
Aftermarket outlets represented 63.49% of the golf cart battery market in 2024 and are expected to grow at a 6.18% CAGR during the forecast period (2025-2030), upheld by a global network of distributors who stock multi-brand drop-in kits. Fleet managers value the freedom to mix suppliers, negotiate bulk discounts, and retrofit carts outside OEM service windows. Standardized tray dimensions and connector layouts enable smooth swap-outs without chassis modifications.
OEM sales rise as manufacturers bundle lithium packs, chargers, and telematics into turnkey packages that promise zero maintenance. The success of E-Z-GO ELiTE lines exemplifies this pivot, yet many buyers still perceive OEM batteries as premium-priced. Consequently, nimble aftermarket specialists offering financing, on-site installation, and recycling pick-ups maintain channel strength through 2030, especially in Asia-Pacific and Latin America, where dealer reach is critical.
By Application: Commercial Uses Gain Momentum
Golf courses generated 57.71% of the golf cart battery market size in 2024, mirroring the sport’s entrenched fleet base. However, commercial deployments are expected to grow at a 6.15% CAGR during the forecast period (2025-2030), spanning resorts, gated communities, campuses, and industrial sites. These operators demand year-round uptime, ruggedized enclosures, and telematics that optimize dispatch for guest shuttles or maintenance crews.
Lithium packs excel in high-cycle, stop-and-go schedules that are standard in commercial settings, maintaining consistent torque on inclines and extended shift hours. Quiet operation, no fumes, and reduced charge times appeal to hospitality managers focused on guest satisfaction, while lowered weight eases turf wear in landscaping duties. As urban last-mile logistics explore compact low-speed vehicles, the commercial demo broadens further, cementing its role as the fastest-growing demand pool.
Geography Analysis
Asia-Pacific commanded 38.73% of global revenue in 2024, supported by mature supply chains in China, South Korea, and Japan. Chinese cell makers such as Tianneng and CALB ship cost-competitive LiFePO₄ modules, while Korean producers like Samsung SDI supply high-performance packs for OEM tie-ups [2]“Battery Export Trends 2025,” Ministry of Commerce China, mofcom.gov.cn . With expanded resort developments across Southeast Asia and a growing middle-class golf demographic, domestic demand climbs. Trade frictions, including U.S. countervailing duty probes on low-speed vehicles, inject uncertainty, yet regional vendors buffer risk through ASEAN export corridors and localised assembly in Vietnam and Thailand.
North America accounts for a mature installed base that drives steady replacement cycles. California’s zero-emission mandate for golf carts in ozone non-attainment areas and Canada’s 2030 zero-emission vehicle targets push fleets toward lithium upgrades. Golf resort chains across Arizona and Florida align battery purchases with sustainability certifications to attract eco-conscious clientele. Telematics adoption is high, with U.S. courses leveraging cloud dashboards to dispatch carts dynamically based on tee-time density and avoid midday charging bottlenecks.
The Middle East & Africa are expected to deliver the highest regional CAGR at 6.21% through 2030. Governments fund new championship courses to diversify tourism, and mega-projects like Saudi Arabia’s Red Sea resorts budget all-electric mobility platforms, including golf carts. The UAE’s half of EV target by 2050 and plans for 10 GW of solar capacity spur demand for clean, quiet transport in desert climates with strict hospitality standards [3]“National EV Policy 2025,” Ministry of Economy & Industry, UAE, moei.gov.ae . Severe heat drives a premium for packs rated to 60 °C with active cooling, creating niche openings for high-end lithium vendors.

Competitive Landscape
The golf cart battery market exhibits moderate fragmentation. Legacy lead-acid giants Trojan Battery and Crown Battery leverage century-old brands and deep distributor ties but face margin compression as lithium adoption accelerates. Lithium specialists like RELiON and eco-EV newcomers capture share with drop-in kits featuring 10-year warranties and Bluetooth diagnostics. Automotive battery majors like Samsung SDI and Clarios inject scale, R&D heft, and safety credentials, enabling bundled offerings that include cells, software, and recycling logistics.
Strategic alliances shift power dynamics: E-Z-GO’s partnership with Samsung SDI places OEMs at the centre of integrated battery-vehicle platforms, shrinking third-party retrofit volumes. Club Car collaborates with LG Energy Solution on high-power golf and utility packs, while Yamaha works with Kinetic Green in India to localise lithium sourcing. Suppliers differentiate through UL 2580 certification, IPC-traceable pack assembly, and cloud API access for fleet dashboards.
Cost leadership alone no longer guarantees success. Vendors invest in second-life programs, carbon-neutral manufacturing, and sodium-ion R&D. Clarios and Altris co-develop Na-ion prototypes that promise stable pricing and easier material sourcing. Market entry barriers rise around IP for cell balancing algorithms, patented enclosures, and integration expertise with OEM firmware.
Golf Cart Battery Industry Leaders
Trojan Battery Company
Crown Battery Manufacturing
East Penn Manufacturing (Deka)
Exide Industries Ltd.
Clarios
- *Disclaimer: Major Players sorted in no particular order

Recent Industry Developments
- October 2024: Clarios invested in Altris to accelerate software-enhanced sodium-ion battery systems for vehicles, targeting pilot production in 2026.
- September 2024: Clarios signed a development pact with a European truck maker to co-produce 24 V lithium-ion packs, expanding its high-voltage portfolio.
- September 2024: CloudEnergy launched a 48 V 105 Ah lithium battery for golf carts with 5,376 Wh capacity and screw-fastened housing for easier servicing.


Global Golf Cart Battery Market Report Scope
| Lead Acid |
| Lithium-ion |
| Others |
| 6 V |
| 8 V |
| 12 V |
| Others |
| OEM |
| Aftermarket |
| Golf Course |
| Commercial |
| North America | United States |
| Canada | |
| Rest of North America | |
| South America | Brazil |
| Argentina | |
| Rest of South America | |
| Europe | United Kingdom |
| Germany | |
| Spain | |
| Italy | |
| France | |
| Russia | |
| Rest of Europe | |
| Asia Pacific | India |
| China | |
| Japan | |
| South Korea | |
| Rest of Asia Pacific | |
| Middle East and Africa | United Arab Emirates |
| Saudi Arabia | |
| Turkey | |
| Egypt | |
| South Africa | |
| Rest of Middle East and Africa |
| By Battery Type | Lead Acid | |
| Lithium-ion | ||
| Others | ||
| By Voltage Type | 6 V | |
| 8 V | ||
| 12 V | ||
| Others | ||
| By Sales Channel | OEM | |
| Aftermarket | ||
| By Application | Golf Course | |
| Commercial | ||
| By Region | North America | United States |
| Canada | ||
| Rest of North America | ||
| South America | Brazil | |
| Argentina | ||
| Rest of South America | ||
| Europe | United Kingdom | |
| Germany | ||
| Spain | ||
| Italy | ||
| France | ||
| Russia | ||
| Rest of Europe | ||
| Asia Pacific | India | |
| China | ||
| Japan | ||
| South Korea | ||
| Rest of Asia Pacific | ||
| Middle East and Africa | United Arab Emirates | |
| Saudi Arabia | ||
| Turkey | ||
| Egypt | ||
| South Africa | ||
| Rest of Middle East and Africa | ||


Key Questions Answered in the Report
How large is the golf cart battery market in 2025?
The golf cart battery market size is USD 167.24 million in 2025, projected to grow to USD 224.97 million by 2030.
What CAGR is expected for golf cart battery demand through 2030?
The market is forecast to expand at a 6.11% CAGR between 2025 and 2030.
Which battery type leads sales today?
Lithium-ion holds 47.18% of 2024 revenue and is the fastest-growing chemistry at a 6.14% CAGR.
Why are resorts switching to lithium packs?
Resorts value lower noise, zero emissions, shorter charge times, and 6,000-cycle durability that cuts maintenance and boosts guest satisfaction.
Which region shows the fastest growth?
The Middle East and Africa are expected to lead the regional CAGR at 6.21%, due to new tourism projects and supportive EV policies.
How do lead recycling rules influence battery choice?
Rising compliance costs for lead handling push fleets toward lithium systems that avoid haz-mat fees and paperwork.
Page last updated on:


