North America Data Center SSD Market Size and Share
Market Overview
| Study Period | 2019 - 2031 |
|---|---|
| Forecast Data Period | 2025 - 2031 |
| Historical Data Period | 2019 - 2023 |
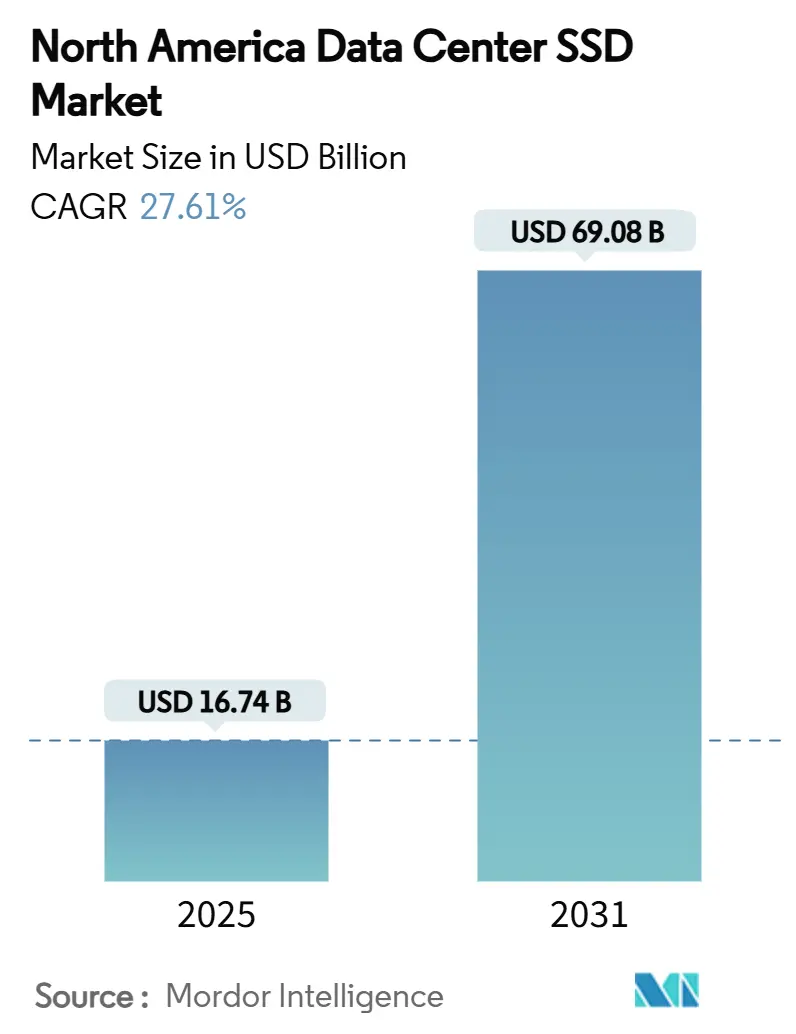
| Market Size (2025) | USD 16.74 Billion |
| Market Size (2031) | USD 69.08 Billion |
| Growth Rate (2025 - 2031) | 27.61% CAGR |
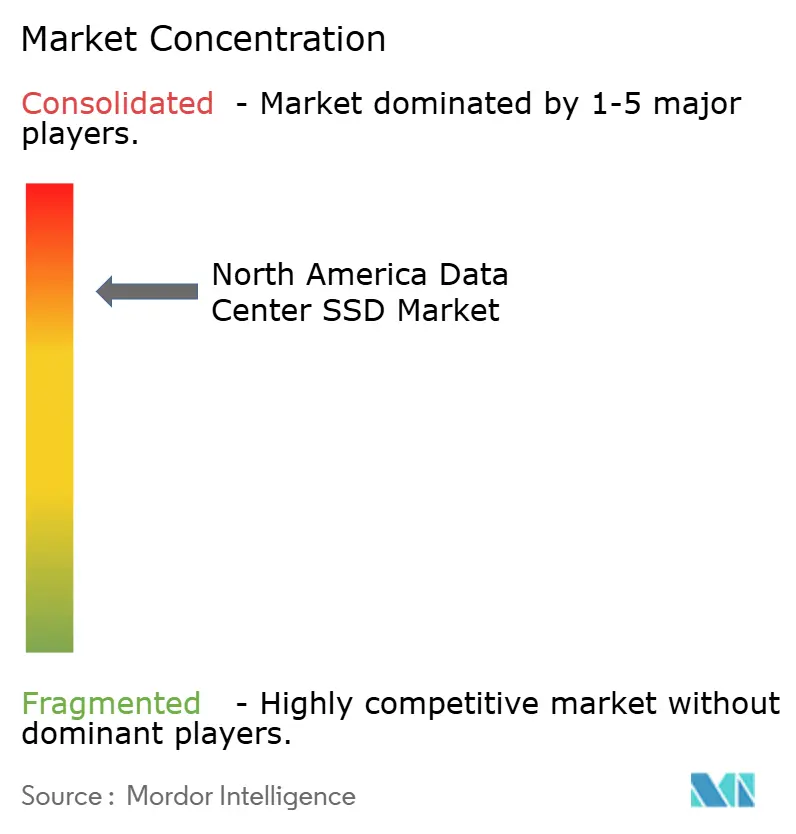
| Market Concentration | High |
Major Players *Disclaimer: Major Players sorted in no particular order Image © Mordor Intelligence. Reuse requires attribution under CC BY 4.0. | |
North America Data Center SSD Market Analysis by Mordor Intelligence
The North America data center SSD market size is valued at USD 16.74 billion in 2025 and is projected to reach USD 69.08 billion by 2031, registering a robust 27.61% CAGR over 2025-2030. Generative AI training, the rapid switch to PCIe Gen5 bandwidth, and corporate ESG mandates for all-flash arrays are converging to redefine procurement priorities and refresh cycles. Hyperscale cloud providers account for the bulk of installations, yet edge data-center build-outs are unlocking fresh demand for ruggedized NVMe drives. Capacity migration toward ≥4 TB, architectural shifts favoring write-intensive 10-DWPD designs, and NAND technology innovation around QLC all reinforce a sustained upswing in unit shipments and average selling prices. Meanwhile, the CHIPS Act is catalyzing local fabrication that reduces geopolitical risk and shortens lead times, although NAND price volatility and thermal challenges linked to PCIe Gen5/6 remain persistent headwinds.
Key Report Takeaways
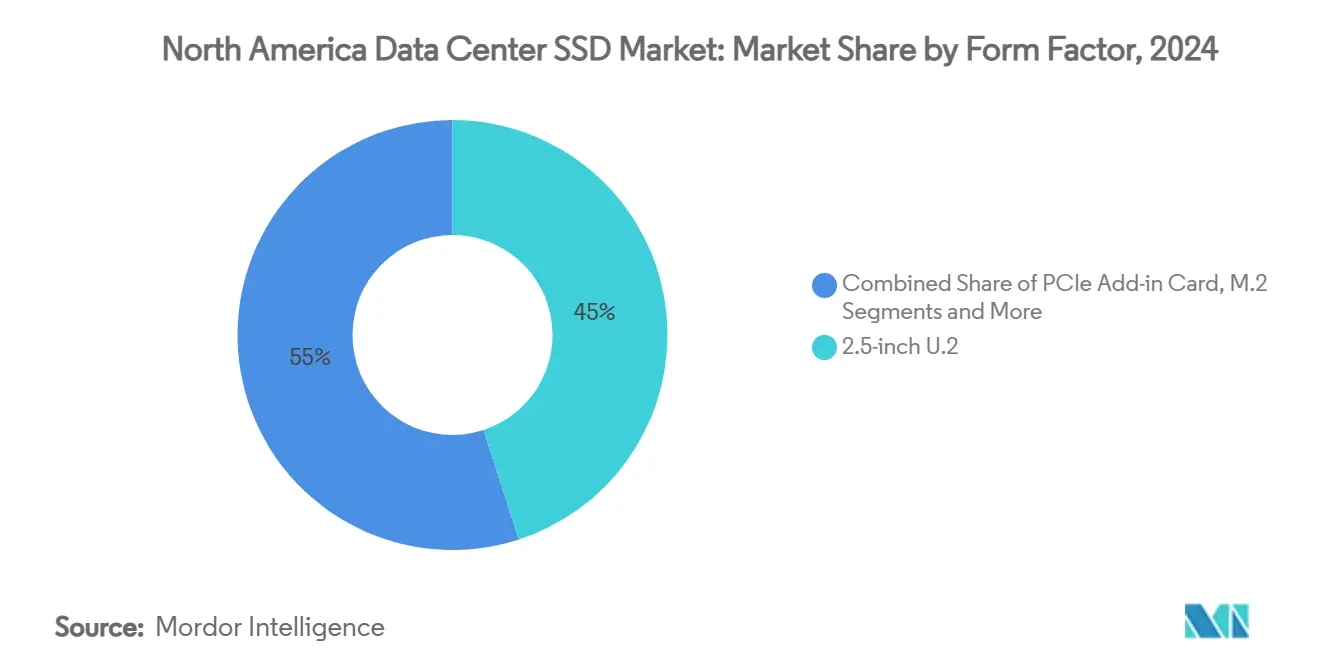
- By form factor, 2.5-inch U.2 held 45% of the North America data center SSD market share in 2024, whereas E1.S is forecast to expand at a 27% CAGR through 2030.
- By interface, PCIe Gen4 captured 55% revenue share in 2024, while PCIe Gen5 is projected to grow at 30% CAGR to 2030.
- By NAND technology, TLC dominated with 70% share in 2024; QLC is advancing at a 29% CAGR over the same period.
- By drive architecture, mixed-use 3-DWPD solutions accounted for 53% of the North America data center SSD market size in 2024; write-intensive 10-DWPD leads growth at 28% CAGR to 2030.
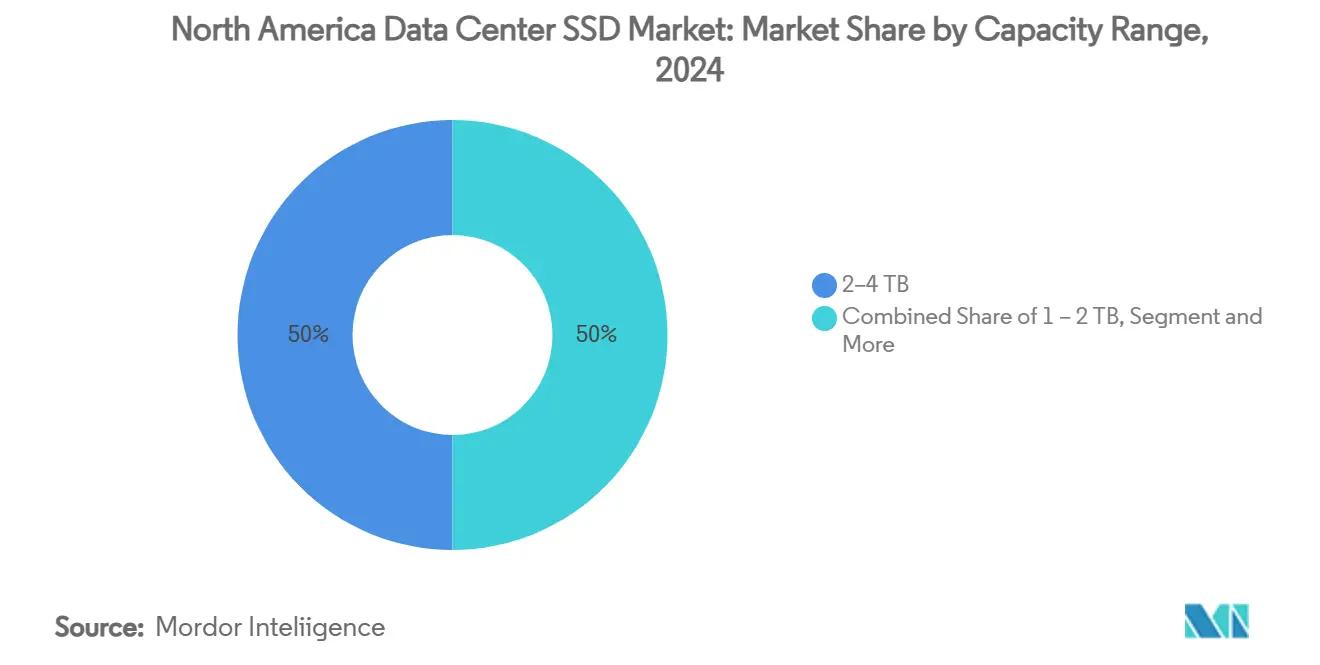
- By capacity, the 2-4 TB class commanded 50% of the North America data center SSD market size in 2024, yet ≥4 TB drives should rise at 27.81% CAGR.
- By end-user, hyperscale cloud providers contributed 60% revenue in 2024, whereas edge data centers register the fastest 28% CAGR through 2030.
Worldwide, activity is shaped by contributions from multiple regions, with North america representing one of the more structurally developed among them. The global report on data center ssd market by Mordor Intelligence reflects how these regional layers combine into a single system.
North America Data Center SSD Market Trends and Insights
Drivers Impact Analysis*
| DRIVER | (~) % IMPACT ON CAGR FORECAST | GEOGRAPHIC RELEVANCE | IMPACT TIMELINE |
|---|---|---|---|
| Explosion of AI and Generative AI workloads fuelling NVMe SSD demand | +8.5% | North America (Northern Virginia, Oregon, Texas) | Short term (≤ 2 years) |
| Rapid transition to PCIe Gen4/5 interfaces accelerating refresh cycles | +6.2% | North America and global hyperscale markets | Medium term (2-4 years) |
| Declining $/GB of 3D TLC/QLC NAND achieving price-parity with HDD | +4.8% | Global, North America leading | Medium term (2-4 years) |
| ESG carbon-neutral mandates favouring energy-efficient all-flash arrays | +3.1% | North America and EU | Long term (≥ 4 years) |
| Edge-data-centre build-outs requiring ruggedised NVMe drives | +2.9% | North America secondary markets | Medium term (2-4 years) |
| CHIPS Act and IRS §179 incentives localising SSD manufacturing | +2.2% | North America | Long term (≥ 4 years) |
| Source: Mordor Intelligence | |||
Explosion of AI and Generative AI workloads fuelling NVMe SSD demand
Large-language-model training now consumes petabyte-scale datasets that require sub-millisecond storage latency. Meta’s deployment of 350,000 NVIDIA H100 GPUs prompted an internal shift to high-bandwidth NVMe tiers to keep GPU utilization above 90%.[1]Meta Platforms, “Building AI Infrastructure at Scale,” about.fb.com Enterprise SSD contract pricing is rising 10% quarter-over-quarter in 2025 as hyperscalers lock in capacity, a trend that shortens qualification cycles and accelerates PCIe Gen5 uptake. AI-optimized SSDs emphasize performance per watt, supplanting cost-per-GB as the dominant metric. The result is a pronounced refresh cadence in the North America data center SSD market, with legacy SATA inventories rapidly phased out. Elevated demand has also expanded supply-chain risk for key components such as PCIe Gen5 retimers, nudging operators toward multi-sourcing frameworks.
Rapid transition to PCIe Gen4/5 interfaces accelerating refresh cycles
PCIe Gen5 doubles Gen4 bandwidth to 14 GB/s and slashes latency for database and AI inference workloads. Western Digital’s 64 TB enterprise SSD showcases Gen5 throughput tuned for compute-intensive environments[2]Western Digital, “Future-Ready PCIe Gen5 SSDs for AI and Analytics,” westerndigital.com. Intel’s Xeon 6 processors paired with Micron Gen5 SSDs record measurable 12% latency gains in real-world pilots. Meanwhile, Silicon Motion previewed a PCIe 6.0 controller with 28 GB/s capability, underlining an interface roadmap that makes Gen3 devices obsolete by decade’s end. Although Gen5 raises power draw, higher IOPS-per-watt justifies adoption for AI clusters. Consequently, the North America data center SSD market logs shorter replacement intervals, boosting value shipments even before unit growth is counted.
Declining $/GB of 3D TLC/QLC NAND achieving price-parity with HDD
Samsung’s path to 1,000-layer QLC uses hafnia ferroelectrics to push petabyte-scale drives that rival HDD economics while outperforming on access latency.[3]Samsung Electronics, “Next-Gen QLC NAND Development,” samsung.com Pure Storage and Micron demonstrated 74% cost savings versus HDD arrays by leveraging G9 QLC NAND and advanced compression algorithms. The National Academies of Sciences projects SSD average selling price at USD 60 per TB in 2025, closing the gap with enterprise HDD offerings. All-flash migrations therefore pivot from tactical to default for new workloads across the North America data center SSD market. Object storage repositories, once HDD-centric, now adopt QLC SSDs, improving warm-data retrieval without compromising TCO.
ESG carbon-neutral mandates favouring energy-efficient all-flash arrays
Corporate disclosures increasingly tie executive compensation to carbon-reduction metrics, elevating storage power efficiency to board-level scrutiny. Pure Storage’s DirectFlash platform lowers power use by 75% compared with HDD systems and cuts failure-related truck rolls, slicing both energy and Scope 3 emissions. Solidigm unveiled liquid-cooled drives that enable fan-less servers and 40% cooling cost savings, a design that resonates with sustainability-focused colocation providers. Data center managers list energy efficiency as the top procurement criterion, a shift that guides SSD vendors to publish performance-per-watt dashboards instead of traditional datasheets. Over time, carbon accounting rules in the EU and select US states will embed energy-efficient storage into compliance checklists, deepening demand for low-power NVMe tiers.
Restraints Impact Analysis*
| RESTRAINTS | (~) % IMPACT ON CAGR FORECAST | GEOGRAPHIC RELEVANCE | IMPACT TIMELINE |
|---|---|---|---|
| NAND price volatility complicating long-term procurement planning | -4.3% | Global with North America exposure | Short term (≤ 2 years) |
| Thermal management challenges of high-power PCIe Gen5/6 SSDs | -2.8% | North America and global hyperscale markets | Medium term (2-4 years) |
| Scarcity of PCIe Gen5 retimers delaying EDSFF mass adoption | -2.1% | North America supply chain | Short term (≤ 2 years) |
| Firmware/security-talent shortage extending qualification cycles | -1.9% | North America (Silicon Valley) | Medium term (2-4 years) |
| Source: Mordor Intelligence | |||
NAND price volatility complicating long-term procurement planning
Substrate shortages triggered double-digit quarterly price swings in 2024, forcing operators to renegotiate supply contracts with shorter lock-in periods. Phison’s leadership pointed to substrate bottlenecks as the principal driver of cost spikes, a view echoed in TrendForce’s 2025 outlook. Smaller colocation firms, lacking volume leverage, struggle to hedge volatility, which tilts purchasing power toward hyperscalers. Some buyers adopt auction-style procurement that re-prices every 60 days, but such agility increases administrative overhead. Consequently, capex planning in the North America data center SSD market faces distortions that could delay all-flash conversions despite demonstrable TCO benefits.
Thermal management challenges of high-power PCIe Gen5/6 SSDs
As PCIe Gen5 SSD controllers breach 20-watt envelopes, traditional air flow fails to keep junction temperatures within 70 °C thresholds. Solidigm’s spring-loaded cold plates illustrate the industry shift to liquid cooling at the device level, bringing a 40% drop in rack-level cooling energy. Yet retrofitting existing data halls is capital intensive, slowing Gen5 penetration in legacy facilities. Operators sometimes down-clock drives or leave bays empty to meet thermal design power constraints, sacrificing density gains promised by EDSFF. These trade-offs temper the near-term expansion rate of the North America data center SSD market until advanced cooling retrofits become mainstream.
*Our forecasts treat driver/restraint impacts as directional, not additive. The impact forecasts reflect baseline growth, mix effects, and variable interactions.
Segment Analysis
By Form Factor: EDSFF Drives Next-Generation Density
The North America data center SSD market recorded 45% revenue from 2.5-inch U.2 in 2024, yet E1.S is on track for a 27% CAGR to 2030. Facebook engineers achieved 67% higher storage density by adopting E1.S, packing 1.2 PB per 1U chassis and improving airflow efficiency. Kioxia’s E3 prototypes project 128 TB per drive by 2026, aligning with hyperscale density roadmaps. In parallel, Solidigm’s 122 TB E3.S offering delivers 84% lower power than HDD arrays, exemplifying the capacity-per-watt leap demanded by AI clusters.
M.2 remains the go-to option for blade servers where footprint overrides capacity, while PCIe add-in cards cater to HPC nodes needing peak bandwidth. The North America data center SSD market gravitates toward form-factor specialization: U.2 for retrofit compatibility, E1.S for front-serviceability at scale, and E3 for ultra-dense racks. Vendors now design thermals around horizontal airflow and offer tool-less carriers that cut swap times to under two minutes.


By Interface: PCIe Gen5 Accelerates Bandwidth Evolution
PCIe Gen4 held 55% market share in 2024, yet Gen5 devices are projected to grow at 30% CAGR, redefining the North America data center SSD market trajectory. Micron’s 6550 ION demonstrated 12 GB/s reads and 5 GB/s writes at 20 watts, a 179% jump over prior-gen drives. SATA persists in cost-bound colocation tiers, while SAS finds niche demand in mission-critical banking applications that favor dual-port reliability.
Retimer scarcity has been a bottleneck but easing supply supports mass EDSFF adoption. Looking forward, PCIe 6.0 controllers promise 28 GB/s throughput, which will synchronize with next-gen GPU interconnect speeds. Consequently, interface selection is becoming intertwined with rack-level power budgets, compelling operators to weigh performance against cooling capacity.
By NAND Technology: QLC Gains Momentum in Capacity-Driven Applications
TLC accounted for 70% revenue in 2024, but QLC is rising at 29% CAGR as controllers improve error correction and wear-leveling. Samsung’s hafnia-based 1,000-layer QLC signals an era of petabyte-class drives that reset economics. DapuStor’s Flexible Data Placement technology reduces write-amplification by up to 38%, extending QLC life to enterprise benchmarks.
Electronics journal research confirms garbage-collection refinements can trim tail latency by 8%-83% in QLC drives, making them suitable for cache-heavy AI workloads. In the North America data center SSD market, SLC and MLC persist only in high-frequency trading and log-capture use cases where endurance trumps capacity.
By Drive Architecture: Write-Intensive Solutions Address AI Workloads
Mixed-use 3-DWPD held 53% share in 2024, yet write-intensive 10-DWPD products will expand at 28% CAGR. Solidigm’s D5-P5336 offers unlimited random write endurance, tailored for checkpoint-heavy model training. Research in Electronics shows Revisiting Erase Operation techniques improve lifetime by 43% and cut latency 12%, underscoring value in controller innovation.
NVMe namespaces now support zoned storage commands, letting applications steer sequential writes that minimize wear. As AI training generates terabytes of checkpoints daily, enterprises increasingly specify 10-DWPD as a baseline, pushing vendors to pair advanced firmware with robust thermal design.
By Capacity Range: High-Capacity Drives Lead Growth
The North America data center SSD market size for 2-4 TB drives captured 50% revenue in 2024, while ≥4 TB units are poised for a 27.81% CAGR. Samsung’s 400-plus-layer V-NAND roadmap and Solidigm’s 122 TB drive highlight a pivot to fewer, larger devices that cut cabling and power per terabyte. Operators consolidate arrays, freeing rack space for GPUs.
Engineering targets now center on petabyte-per-rack design, aided by E3 form factors that dissipate heat more evenly. Smaller capacities survive mainly in boot and log servers, but as price per GB compresses, consolidation gains will phase them out.
By End-User: Edge Data Centers Emerge as Growth Driver
Hyperscalers retained 60% revenue in 2024, yet edge sites grow 28% CAGR as autonomous vehicles, AR/VR, and latency-critical analytics require local compute. SSSTC’s wide-temperature NVMe line underpins rugged deployments, while Discord’s stack merges local SSDs with cloud disks to balance latency and redundancy. Taboola processes 100 TB daily across nine data centers, illustrating content-delivery reliance on high-endurance SSD fleets.
Colocation facilities bridge hyperscale and edge, providing flexible capacity to enterprises seeking opex models. Financial-services data centers maintain stringent compliance demands, keeping dual-port SAS and encryption-at-rest on procurement shortlists. Across segments, procurement shifts from single-vendor frameworks to diversified portfolios that hedge supply risk and optimize cost.
Geography Analysis
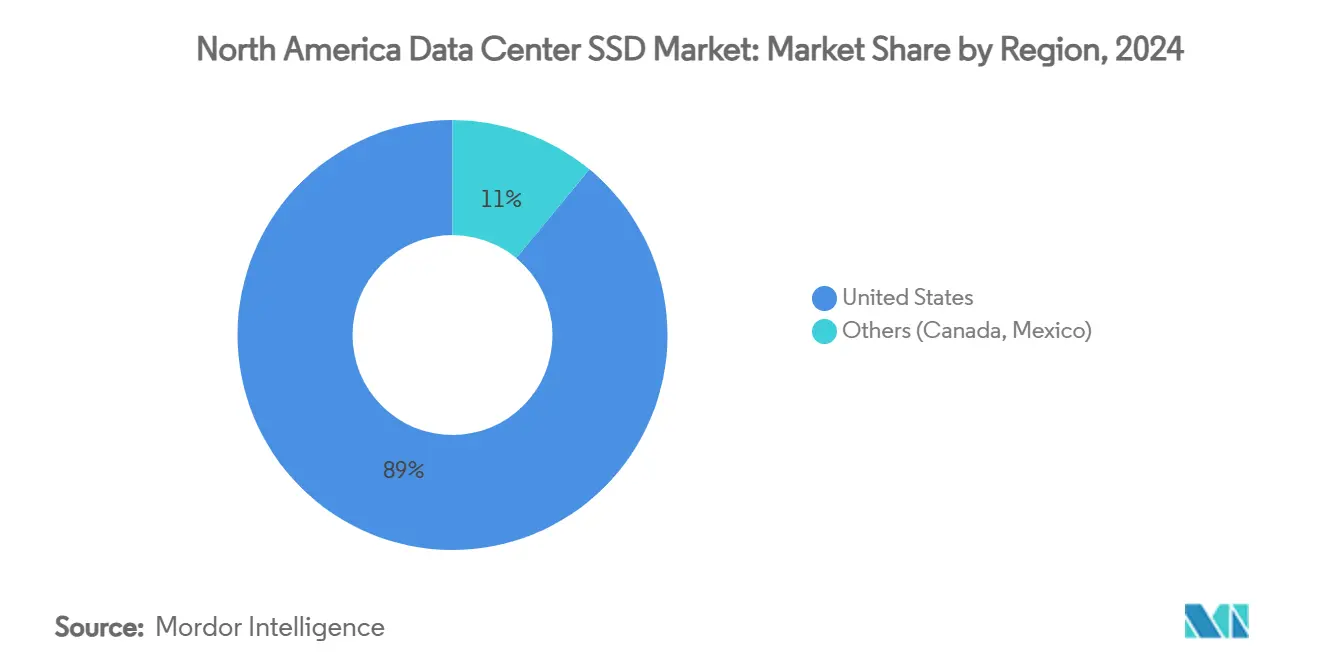
The North America data center SSD market anchors global demand, driven by 3,046.1 MW of capacity in Northern Virginia and a vacancy rate of just 0.76% in 2025. AWS contributed USD 108 billion in cumulative US infrastructure spend, adding USD 38 billion GDP annually and supporting 30,000 jobs. Virginia alone saw USD 21.31 billion GDP impact, highlighting concentrated hyperscale investment.
Power-constrained primary hubs push growth to secondary metros. Atlanta tripled inventory in 2024, while Phoenix and Chicago logged 15%-plus rate hikes as supply lagged demand. Columbus and Reno attract development due to favorable power and land economics, supported by data center tax incentives.
Regional diversification pairs with edge rollouts along 5G corridors. Telecommunications carriers lay new fiber spines, and AI-specific campuses under Project Stargate plan renewable-powered footprints exceeding 500 MW. Despite 6,350 MW under construction across the region, demand consistently outpaces supply, reinforcing long-term expansion of the North America data center SSD market.
Mordor Intelligence provides coverage of the data center ssd market across other key regional markets, including Asia, Europe, and Latin America, each with their regulatory frameworks and demand patterns. Detailed country-level analysis extends to United States and China incorporating local coverage and market participation, as required.
Competitive Landscape
Samsung, Micron, Western Digital, and Kioxia leverage vertical integration—from NAND fabs to controller IP—to anchor a moderate-concentration market. Solidigm, backed by SK hynix, disrupts incumbents through 100-plus-TB drives tailored for AI. Pure Storage invested in CoreWeave to embed its all-flash platform directly into specialized AI clouds, blending hardware and IaaS strategies.
Competition pivots toward workload-optimized SKUs. Vendors file patents around NVMe Flexible Data Placement that slash carbon footprint and boost endurance, positioning sustainability as a competitive wedge. Liquid-cooling innovation emerges as a differentiator; Supermicro pairs Solidigm drives with immersive cooling to enable 100 kW racks for GPU clusters.
Custom silicon from hyperscalers adds pressure: Amazon’s Nitro SSDs and Google’s Axion controller series internalize performance IP, eroding TAM for merchant vendors. Consequently, the North America data center SSD market favors suppliers that co-design firmware, analytics, and security to retain value amid rising commoditization.
North America Data Center SSD Industry Leaders
Samsung Electronics
Solidigm (SK hynix)
Micron Technology
Western Digital
Kioxia
- *Disclaimer: Major Players sorted in no particular order

Recent Industry Developments
- July 2025: CoreWeave acquired Core Scientific in a USD 9 billion stock deal, adding 1.3 GW of capacity.
- July 2025: TeamGroup released the P250Q NVMe SSD with an instant self-destruct circuit for defense workloads.
- May 2025: Supermicro partnered with DataVolt to build AI campuses in Saudi Arabia using direct liquid cooling.
- March 2025: Solidigm launched a fully liquid-cooled enterprise SSD, cutting cooling costs by 40%.


North America Data Center SSD Market Report Scope
| 2.5-inch (U.2/U.3) |
| M.2 |
| PCIe Add-in Card |
| EDSFF (E1.S/E1.L/E3) |
| SATA | |
| SAS | |
| PCIe | PCIe/NVMe Gen3 |
| PCIe/NVMe Gen4 | |
| PCIe/NVMe Gen5 | |
| PCIe/NVMe Gen6 |
| SLC |
| MLC |
| TLC |
| QLC |
| Read-Intensive (1-DWPD) |
| Mixed-Use (3-DWPD) |
| Write-Intensive (10-DWPD) |
| ≤1 TB |
| 1 – 2 TB |
| 2 – 4 TB |
| ≥4 TB |
| Hyperscale /Self-built Cloud Providers |
| Colocation / Carrier-Neutral Facilities |
| Enterprise and Edge Data Centers |
| By Form Factor | 2.5-inch (U.2/U.3) | |
| M.2 | ||
| PCIe Add-in Card | ||
| EDSFF (E1.S/E1.L/E3) | ||
| By Interface | SATA | |
| SAS | ||
| PCIe | PCIe/NVMe Gen3 | |
| PCIe/NVMe Gen4 | ||
| PCIe/NVMe Gen5 | ||
| PCIe/NVMe Gen6 | ||
| By NAND Technology | SLC | |
| MLC | ||
| TLC | ||
| QLC | ||
| By Drive Architecture | Read-Intensive (1-DWPD) | |
| Mixed-Use (3-DWPD) | ||
| Write-Intensive (10-DWPD) | ||
| By Capacity Range | ≤1 TB | |
| 1 – 2 TB | ||
| 2 – 4 TB | ||
| ≥4 TB | ||
| By End-User | Hyperscale /Self-built Cloud Providers | |
| Colocation / Carrier-Neutral Facilities | ||
| Enterprise and Edge Data Centers | ||


Key Questions Answered in the Report
What is the current size of the North America data center SSD market?
The market is valued at USD 17.75 billion in 2025 and is forecast to surge to USD 69.08 billion by 2031.
Which SSD interface is growing fastest in North American data centers?
PCIe Gen5 is expanding at roughly 30% CAGR as operators chase higher bandwidth for AI workloads.
Why are QLC NAND drives gaining traction?
QLC has neared HDD cost parity while offering faster access times, enabling cost-effective all-flash deployments.
How do ESG mandates influence SSD adoption?
Energy-efficient all-flash arrays help organizations meet carbon-reduction goals, making performance-per-watt a top buying criterion.
What is driving edge data center SSD demand?
Latency-sensitive applications such as 5G and real-time analytics require ruggedized NVMe storage close to end users, fueling a 28% CAGR for edge deployments.
Which companies lead the North America data center SSD market?
Samsung, Micron, Western Digital, and Kioxia hold the largest shares, with Solidigm emerging as a high-capacity challenger.
Page last updated on:


