Asia-Pacific Data Center SSD Market Size and Share
Market Overview
| Study Period | 2019 - 2031 |
|---|---|
| Forecast Data Period | 2025 - 2031 |
| Historical Data Period | 2019 - 2023 |
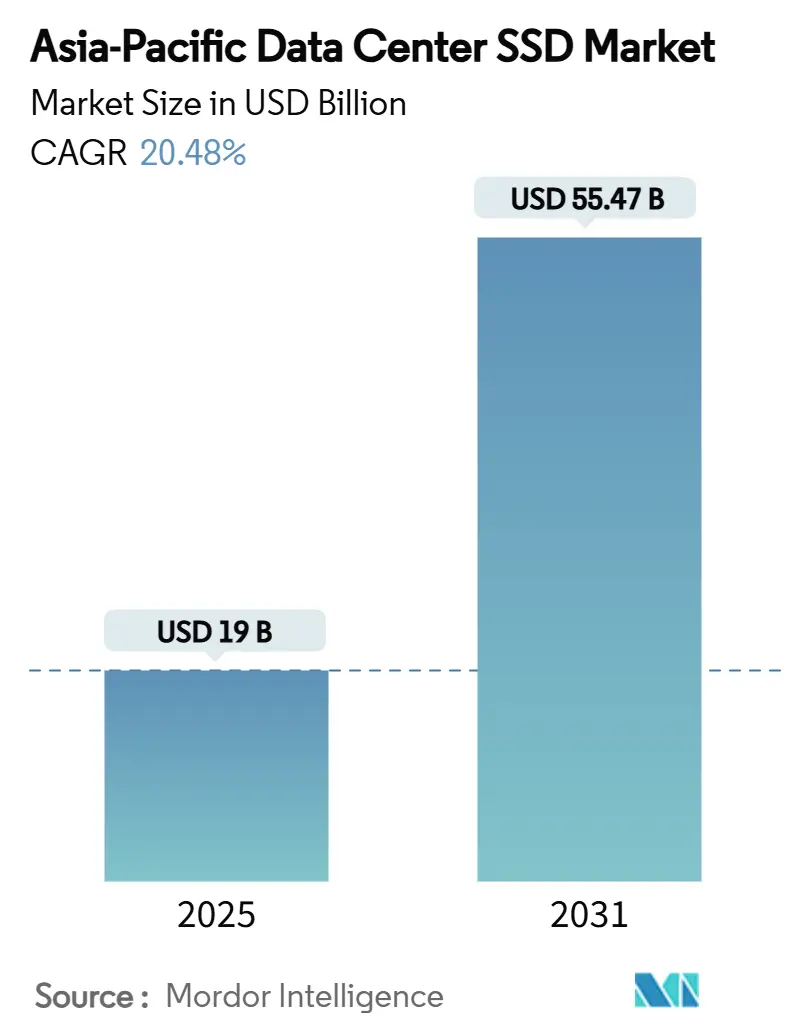
| Market Size (2025) | USD 19 Billion |
| Market Size (2030) | USD 55.47 Billion |
| Growth Rate (2025 - 2031) | 20.48% CAGR |
| Market Concentration | Medium |
Major Players *Disclaimer: Major Players sorted in no particular order Image © Mordor Intelligence. Reuse requires attribution under CC BY 4.0. | |
Asia-Pacific Data Center SSD Market Analysis by Mordor Intelligence
The Asia-Pacific data center SSD market is valued at USD 19,004.98 million in 2025 and is forecast to reach USD 55,475.27 million by 2031, advancing at a 20.48% CAGR; this sentence uses the mandated keywords “market size” and “CAGR.” Near-term expansion is fed by hyperscale cloud build-outs, aggressive AI training roll-outs, and policy incentives that favor flash over spinning disks. Steady NAND cost reductions, combined with localized controller production, support price-parity versus HDDs and unlock new workload classes. Interface upgrades from PCIe Gen4 to Gen5 shorten AI model training cycles and enable denser GPU utilization. Energy-efficiency mandates across Japan, Singapore, and South Korea tilt capital budgets toward SSDs with lower power envelopes. Competitive pressure rises as Chinese suppliers gain share against incumbent global brands through vertically integrated, subsidy-backed production.
Key Report Takeaways
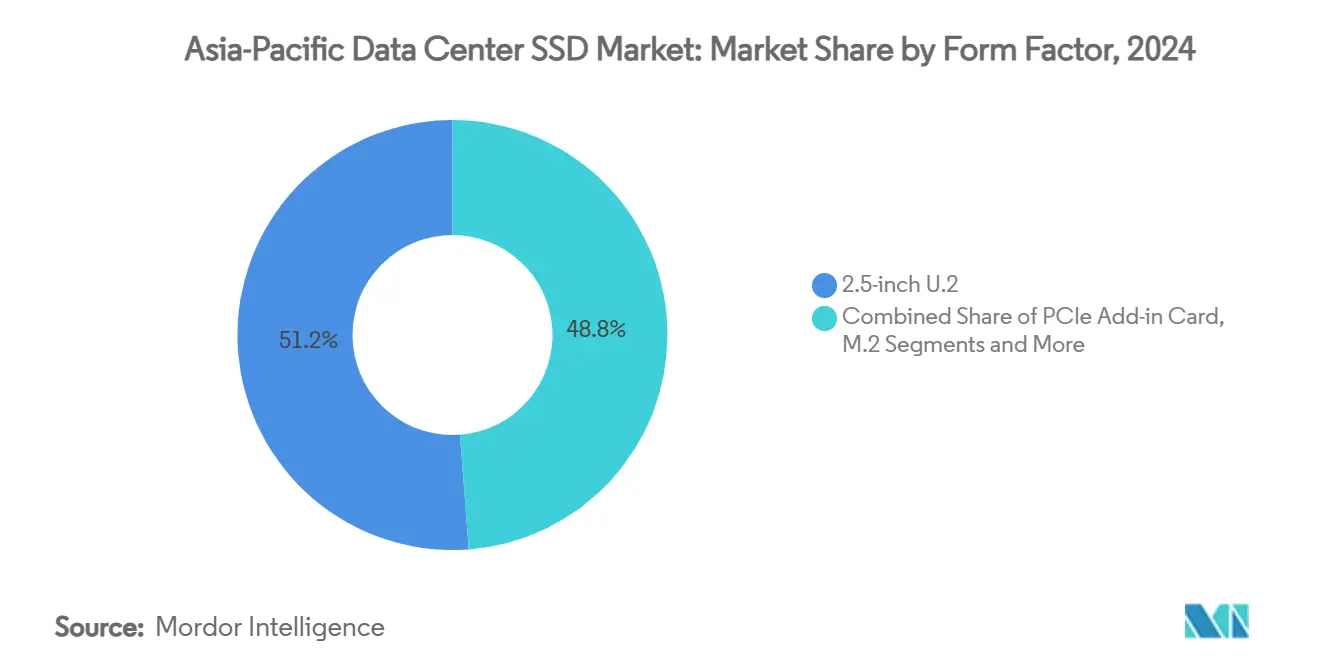
- By form factor, 2.5-inch U.2 drives led with 51.2% revenue share in 2024, while EDSFF E3.S is projected to expand at a 21.21% CAGR to 2030.
- By interface, PCIe/NVMe Gen4 held 75.3% of the Asia-Pacific data center SSD market share in 2024, whereas Gen5 records the highest projected CAGR at 22.50% through 2030.
- By NAND technology, TLC accounted for 78.1% share of the Asia-Pacific data center SSD market size in 2024 and QLC is advancing at a 21.00% CAGR through 2030.
- By drive architecture, read-intensive products captured 60% share in 2024, yet mixed-use variants are forecast to grow fastest at 21.20% CAGR to 2030.
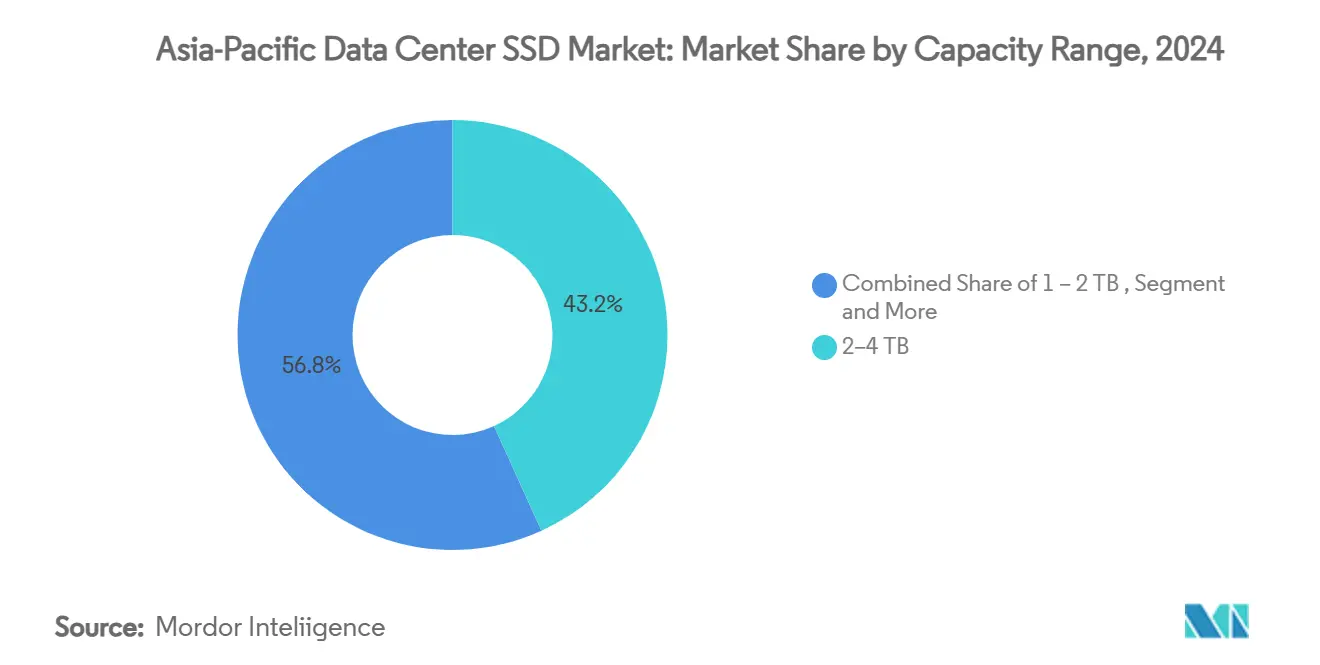
- By capacity range, the 2-4 TB class commanded 43.2% of the Asia-Pacific data center SSD market size in 2024; drives ≥4 TB are set to rise at a 22.81% CAGR between 2025-2030.
Global valuation is built by aggregating outputs from multiple regions, with Asia forming one of the important contributors. Mordor Intelligence's global data center ssd market size report represents that cumulative total.
Asia-Pacific Data Center SSD Market Trends and Insights
Drivers Impact Analysis*
| DRIVER | (~) % IMPACT ON CAGR FORECAST | GEOGRAPHIC RELEVANCE | IMPACT TIMELINE |
|---|---|---|---|
| AI and HPC workloads accelerating NVMe adoption in Tier-1 Chinese cloud DCs | +4.2% | China; spillover to Southeast Asia | Medium term (2-4 years) |
| Carbon-neutral mandates favoring energy-efficient SSD infrastructure | +3.8% | Japan; South Korea; Singapore; Hong Kong | Long term (≥ 4 years) |
| Cloud-vendor migration from hybrid to all-flash architectures | +5.1% | Core APAC markets | Medium term (2-4 years) |
| Subsidized domestic NAND supply driving price-parity versus HDD | +2.9% | China; South Korea | Short term (≤ 2 years) |
| “East Data, West Compute” policy stimulating inter-regional all-flash build-outs | +3.5% | China | Medium term (2-4 years) |
| U.S. export controls catalyzing localization of controller-IC ecosystem | +1.8% | China with regional implications | Long term (≥ 4 years) |
| Source: Mordor Intelligence | |||
AI and HPC Workloads Accelerating NVMe Adoption in Tier-1 Chinese Cloud Data Centers
Chinese hyperscale operators restructure storage layers so AI training clusters receive low-latency flash while data lakes migrate to large-capacity SSD pools. Alibaba Cloud transferred 500 PB from Xiaohongshu in a single migration that relied on NVMe arrays to cut cut-over windows. Memblaze’s PBlaze7 7940 delivers 14 GB/s sequential reads, a level that aligns with GPU throughput requirements. Tibet’s Yajiang-1 site runs 2,000 petaflops on locally sourced renewable power, reflecting how regional energy strategies amplify SSD demand. China’s AI data centers drew 140 billion kWh in 2024 and may triple consumption by 2030, forcing a pivot to flash for efficiency gains.[1]Memblaze’s PBlaze7 7940 delivers 14 GB/s sequential reads, a level that aligns with GPU throughput requirements.
Carbon-Neutral Mandates Favoring Energy-Efficient SSD Infrastructure
Energy codes tighten across Asia-Pacific. China targets PUE below 1.5 by 2025 and renewable energy growth of 10% a year. Micron’s 6550 ION cuts power draw by up to 50% versus peers, saving operators thousands of kilowatt-hours per rack. Equinix and CLP Power trimmed annual energy use 30% at their Sha Tin campus after a storage refresh oriented around high-density flash. National net-zero deadlines set for 2050 lock flash into future procurement plans because mechanical disks cannot hit forthcoming efficiency ratios.[2]Micron’s 6550 ION cuts power draw by up to 50% versus peers, saving operators thousands of kilowatt-hours per rack.
Cloud-Vendor Migration from Hybrid to All-Flash Architectures
Lower NAND pricing and higher workload concurrency drive a wholesale move away from tiered HDD+SSD designs. Pure Storage integrates Micron’s G9 QLC to enable fleets that run cooler while offering latency under 250 µs. Solidigm’s 122 TB SSD lifts per-rack capacity 67% and slashes cooling costs, tipping the total cost equation in favor of all-flash. Japanese enterprises lead the switch, with 2024 shipments up 8.9% after a two-year lull.[3]Pure Storage integrates Micron’s G9 QLC to enable fleets that run cooler while offering latency under 250 µs. All-flash baselines pave the way for software-defined storage that elastically reallocates resources across distributed clouds.
Subsidized Domestic NAND Supply Driving Price-Parity vs. HDD
State support compresses flash pricing. YMTC taped out 160-layer TLC at competitive yields, narrowing cost gaps with global rivals. Samsung and SK Hynix cut wafer starts by 50% in late 2023 then cautiously restored output in 2025 as inventory cleared, nudging contract prices up 10-15%. During Singles’ Day 2024, YMTC’s TiPlus 7100 outsold Samsung on JD.com, signaling market acceptance for domestic enterprise drives. As parity emerges, hyperscalers in China and India accelerate SSD roll-outs for archival and object storage tiers.
Restraint Analysis*
| RESTRAINTS | (~) % IMPACT ON CAGR FORECAST | GEOGRAPHIC RELEVANCE | IMPACT TIMELINE |
|---|---|---|---|
| Aggressive price-erosion compressing vendor margins | −2.8% | Global; acute in China | Short term (≤ 2 years) |
| Slow yield ramp of ≥200-layer 3D-NAND delaying ultra-high-capacity SSDs | −1.9% | South Korea; Japan; China | Medium term (2-4 years) |
| Fragmented domestic standards limiting interoperability | −1.2% | China; regional spillover | Medium term (2-4 years) |
| NAND-controller supply bottlenecks under tech-export restrictions | −1.5% | China with APAC implications | Long term (≥ 4 years) |
| Source: Mordor Intelligence | |||
Aggressive Price-Erosion Compressing Vendor Margins
NAND contract rates rose early 2025 after producer cutbacks, yet a long-run glide path toward commoditization squeezes gross margins. QLC yields still trail TLC by 40 percentage points, lifting per-gigabit costs at precisely the node count where demand surges. Chinese vendors price below cost in strategic accounts to win share, forcing global peers to trim road-map spend. Samsung postponed V10 mass-production to recalibrate capex toward yield optimization rather than layer-count races.
Slow Yield Ramp of ≥200-Layer 3D-NAND Delaying Ultra-High-Capacity SSDs
Physical limits emerge as stacks exceed 200 layers. Each additional deck lifts processing time and defect risks. Samsung targets 400-layer V-NAND later this decade, but processing complexity could defer commercial volumes beyond the current forecast window. Kioxia’s 1,000-layer concept for 2031 underscores how deep RandD is now a prerequisite for future capacity jumps. Consequently, suppliers lean on controller-level compression and system-level tiering rather than raw layer counts to meet capacity road maps.
*Our forecasts treat driver/restraint impacts as directional, not additive. The impact forecasts reflect baseline growth, mix effects, and variable interactions.
Segment Analysis
By Form Factor: EDSFF accelerates density economics
EDSFF drives now account for a rising portion of the Asia-Pacific data center SSD market, while 2.5-inch U.2 units still hold 51.2% share in 2024. The new form factor supports up to 1 PB per 1U shelf, allowing data halls to raise storage per rack without proportionally raising power draw. Hyperscale buyers favor E3.S because its 25 W power envelope suits AI servers with constrained airflow. Meta, Microsoft, and Alibaba have standardized on E1.S for next-generation deployments. Over the forecast, EDSFF’s 21.21% CAGR will shift fleets away from legacy trays as retrofit cycles align with GPU refreshes.
EDSFF adoption re-designs serviceability. Tool-less sleds shorten swap times, and front-of-rack layouts let operators address failures without disturbing neighboring servers. The Asia-Pacific data center SSD market thereby realizes maintenance cost savings that compound over thousands of enclosures. Suppliers that pair EDSFF with QLC achieve unmatched density, giving colocation providers differentiation on cost per terabyte housed.


By Interface: PCIe Gen5 adoption quickens
PCIe Gen4 still holds 75.3% share in 2024, yet Gen5 grows 22.50% per year as GPU clusters migrate to 800 Gbps fabrics. Gen5 doubles lane speed to 32 GT/s, letting a single drive sustain 35 GB/s reads. Chinese vendors already launched 14.9 GB/s prototypes, aligning with U.S. peers. SATA and SAS persist in cold-storage pools but lose relevance for AI. NVMe-over-Fabrics then disaggregates flash across racks, raising utilization while cutting stranded capacity.
Speed is only part of the value. Gen5’s stronger signal integrity allows longer back-plane traces, simplifying board design and lowering bill of materials. For hyperscalers, the Asia-Pacific data center SSD market therefore sees interface upgrades during routine server refreshes, rather than waiting for full facility revamps.
By NAND Technology: QLC finds enterprise footing
TLC technology delivers the balance of endurance and cost, retaining 78.1% share in 2024. Yet QLC expands at 21.00% CAGR as read-heavy AI data lakes balloon. Alibaba Cloud pairs hot-tier TLC with cold-tier QLC inside a CSAL architecture that maintains throughput while clipping storage outlays. The Asia-Pacific data center SSD market size for QLC drives supporting ≥30 TB units is projected to multiply fourfold by 2030, driven by object storage and backup-as-a-service uses.
Endurance concerns ease through smarter controllers that write in SLC mode under burst loads then lazily convert to QLC. YMTC claims new QLC design-wins in domestic compute clouds. TLC remains essential for transactional databases and latency-sensitive financial workloads but cedes bulk capacity roles.
By Drive Architecture: Mixed-use gains share
Read-intensive SKUs held 60% share in 2024 and still dominate CDN caches. Mixed-use drives now grow fastest at 21.20% CAGR because AI clusters alternate between heavy write epochs during model checkpoints and intensive read epochs for inference. A 3 DWPD rating hits that midpoint. The Asia-Pacific data center SSD market thereby sees procurement policies shift toward flexible endurance bands. Write-intensive, 10 DWPD devices remain niche inside logging or high-frequency trading stacks where sustained write performance justifies premium pricing.
By Capacity Range: Ultra-high capacities drive TCO optimization
Drives in the 2-4 TB range hold 43.2% market share; capacities ≥4 TB rise 22.81% annually as rack real estate becomes scarce. Micron’s 61.44 TB E3.S and Solidigm’s 122 TB U.2 lead density metrics. Colocation operators can cut cabinet counts and defer land purchases. The Asia-Pacific data center SSD market size for ≥4 TB devices is projected to eclipse sub-2 TB shipments by 2028. Edge installations and ruggedized servers still favor 1 TB class due to thermal limits and cost targets.
By End-User: Hyperscale share widens
Hyperscale clouds already control 72% of demand and will lift spend at a 22.61% CAGR through 2030. AWS, Alibaba, and Microsoft allocate multi-billion-dollar capex to regional availability zones, incorporating flash as default boot and data volumes. Carrier-neutral colocation sites partner with these clouds, supplying powered shells that host flash-rich AI pods. Enterprise data centers trail as many workloads migrate to public cloud, though financial-services firms keep on-premise arrays for governance reasons. The Asia-Pacific data center SSD market will thus remain oriented toward hyperscale scale-out purchase patterns.
Geography Analysis
China is the largest single buyer, underpinned by the “East Data, West Compute” backbone that links renewable power regions to coastal demand centers. Domestic clouds invested in 449 hyperscale facilities that consumed one-quarter of global data-center electricity in 2024, driving outsized flash uptake. India is the fastest-growing destination, with up to 850 MW new capacity slated by 2026 as AWS deploys USD 12.7 billion and local conglomerates chase 1 GW targets. Japan’s market shows 10% CAGR to reach USD 38.7 billion by 2028, bolstered by sub-1.1 PUE designs and stringent resiliency codes. South Korea merges supply-side semiconductor strength with domestic cloud infrastructure roll-outs, creating a self-reinforcing ecosystem for advanced SSDs. Singapore, Hong Kong, and Thailand form a secondary cluster where green-power certificates and land-scarce zoning accelerate demand for high-density flash. Across these sub-regions, policymakers align tax holidays and power-tariff discounts with net-zero goals, ensuring ongoing preference for SSDs over HDDs.
The Asia-Pacific data center SSD market benefits from intraregional supply-chain integration. Taiwanese controller firms, Japanese substrate vendors, and Korean NAND fabs supply Chinese and Indian system integrators. Trade restrictions on advanced controllers steer Chinese buyers toward localized alternatives, deepening domestic ecosystem maturity but also encouraging dual-sourcing from Southeast Asia. Cross-border interconnect projects create latency-sensitive corridors where all-flash arrays deliver competitive advantage for content delivery and gaming platforms. Maturity dispersion remains pronounced; while Tokyo and Shanghai field Tier 4 readiness, emerging metros like Ho Chi Minh City and Hyderabad focus on Tier 3 builds that balance cost and uptime.
Coverage of the data center ssd market by Mordor Intelligence spans a wide geographic footprint, with regional analysis available for Latin America, Middle East, and Africa, alongside detailed country-level intelligence for China and United States, each shaped by local operating conditions.
Competitive Landscape
Market concentration is moderate as international giants contend with subsidy-backed regional entrants. Samsung, Kioxia, and Western Digital retain brand preference for mission-critical arrays, yet Chinese suppliers such as YMTC and Longsys accelerate share gains by bundling SSDs with domestic server platforms. Huawei coordinates a consortium to localize high-bandwidth memory by 2026, which could reshape controller architecture and tilt the Asia-Pacific data center SSD market toward vertically integrated stacks. Solidigm exited consumer lines to focus on enterprise, aligning RandD toward 100 TB-class drives. Micron positions QLC density leadership alongside energy-efficiency branding that resonates with Japan’s carbon rules. ATP Electronics finds white-space in rugged edge nodes, releasing extended-temperature models for industrial AI.
Strategic plays revolve around form-factor differentiation and firmware innovation rather than raw NAND layer counts. EDSFF leadership offers competitive moat through chassis co-designs with hyperscalers. Controller firmware tuned for AI training workloads, such as adaptive read-ahead for transformer models, becomes a key selling point. Vendor alliances proliferate; Western Digital expanded an Open Composable lab so partner SSD brands can prove interoperability inside disaggregated storage fabrics. Investment flows signal regional optimism: ST Telemedia raised USD 1.75 billion to add 1.7 GW capacity and will source flash directly from multiple OEMs to hedge supply disruptions.
Asia-Pacific Data Center SSD Industry Leaders
Samsung Electronics
Kioxia
Tencent Cloud
Seagate Technology Holdings plc
Lenovo Group Ltd.
- *Disclaimer: Major Players sorted in no particular order

Recent Industry Developments
- March 2025: Kioxia introduced the LC9 Series 122.88 TB NVMe SSD with BiCS FLASH 8 3D NAND and PCIe 5.0 interface, targeting AI model training clusters.
- January 2025: Pure Storage and Micron deepened collaboration around G9 QLC NAND to build energy-efficient all-flash systems for hyperscale clouds.
- December 2024: SK hynix rolled out the PS1012 U.2 SSD optimized for AI inference and checkpoint workloads within enterprise environments.
- November 2024: ST Telemedia Global Data Centres secured USD 1.75 billion from a KKR-led consortium to expand its 95-site, 1.7 GW regional platform.


Asia-Pacific Data Center SSD Market Report Scope
| 2.5-inch (U.2/U.3) |
| M.2 |
| PCIe Add-in Card |
| EDSFF (E1.S / E1.L / E3) |
| SATA | |
| SAS | |
| PCIe | PCIe/NVMe Gen3 |
| PCIe/NVMe Gen4 | |
| PCIe/NVMe Gen5 | |
| PCIe/NVMe Gen6 |
| SLC |
| MLC |
| TLC |
| QLC |
| Read-Intensive (1-DWPD) |
| Mixed-Use (3-DWPD) |
| Write-Intensive (10-DWPD) |
| ≤1 TB |
| 1 – 2 TB |
| 2 – 4 TB |
| ≥4 TB |
| Hyperscale Cloud Providers |
| Colocation / Carrier-Neutral Facilities |
| Enterprise and Financial-Services Data Centers |
| By Form Factor | 2.5-inch (U.2/U.3) | |
| M.2 | ||
| PCIe Add-in Card | ||
| EDSFF (E1.S / E1.L / E3) | ||
| By Interface | SATA | |
| SAS | ||
| PCIe | PCIe/NVMe Gen3 | |
| PCIe/NVMe Gen4 | ||
| PCIe/NVMe Gen5 | ||
| PCIe/NVMe Gen6 | ||
| By NAND Technology | SLC | |
| MLC | ||
| TLC | ||
| QLC | ||
| By Drive Architecture | Read-Intensive (1-DWPD) | |
| Mixed-Use (3-DWPD) | ||
| Write-Intensive (10-DWPD) | ||
| By Capacity Range | ≤1 TB | |
| 1 – 2 TB | ||
| 2 – 4 TB | ||
| ≥4 TB | ||
| By End-User | Hyperscale Cloud Providers | |
| Colocation / Carrier-Neutral Facilities | ||
| Enterprise and Financial-Services Data Centers | ||


Key Questions Answered in the Report
What is the current value of the Asia-Pacific data center SSD market?
The market is valued at USD 19 billion in 2025 and is projected to climb to USD 55.5 billion by 2031.
Which end-user group is expanding fastest?
Hyperscale cloud providers post a 22.61% CAGR through 2030 as they build AI-ready capacity across the region.
Why are EDSFF drives gaining traction?
EDSFF raises storage density to 1 PB per 1U shelf and supports higher power envelopes, making it ideal for GPU-heavy AI servers.
How do carbon-neutral mandates influence SSD demand?
Regulations that target lower PUE and net-zero emissions push operators toward energy-efficient SSDs that consume less power than HDDs.
What restrains ultra-high-capacity SSD roll-outs?
Slow yield ramps on ≥200-layer 3D NAND and ongoing controller supply constraints delay commercial volumes of 100 TB-class drives.
Which interface will dominate new deployments by 2026?
PCIe Gen5 is expected to become standard as it delivers up to 35 GB/s throughput necessary for large AI models.
Page last updated on:


