Africa Data Center SSD Market Size and Share
Market Overview
| Study Period | 2019 - 2031 |
|---|---|
| Forecast Data Period | 2025 - 2031 |
| Historical Data Period | 2019 - 2023 |
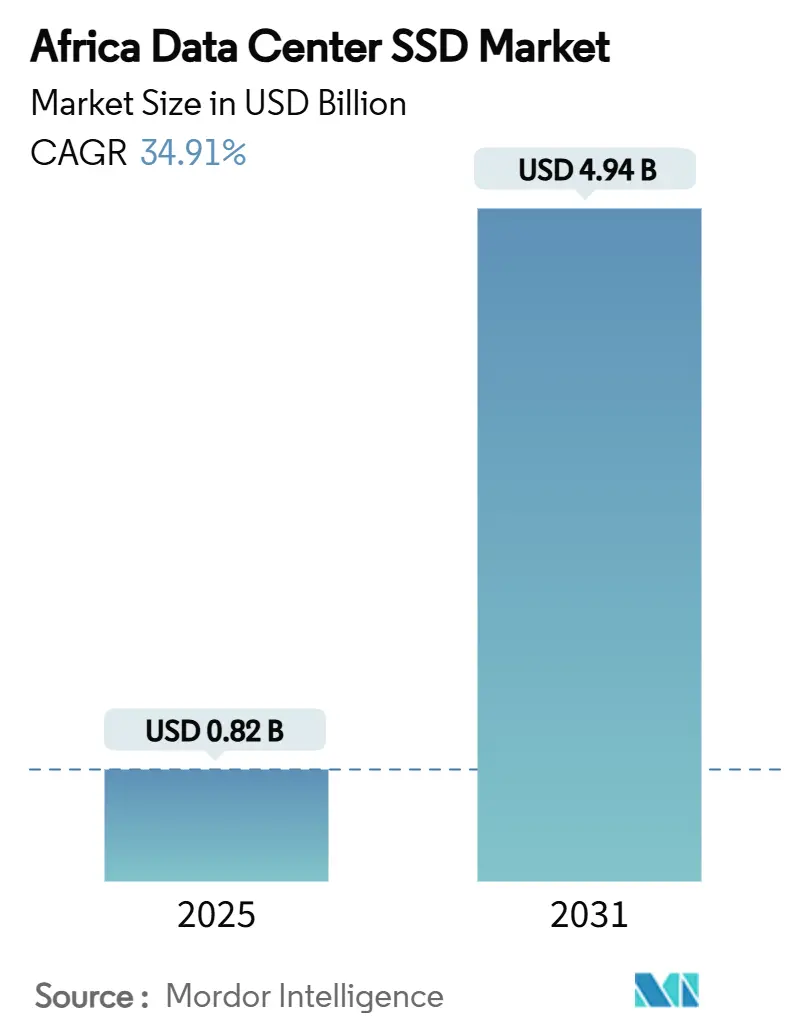
| Market Size (2025) | USD 0.82 Billion |
| Market Size (2031) | USD 4.94 Billion |
| Growth Rate (2025 - 2031) | 34.91% CAGR |
| Market Concentration | Medium |
Major Players
*Disclaimer: Major Players sorted in no particular order Image © Mordor Intelligence. Reuse requires attribution under CC BY 4.0. |
|
Africa Data Center SSD Market Analysis by Mordor Intelligence
The Africa data center SSD market size stands at USD 819.70 million in 2025 and is forecast to reach USD 4,941.85 million by 2031, expanding at a 34.91% CAGR over 2025-2031. The surge results from hyperscale build-outs, data-sovereignty mandates and the rapid migration of AI workloads to flash-optimised storage. South Africa anchors most regional deployments because of mature connectivity, while Nigeria’s fintech boom catalyses new capacity. PCIe Gen5 interfaces, TLC NAND and mixed-use drives form the baseline specification for new racks, yet EDSFF form factors and QLC densities are scaling fastest. Intermittent grid power, NAND price swings and a skills gap in advanced fabrics temper growth, but they also trigger innovation in solar-powered campuses and local support networks.
Key Report Takeaways
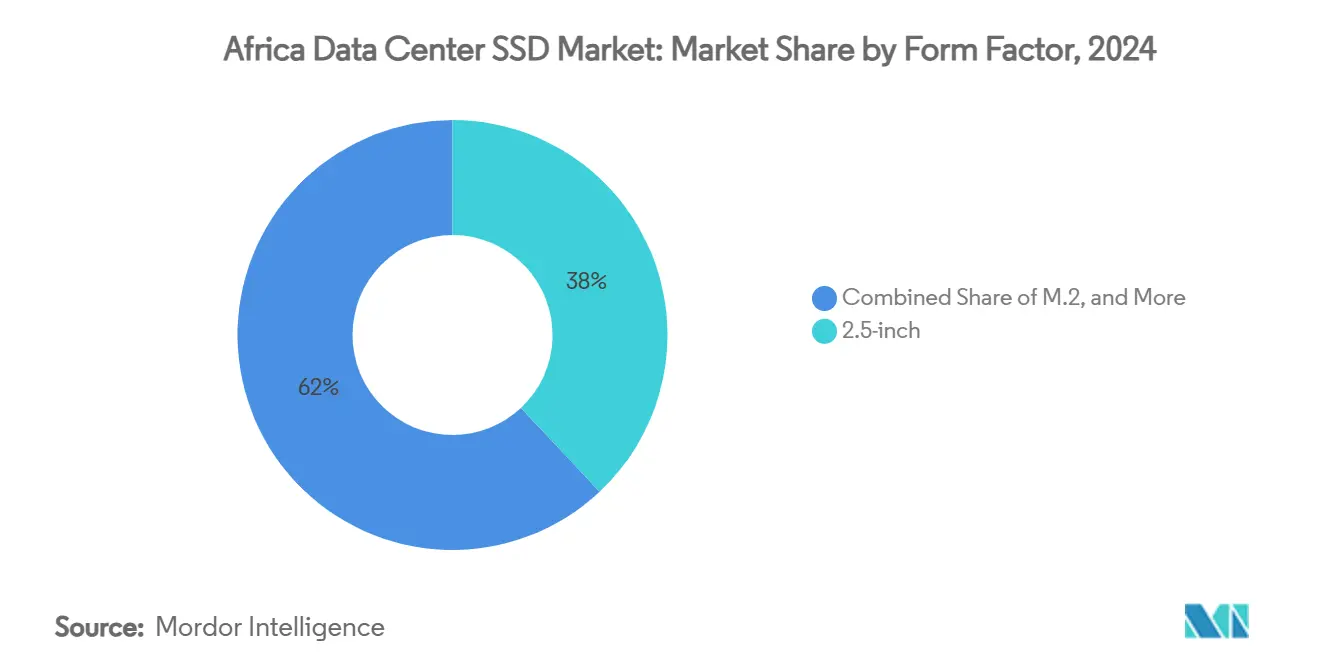
- By form factor, 2.5-inch drives accounted for 38% of Africa data center SSD market share in 2024, whereas EDSFF is projected to post a 27.8% CAGR through 2031.
- By interface, PCIe led with 55% revenue share in 2024; SATA and SAS trail while PCIe maintains the highest growth at 21.4% CAGR to 2031.
- By NAND technology, TLC captured 62% share in 2024, while QLC is forecast to advance at 26.1% CAGR over the same horizon.
- By drive architecture, mixed-use models held 49% share in 2024, as read-intensive drives are expected to expand at 18.9% CAGR.
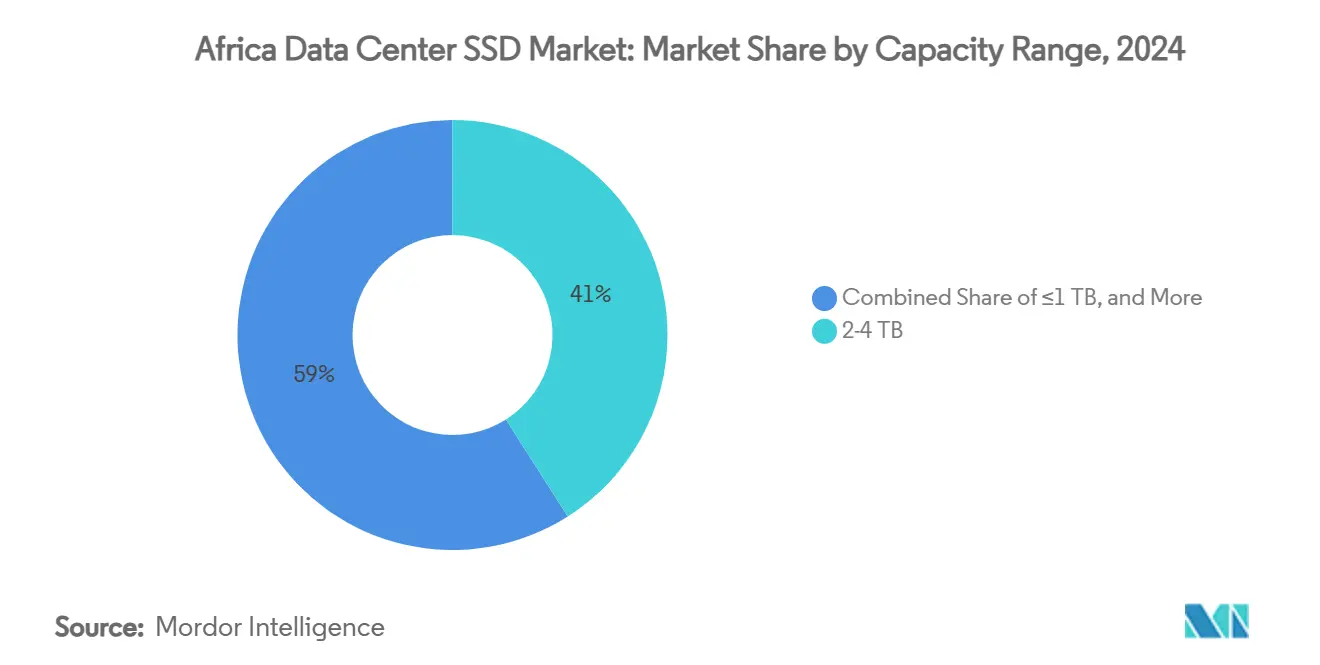
- By capacity band, the 2-4 TB range commanded 41% of Africa data center SSD market size in 2024 and the ≥4 TB tier is poised for 24.7% CAGR growth.
- By end-user, hyperscale cloud providers represented 53% revenue in 2024, yet edge-cloud facilities are on track for a 23.3% CAGR.
- By geography, South Africa led with 57% share in 2024; Nigeria is projected to grow the fastest at 29.2% CAGR through 2031.
National and regional developments in Africa connect with activity unfolding across other parts of the world. In the global data center ssd market coverage, Mordor Intelligence integrates these into a single analytical framework.
Africa Data Center SSD Market Trends and Insights
Drivers Impact Analysis*
| Driver | ( ~ ) % Impact on CAGR Forecast | Geographic Relevance | Impact Timeline |
|---|---|---|---|
| African hyperscale and colocation boom | +8.50% | South Africa, Nigeria, Kenya, Egypt | Medium term (2-4 years) |
| Declining $/GB of 3D-NAND | +6.20% | Nigeria, Kenya | Short term (≤ 2 years) |
| AI/analytics refresh to PCIe 5.0 | +4.80% | Nigeria, South Africa, Kenya | Medium term (2-4 years) |
| Digital-sovereignty legislation | +3.70% | Nigeria, Kenya, ECOWAS | Long term (≥ 4 years) |
| New 2Africa and Equiano subsea cables | +5.10% | West and East African coasts | Medium term (2-4 years) |
| Solar-powered data-center initiatives | +2.90% | Morocco, Egypt, South Africa | Long term (≥ 4 years) |
| Source: Mordor Intelligence | |||
African Hyperscale and Colocation Boom Elevating NVMe Demand
Hyperscale operators are underpinning the Africa data center SSD market through investments exceeding USD 1 billion per campus, with facilities in Johannesburg, Lagos and Nairobi already adopting 30 MW-plus blocks. Operators insist on NVMe SSDs to meet latency service-level objectives and are standardising on PCIe 5.0 across new pods. Capacity expansions by Teraco to 228 MW illustrate how storage density now dictates competitive positioning, especially when rack power budgets approach 50 kW [1]Teraco, "Teraco announces JB7 and a new R8 billion syndicated loan," teraco.co.za. Colocation providers replicate hyperscale best practices, offering pre-wired NVMe enclosures that accelerate tenant onboarding. The result is a supply pinch for enterprise NVMe drives, which in turn raises ASPs but cements NVMe as the default interface. Regional governments welcome these builds because local sovereign-cloud zones comply with national data legislation and stimulate skilled jobs.
Falling $/GB of 3D-NAND Bringing SSDs to Price-Parity with Performance HDDs
Layer counts topping 400 in 3D-NAND stacks have cut enterprise SSD prices to USD 0.25-0.30 per GB, erasing earlier cost barriers for African buyers [2]Source: Blocks and Files, “Samsung Developing 400-Plus-Layer 3D NAND,” blocksandfiles.com. Operators that formerly split workloads between flash and spinning media now purchase all-flash arrays outright, citing the 60% reduction in cooling overhead demonstrated in Gijima’s estate. NAND cost declines also flatten capacity skews, letting 15 TB and 30 TB drives enter mainstream contracts. Price elasticity is further amplified by regional import-duty exemptions for renewable-power data centers, a policy adopted in Kenya and Ghana. Overall, the Africa data center SSD market gains a broader customer base as mid-tier telcos and universities finally deem flash affordable for hot data.
AI/Analytics Workloads in Fintech and Telecom Spurring PCIe 5.0 Refreshes
Africa’s mobile-payment ecosystems settle hundreds of millions of daily micro-transactions that run fraud-scoring models in real time. Nigerian platforms such as OPay require 12 GB/s per host to keep decision latency under 800 µs. PCIe 5.0 SSDs rated at 14 GB/s sequential throughput thus become mandatory. Telecom operators upgrading to 5G stand-alone cores apply identical specs for user plane functions and edge-content caches, pushing sustained demand for >60 TB PCIe Gen5 drives. Vendors that can guarantee supply of these parts capture high-margin design wins, lifting the Africa data center SSD industry toward advanced fabric adoption. Edge-AI inferencing at retail and health-care branches follows a similar trajectory, cultivating a mass market for compact PCIe 5.0 add-in cards.
Digital-Sovereignty Laws Localizing Storage In-Country
Regulations such as Nigeria’s Data Protection Act 2023 prohibit sensitive datasets from leaving national borders. Multinationals must therefore lease or build in-country racks, translating directly into fresh flash-storage orders. Because mirrored copies across availability zones are compulsory, capacity footprints often double relative to offshore allocations. SSD vendors gain from encryption features that satisfy legal provisions on data security at rest. Countries continue to refine cross-border clauses, but the near-term effect is clear: the Africa data center SSD market adds domestic nodes faster than previously forecast. Laws also spur a services layer local wipe-and-shred providers and certified RMA depots that deepens ecosystem resilience.
Restraints Impact Analysis*
| Restraint | ( ~ ) % Impact on CAGR Forecast | Geographic Relevance | Impact Timeline |
|---|---|---|---|
| Intermittent grid power sustaining HDD tiers | -4.20% | Nigeria, Kenya, Ghana | Medium term (2-4 years) |
| NAND price volatility squeezing margins | -3.80% | Continent-wide | Short term (≤ 2 years) |
| Sparse RMA depots inflating TCO | -2.10% | Rest of Africa (ex-SA, NG) | Long term (≥ 4 years) |
| NVMe-oF and CXL skills gap | -1.90% | Major tech hubs | Medium term (2-4 years) |
| Source: Mordor Intelligence | |||
Intermittent Grid Power Sustaining HDD-Friendly Cold-Storage Tiers
Frequent brownouts across West Africa force operators to retain spinning-disk arrays for archival datasets that tolerate downtime. Although flash density rises, the economics of diesel backup for mostly idle data remains unfavourable. Hybrid topologies persist, diluting pure-SSD wallet share in some builds. Utility reforms proceed slowly, so greenfield projects often dedicate allocations to performance tiers first, delaying wholesale HDD replacement.
NAND Price-Volatility Compressing Vendor and Integrator Margins
March 2025 spot quotes for enterprise NAND rose more than 10%, prompting several African buyers to defer Q1 SSD orders. Local currency depreciation compounds the effect, eroding integrator margins when contracts are denominated in USD. Vendors mitigate risk via quarterly price locks, yet smaller resellers struggle with inventory swings. Prolonged volatility can dampen the Africa data center SSD market expansion trajectory, especially among self-funded enterprises.
*Our forecasts treat driver/restraint impacts as directional, not additive. The impact forecasts reflect baseline growth, mix effects, and variable interactions.
Segment Analysis
By Form Factor: Enterprise Density Drives EDSFF Transition
The 2.5-inch format secured 38% of 2024 revenue as legacy rack servers remain widespread, equating to USD 311 million of Africa data center SSD market size that year. Shipments, however, trend toward slimline E1.S and E3.L devices because hyperscale aisles are moving to 48 V power backplanes. EDSFF’s 27.8% CAGR reflects its superior airflow path and signal integrity, welcome in facilities where ambient temperatures breach 30 °C.
Continued adoption stems from the need to push 60 TB per device without exceeding 25 W, a spec conventional U.2 carriers struggle to meet. EDSFF sleds also improve serviceability, letting technicians swap blades from the cold aisle and reduce mean-time-to-service. The Africa data center SSD market therefore witnesses co-existence rather than abrupt replacement; edge enclosures and micro-branches remain on M.2 cards for weight and cost reasons, while PCIe add-in cards target GPU servers that cannot surrender a front bay.


By Interface: PCIe Dominance Accelerates with 5.0 Adoption
PCIe captured 55% revenue in 2024 and is forecast to compound at 21.4% annually as Gen5 lanes double throughput to 32 GT/s. Enterprises embracing containerised analytics stipulate 4 million random IOPS per node, a figure only NVMe on PCIe can sustain.
SATA persists when rebuild windows exceed eight hours or when controllers max out at 6 Gb/s. SAS enjoys niche loyalty among telcos running legacy Unix hosts, but its cost premium over PCIe narrows procurement appetite. As controller vendors ship native CXL support, PCIe will underpin pooled memory fabrics, deepening its lock-in. The Africa data center SSD market thus orients R and D budgets to Gen5 and Gen6, relegating other interfaces to maintenance mode.
By NAND Technology: TLC Balances Performance and Economics
TLC contributed 62% revenue in 2024, mapping to 70 PB shipped into African racks. Operators choose TLC for 1-DWPD endurance that satisfies mixed database and log-write patterns.
QLC, nonetheless, expands at 26.1% CAGR owing to AI training datasets and high-churn video libraries. Vendors mitigate QLC’s write limits by shipping smarter flash-translation layers and dynamic SLC caching. SLC and MLC persist in core banking systems that cannot risk uncorrectable-bit errors. Overall, Africa data center SSD market expectations revolve around TLC as the anchor, while QLC opens ultra-high-density tiers for content and analytics.
By Drive Architecture: Mixed-Use Flexibility Meets Diverse Workloads
Mixed-use drives held 49% share in 2024, reflecting Africa’s heterogeneous workload mix—payments, IoT telemetry and ERP snapshots often co-resident in the same cluster. These SKUs offer 3 DWPD and cost-balanced capacity points.
Read-intensive products, estimated to deliver an 18.9% CAGR, find traction in edge caches and CDN PoPs that hit 95% read ratios. Write-intensive SKUs remain defenders of OLTP databases in major banks. Workload-aware tiering software automates placement, yet procurement heads still specify endurance classes alongside capacity. This keeps the Africa data center SSD market stratified across endurance tiers despite convergence in NAND-layer counts.
By Capacity Range: High-Capacity Drives Address Data Growth
The 2-4 TB band generated 41% of 2024 shipments, valued at USD 335 million of Africa data center SSD market size. The segment offers a familiar sweet spot where price, density and redundancy intersect within existing RAID groups.
Drives ≥4 TB, however, post a 24.7% CAGR as AI workflows now ingest 20 TB data lakes per model iteration. Micron’s 60 TB E3.S illustrates what power-efficient capacity looks like in African climates where kilowatt hour costs can reach USD 0.36. Operators revise data-protection schemes—erasure rather than mirroring—to mitigate rebuild times at such sizes. The bottom tier, ≤1 TB, remains relevant for branch appliances and virtualised network-functions blades.
By End-User: Hyperscale Leadership Drives Market Evolution
Hyperscalers consumed 53% of 2024 shipments and will command similar dominance through 2030, although edge-cloud nodes within telco shelters grow 23.3% annually. Enterprises and financial institutions represent stable double-digit demand as compliance drives on-premises investment.
Colocation providers position their racks as transparent extensions of hyperscale availability zones, taking in overflow from bursty AI modelling campaigns. Diversification of demand ensures vendors cannot ignore any tier: banks insist on certified FIPS encryption, telcos need NEBS compliance, while SaaS entrants weigh watts per TB above all else. Such variability underpins resilience in the broader Africa data center SSD market.
Geography Analysis
South Africa accounted for 57% of 2024 spending, underpinned by a mature carrier-hotel ecosystem and subsea cable landings in Cape Town and Durban. Government tax incentives for renewable micro-grids further protect operating margins.
Nigeria leads growth at 29.2% CAGR as fintech volumes surge and the Data Protection Act mandates sovereign hosting. Operators in Lagos cluster near 330 kV transmission nodes for grid stability, yet still deploy 10 MW diesel reserves to shield flash arrays from frequency dips.
Kenya capitalises on geothermal energy resources to lure hyperscale commitments exceeding USD 1 billion. Addis Ababa, Cairo and Casablanca follow, each blending renewable PPAs with strategic cable access. The Rest of Africa segment benefits from new cable spurs and diaspora cloud adoption, but faces skills shortages that slow complex flash-fabric roll-outs. Combined, these geographies keep the Africa data center SSD market on an accelerated adoption curve compared with other emerging regions.
Mordor Intelligence's coverage of the data center ssd market extends across other regions including Europe, Latin America, and Middle East, while country-specific intelligence is also available for United States and China, each offering a view on the jurisdiction-level dynamics as applicable.
Competitive Landscape
The market remains moderately fragmented, although top providers consolidate share through local alliances. Samsung, Western Digital and Micron collectively exceed 45% shipment share, leveraging end-to-end portfolios from client to enterprise lines. Kioxia and SK Hynix tap capacity-dense QLC to differentiate in AI archives, while Pure Storage and NetApp partner with regional ISPs for managed flash services.
Strategic moves include Digital Realty’s USD 3.5 billion acquisition of Teraco, which secures captive demand for certified Gen5 drives. Micron’s 60 TB launch demonstrates an arms race in rack density, crucial where power costs can cap expansion. Vendors pair hardware with professional-services bundles focused on compliance, reflecting customer priority for turn-key sovereignty solutions.
New entrants target edge-cloud clusters with ruggedised E1.S kits rated for 55 °C inlet temperatures. Incumbents counter with warranty extensions matched to solar deployments, reinforcing lock-in where uptime risks exceed tolerance. As consolidation continues, local system integrators pivot toward value-added services—data erasure, firmware audit and cold-spare inventory to remain relevant in the Africa data center SSD market.
Africa Data Center SSD Industry Leaders
-
Samsung Electronics Co., Ltd.
-
Kioxia Corporation
-
Western Digital Corporation
-
Micron Technology, Inc.
-
Huawei Technologies Co., Ltd. (FusionSSD)
- *Disclaimer: Major Players sorted in no particular order

Recent Industry Developments
- March 2025: Kioxia unveiled CM9 PCIe 5.0 NVMe SSDs up to 61.44 TB for AI workloads.
- March 2025: Microsoft allocated USD 297 million to enlarge South African cloud and AI zones by 2027.
- January 2025: Western Digital reported USD 4.29 billion fiscal Q2 revenue; cloud drove 55%.
- December 2024: Google joined a USD 90 million cash injection into Cassava Technologies to scale African capacity.
- November 2024: Teraco secured ZAR 8 billion debt to raise capacity to 228 MW and fund a solar farm.


Africa Data Center SSD Market Report Scope
| 2.5-inch (U.2/U.3) |
| M.2 |
| PCIe Add-in Card |
| EDSFF (E1.S / E1.L / E3) |
| SATA |
| SAS |
| PCIe |
| SLC |
| MLC |
| TLC |
| QLC |
| Read-Intensive (1 DWPD) |
| Mixed-Use (3 DWPD) |
| Write-Intensive (10 DWPD) |
| ≤ 1 TB |
| 1-2 TB |
| 2-4 TB |
| ≥ 4 TB |
| Hyperscale Cloud Providers |
| Colocation / Carrier-Neutral Facilities |
| Enterprise and Financial-Services DCs |
| South Africa |
| Nigeria |
| Kenya |
| Egypt |
| Morocco |
| Rest of Africa |
| By Form Factor | 2.5-inch (U.2/U.3) |
| M.2 | |
| PCIe Add-in Card | |
| EDSFF (E1.S / E1.L / E3) | |
| By Interface | SATA |
| SAS | |
| PCIe | |
| By NAND Technology | SLC |
| MLC | |
| TLC | |
| QLC | |
| By Drive Architecture | Read-Intensive (1 DWPD) |
| Mixed-Use (3 DWPD) | |
| Write-Intensive (10 DWPD) | |
| By Capacity Range | ≤ 1 TB |
| 1-2 TB | |
| 2-4 TB | |
| ≥ 4 TB | |
| By End-User | Hyperscale Cloud Providers |
| Colocation / Carrier-Neutral Facilities | |
| Enterprise and Financial-Services DCs | |
| By Country | South Africa |
| Nigeria | |
| Kenya | |
| Egypt | |
| Morocco | |
| Rest of Africa |


Key Questions Answered in the Report
What is the current value of the Africa data center SSD market?
The market is valued at USD 819.70 million in 2025 and is set to rise sharply over the next five years.
Which country leads spending on data center SSDs in Africa?
South Africa accounted for 57% of regional revenue in 2024 owing to its established data-center ecosystem and reliable infrastructure.
Which form factor is growing fastest?
EDSFF (E1.S/E1.L/E3) drives show the highest growth, forecast at 27.8% CAGR through 2030 as operators seek higher density per rack.
What role do digital-sovereignty laws play?
National data-protection acts in Nigeria and Kenya compel organisations to host data locally, directly lifting demand for in-country SSD capacity.
How does NAND price volatility affect African buyers?
Price swings compress integrator margins and can delay upgrade projects, especially in markets where purchasing budgets are sensitive to USD denominated imports.
Which end-user segment generates most demand?
Hyperscale cloud providers represent 53% of 2024 shipments, but edge-cloud nodes within telecom networks are the fastest-growing customer group.
Page last updated on:


