Data Center SSD Market Size and Share
Market Overview
| Study Period | 2019 - 2031 |
|---|---|
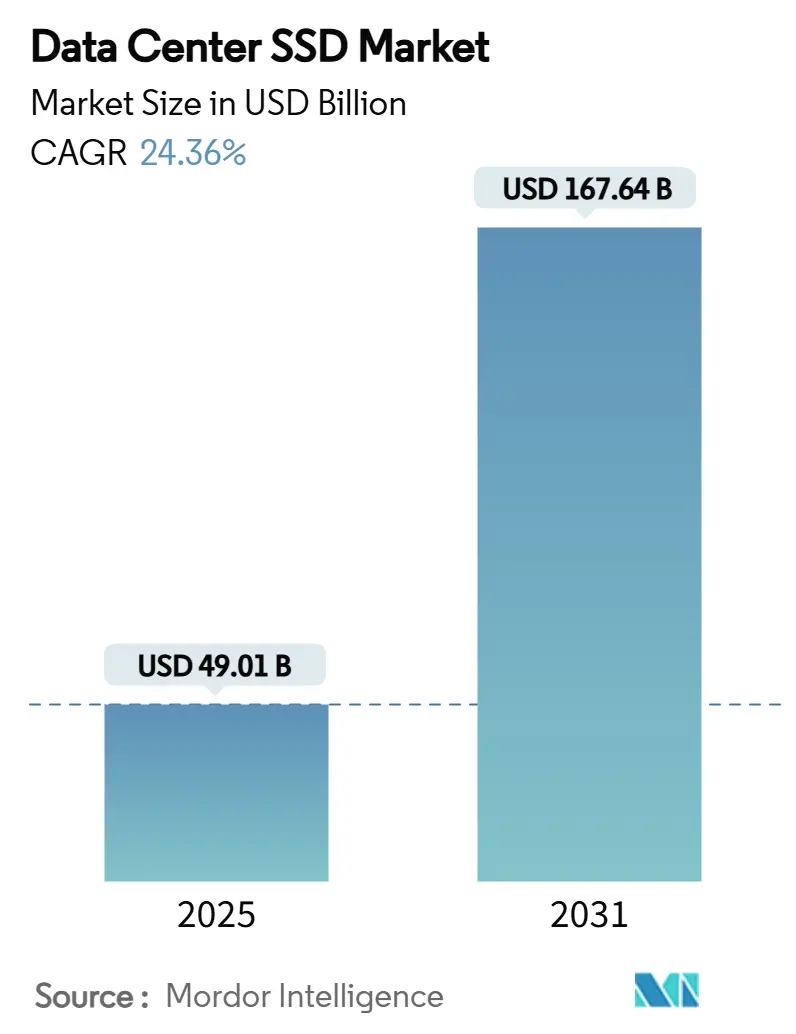
| Market Size (2025) | USD 49.01 Billion |
| Market Size (2031) | USD 167.64 Billion |
| Growth Rate (2025 - 2031) | 24.36% CAGR |
| Fastest Growing Market | North America |
| Largest Market | Asia Pacific |
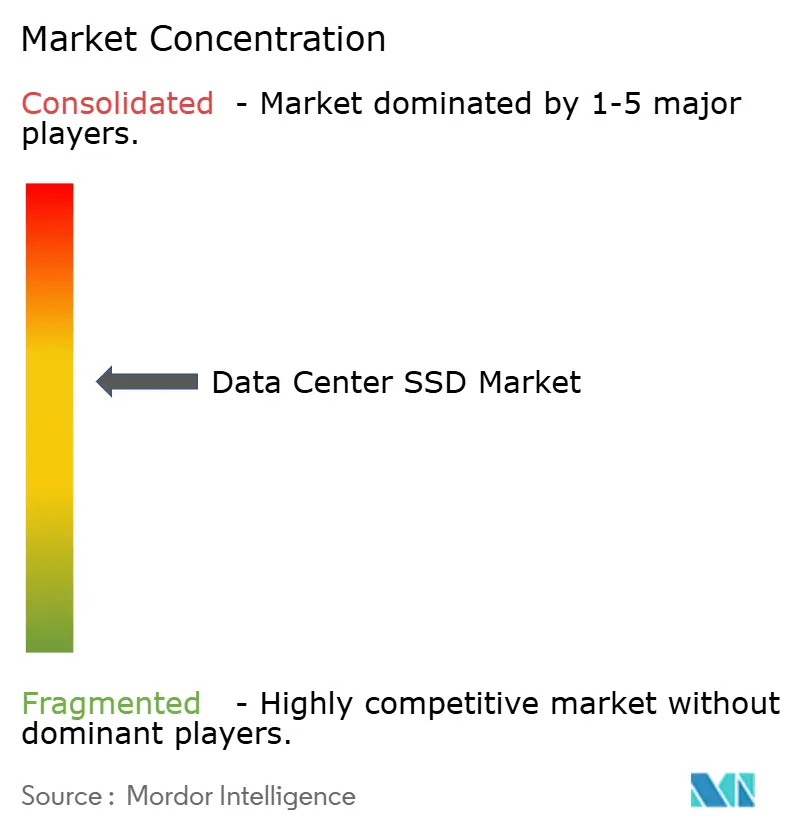
| Market Concentration | Medium |
Major Players *Disclaimer: Major Players sorted in no particular order Image © Mordor Intelligence. Reuse requires attribution under CC BY 4.0. | |
Data Center SSD Market Analysis by Mordor Intelligence
The data center SSD market size reached USD 49,012.05 million in 2025 and is forecast to climb to USD 167,644.57 million by 2031, translating into a 24.36% CAGR for the period. Growth stems from the wholesale shift away from hard-disk infrastructure toward all-flash environments that can satisfy AI-driven throughput and latency requirements, particularly inside hyperscale facilities [MICRON.COM]. Rising electricity costs, stricter sustainability mandates, and demand for predictable latency further reinforce the adoption of enterprise SSDs over mechanical drives. PCIe 5.0 interfaces, EDSFF form factors, and QLC NAND advances collectively lower USD/GB and increase rack-level density, allowing operators to squeeze more performance per watt from existing footprints. Geopolitical pressures surrounding semiconductor export controls are catalyzing efforts to localize controller IC supply, while cloud providers double down on vertically integrated storage stacks that optimize performance and total cost of ownership
Key Report Takeaways
- By form factor, 2.5-inch drives held 41% of the data center SSD market share in 2024; EDSFF formats are on track to expand at a 29.4% CAGR to 2030.
- By interface, PCIe commanded 70.5% share of the data center SSD market in 2024 and is advancing at a 35.8% CAGR through 2030.
- By NAND technology, TLC accounted for 61.2% of the data center SSD market size in 2024, while QLC is projected to accelerate at 31.1% CAGR between 2025-2030.
- By drive architecture, read-intensive models captured 50.4% share of the data center SSD market size in 2024, whereas mixed-use products are forecast to post 24.7% CAGR to 2030.
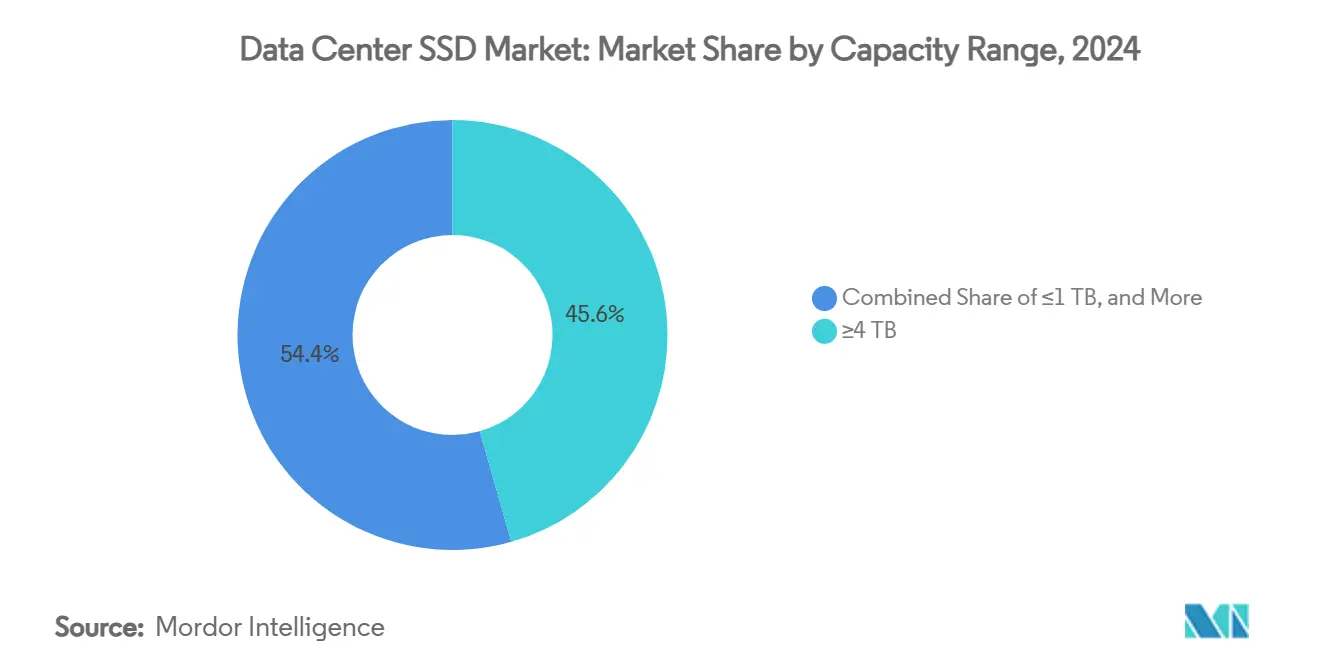
- By capacity range, ≥4 TB units led with 45.6% data center SSD market share in 2024 and will climb at a 19.9% CAGR over the outlook.
- By end-user, hyperscale cloud providers dominated with 53.8% share of the data center SSD market size in 2024; the same group is expected to grow at 22.5% CAGR through 2030.
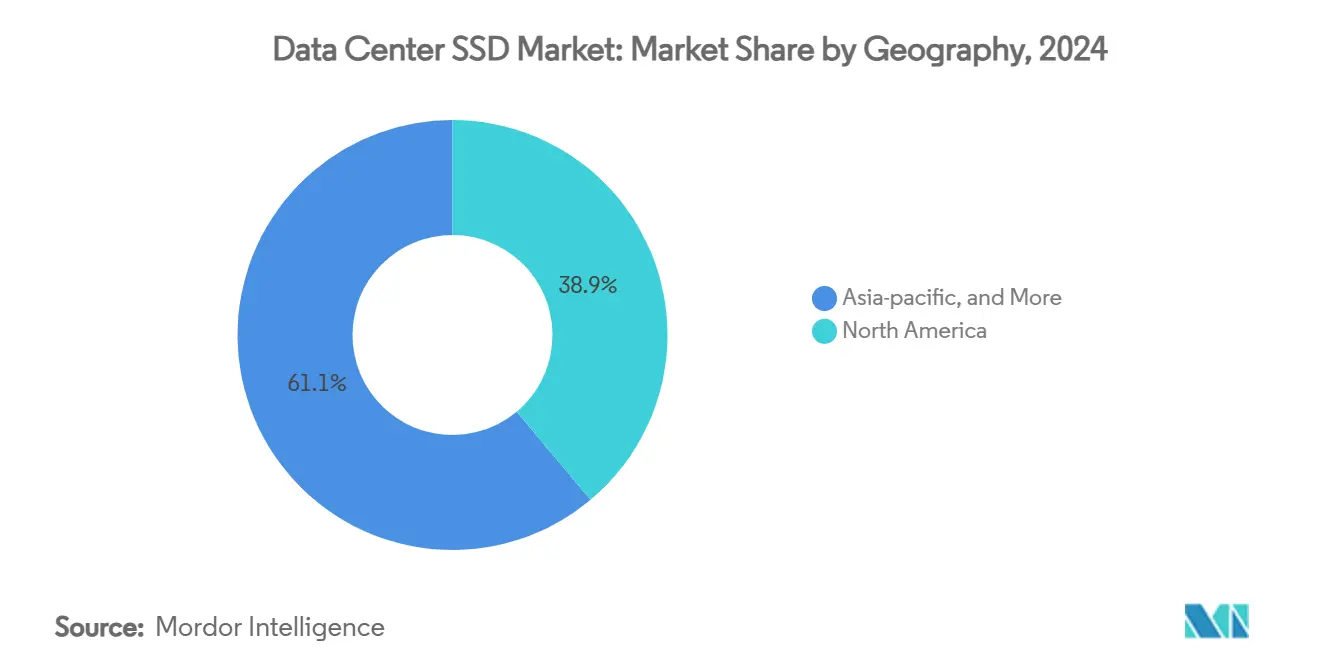
- By geography, North America retained 38.9% of the data center SSD market share in 2024, while Asia-Pacific is the fastest-growing region at an 18.4% CAGR to 2030.
Global Data Center SSD Market Trends and Insights
Drivers Impact Analysis*
| Driver | (~) % Impact on CAGR Forecast | Geographic Relevance | Impact Timeline | ||
|---|---|---|---|---|---|
| AI and HPC workload boom in hyperscale data centers | +8.20% | Global with emphasis on North America, Asia-Pacific | Short term (≤ 2 years) | ||
| Accelerating NVMe adoption across Tier-1 clouds | +6.10% | Global, led by North America and Europe | Medium term (2-4 years) | ||
| Cloud-vendor shift from hybrid to all-flash architectures | +4.80% | Global, especially North America and Asia-Pacific | Medium term (2-4 years) | ||
| Falling $/GB reaching parity with 10-14 TB HDDs | +3.70% | Global, faster uptake in cost-sensitive Asia-Pacific | Long term (≥ 4 years) | ||
| “East Data, West Compute” policy fueling flash build-outs | +2.90% | China with spillovers across Asia-Pacific | Medium term (2-4 years) | ||
| Export controls prompting local controller-IC ecosystems | +1.80% | China and aligned economies | Long term (≥ 4 years) | ||
| Source: Mordor Intelligence | |||||
AI and HPC workload boom in hyperscale data centers
Hyperscale operators report that AI training servers now require 100 TB of local SSD capacity versus 20 TB for traditional workloads. Sustained read throughput beyond 14 GB/s is necessary to keep GPUs fully utilized, pushing vendors to redesign drives for long-duration bandwidth rather than burst peaks. Training infrastructure shows 62% annual growth, and inference nodes register 105% yearly expansion as enterprises embed AI into daily operations. Emerging computational-storage designs process data inside the drive, reducing host I/O and improving GPU utilization. Collectively, these shifts create a self-reinforcing cycle in which flash density and interface speed must accelerate to stay ahead of model complexity.
Accelerating NVMe adoption across Tier-1 clouds
Cloud platforms increasingly view SATA and SAS as legacy technologies unable to sustain modern multi-tenant traffic. NVMe 2.0’s scalable queue architecture eliminates controller bottlenecks and slashes CPU overhead by up to 50%, freeing resources for revenue-generating compute tasks [1].NVM Express, “How Facebook Leverages NVMe Cloud Storage in the Datacenter,” nvmexpress.org NVMe-over-Fabrics extends these gains to disaggregated architectures, letting providers pool storage while preserving local-like latency. As the ecosystem reaches critical mass, NVMe becomes the baseline for green-field builds, relegating older protocols to transitional or niche deployments.
Cloud-vendor shift from hybrid to all-flash architectures
Declining NAND cost curves and the operational burden of multi-tier setups have convinced leading clouds to move directly to all-flash estates. QLC NAND offers near-HDD economics while delivering 25× higher sequential read speeds, translating into a 20× smaller footprint for the same logical capacity [2]Solidigm, “QLC NAND Technology Is Ready for Mainstream Use in the Data Center,” solidigm.com. Homogeneous pools simplify software stacks, cut cooling loads, and provide consistent latency, all of which improve customer experience and reduce lifetime cost.
Falling $/GB enabling price-parity with 10-14 TB HDDs
NAND manufacturers have surpassed 200-layer production, driving steep bit-cost reduction. Industry roadmaps indicate cost equivalence between enterprise SSDs and 10-14 TB HDDs by 2026, a tipping point that widens the addressable market for flash. Temporary production cuts and price swings persist, yet hyperscale buyers use multi-year contracts to lock in economics and accelerate flash conversion.
Restraints Impact Analysis*
| Restraint | (~)% Impact on CAGR Forecast | Geographic Relevance | Impact Timeline | ||
|---|---|---|---|---|---|
| NAND controller shortages under tech-export restrictions | -2.90% | Global, most severe in China and allied countries | Short term (≤ 2 years) | ||
| Aggressive ASP erosion compressing vendor margins | -2.40% | Global, particularly affecting smaller manufacturers | Medium term (2-4 years) | ||
| Slow yield-ramp of ≥200-layer 3D NAND delaying ≥64 TB SSDs | -1.80% | Global, concentrated in advanced manufacturing regions | Medium term (2-4 years) | ||
| Fragmented domestic standards limiting multi-vendor interoperability | -1.20% | Regional, primarily affecting China and emerging markets | Long term (≥ 4 years) | ||
| Source: Mordor Intelligence | |||||
NAND controller shortages under tech-export restrictions
Restricted access to leading-edge lithography equipment limits controller output, particularly for Chinese firms. Domestic fabs run mature nodes that cannot deliver the power efficiency and logic density high-performance drives require, delaying product ramps and raising costs. Multinationals with approved facilities maintain supply, but geopolitical uncertainty forces buyers to dual-source and increase inventory, marginally slowing the data center SSD market expansion.
Aggressive ASP erosion compressing vendor margins
Over-capacity and intense bidding among flash makers drive selling prices down faster than production costs fall. Hyperscale buyers magnify the pressure through volume leverage and direct silicon contracts. Thin margins curb R and D budgets just as interface transitions and AI workloads demand costly re-architecture, challenging smaller vendors’ ability to remain competitive.
*Our forecasts treat driver/restraint impacts as directional, not additive. The impact forecasts reflect baseline growth, mix effects, and variable interactions.
Segment Analysis
By Form Factor: Transition from 2.5-Inch to EDSFF Gains Pace
2.5-inch drives retained 41% of the data center SSD market in 2024 as enterprises continued to refresh legacy racks. EDSFF units, however, logged a 29.4% CAGR and will soon outpace older formats as hyperscalers adopt E1.S to fit up to 32 drives in a 1U chassis.
EDSFF’s 25 W thermal envelope and hot-swap design cut service times and enable higher capacity without throttling. Standardized heatsinks improve cross-vendor compatibility, while the slim profile frees space for GPUs and accelerators. As open hardware communities finalize common carrier boards, suppliers benefit from scale, hastening the shift across the data center SSD market.


By Interface: PCIe 5.0 Extends Lead
PCIe held 70.5% share in 2024 and is growing at 35.8% CAGR as Gen5 doubles per-lane throughput to 32 GT/s. SATA’s 6 Gbps ceiling relegates it to archival tasks, and SAS persists mainly in regulated verticals that value dual-port redundancy.
CXL 3.0 rides on the same physical interface, paving the way for pooled memory and peer-to-peer transfers that blur the line between storage and RAM. As servers adopt Gen5 retimers and redrivers, PCIe becomes the essential backbone for AI-centric clusters, reinforcing its dominance in the data center SSD market.
By NAND Technology: QLC Challenges TLC
TLC dominated 61.2% of the data center SSD market size in 2024 thanks to its balance of endurance and cost, yet suppliers report 31.1% CAGR for QLC as controllers improve error-correction and over-provisioning. Micron’s 232-layer QLC devices now deliver TLC-class read speeds while keeping bit cost below competing options.
Facebook’s workload study shows 94% of cloud traffic is read-heavy, making QLC appropriate for most applications. With Samsung demonstrating 290-layer V-NAND and aiming higher stacks, QLC capacity gains will press TLC toward premium write-intensive niches. The data center SSD market increasingly segments around workload profiles rather than monolithic flash types.
By Drive Architecture: Mixed-Use Designs Gain Ground
Read-intensive SKUs led with 50.4% share in 2024, reflecting the prevalence of content delivery, search, and analytics. Mixed-use models achieve 24.7% CAGR as AI workloads combine bursts of training writes with continuous inference reads, necessitating balanced endurance.
JEDEC’s DWPD guideline clarifies rating methods, giving buyers confidence to deploy mixed-use drives broadly. Controller-level dynamic over-provisioning tunes spare blocks in real time, extending life without human intervention. This versatility positions mixed-use drives as the default choice for new deployments in the data center SSD market.
By Capacity Range: ≥4 TB Drives Become Standard
≥4 TB devices captured 45.6% data center SSD market share in 2024 and will grow at 19.9% CAGR as hyperscalers strive to cut rack space and cabling. KIOXIA’s 122.88 TB prototype shows the trajectory toward tape-like densities with flash-grade performance.
Higher capacity reduces node count, simplifies management, and lowers power draw per terabyte. As NAND scaling nears physical limits, vendors use package stacking and advanced controllers to push past 64 TB in production drives, cementing high-capacity dominance across the data center SSD market.
By End-User: Hyperscale Clouds Drive Volume
Hyperscale providers commanded 53.8% of the data center SSD market size in 2024 and are expanding at 22.5% CAGR. Their appetite shapes vendor roadmaps, dictating custom firmware and telemetry hooks for fleet-wide health analytics.
Colocation facilities ride this wave by offering pre-cabled, high-density racks, while financial-services data centers demand low-latency flash for trading engines and in-memory risk models. Together, these segments diversify requirements, but hyperscalers remain the yardstick for innovation and scale economics.
Geography Analysis
North America held 38.9% of the data center SSD market in 2024, with Virginia’s “Data Center Alley,” Northern California, and Central Texas hosting dense all-flash campuses. Federal data-sovereignty rules boost demand for domestically made drives, and leading clouds pilot computational-storage services from U.S. regions first. Export-control stability benefits local suppliers, though tight controller supply still presents challenges.
Asia-Pacific is the fastest-growing contributor at an 18.4% CAGR, propelled by China’s “East Data, West Compute” plan and greenfield hubs in India, Indonesia, and Australia. Western China builds vast GPU-rich clusters near hydro and solar assets, each filled with petabytes of PCIe 5.0 EDSFF drives. In India, data-localization rules and 5G rollout fuel demand for edge-ready all-flash nodes, widening the addressable data center SSD market.
Europe shows steady uptake driven by carbon-reduction targets and GDPR compliance. Operators invest in liquid-cooling retrofits and favor SSDs for their lower power draw and encryption features. Edge computing across the Nordics and mainland aggregation sites requires small, rugged, yet high-capacity drives, reinforcing flash adoption even where new builds are modest.
Mordor Intelligence provides coverage of the data center ssd market across other key regional markets, including North America, Asia, Europe, Latin America, Middle East, and Africa, each with their regulatory frameworks and demand patterns. Detailed country-level analysis extends to United States and China incorporating local coverage and market participation, as required.
Competitive Landscape
The data center SSD market is highly concentrated among vertically integrated flash manufacturers. Samsung, Micron, and Western Digital control wafer fabrication, controller design, and firmware stacks, allowing rapid tuning of performance per watt while protecting margins. Samsung accelerates V-NAND scaling, Micron emphasizes AI-centric latency consistency, and Western Digital leverages its HDD heritage for broad channel reach.
Second-tier challengers, notably Solidigm and regional Chinese firms, focus on QLC density and domestic supply security. Solidigm uses SK hynix wafers plus proprietary firmware to carve a price-performance niche. Chinese entrants pivot around homegrown controllers to circumvent export constraints, courting local clouds with turnkey racks.
Innovation hotspots include CXL-attached flash and computational-storage modules. SNIA’s work group formalizes frameworks that blend compute and storage, opening a new axis of differentiation where smaller startups can partner with hyperscalers to leapfrog incumbents. Strategic partnerships—such as Supermicro’s alliance with DataVolt for GPU-dense campuses—further demonstrate how system vendors and flash makers co-design end-to-end stacks to secure share in the data center SSD market.
Data Center SSD Industry Leaders
Samsung Electronics Co., Ltd.
Kioxia Corporation
Western Digital Corporation
Micron Technology, Inc.
Huawei Technologies Co., Ltd. (FusionSSD)
- *Disclaimer: Major Players sorted in no particular order

Recent Industry Developments
- May 2025: Western Digital unveils the OpenFlex Data24 4100 EBOF and Ultrastar Data102 3000 ORv3 JBOD, broadening options for AI clusters.
- May 2025: KIOXIA introduces CM9 Series PCIe 5.0 NVMe SSDs up to 61.44 TB, leveraging 8th-generation BiCS FLASH.
- May 2025: Supermicro partners with DataVolt to develop USD 20 billion AI campuses in Saudi Arabia, targeting 40% power savings.
- April 2025: JEDEC publishes the JESD270-4 HBM4 standard, doubling bandwidth to 2 TB/s for AI accelerators.
- March 2025: KIOXIA announces the 122.88 TB LC9 Series NVMe SSD for large language models.


Global Data Center SSD Market Report Scope
| 2.5-inch (U.2/U.3) |
| M.2 |
| PCIe Add-in Card |
| EDSFF (E1.S / E1.L / E3) |
| SATA |
| SAS |
| PCIe |
| SLC |
| MLC |
| TLC |
| QLC |
| Read-Intensive (1 DWPD) |
| Mixed-Use (3 DWPD) |
| Write-Intensive (10 DWPD) |
| ≤ 1 TB |
| 1-2 TB |
| 2-4 TB |
| ≥ 4 TB |
| Hyperscale Cloud Providers |
| Colocation / Carrier-Neutral Facilities |
| Enterprise and Financial-Services Data Centers |
| North America |
| South America |
| Europe |
| Asia-Pacific |
| Middle East |
| Africa |
| By Form Factor | 2.5-inch (U.2/U.3) |
| M.2 | |
| PCIe Add-in Card | |
| EDSFF (E1.S / E1.L / E3) | |
| By Interface | SATA |
| SAS | |
| PCIe | |
| By NAND Technology | SLC |
| MLC | |
| TLC | |
| QLC | |
| By Drive Architecture | Read-Intensive (1 DWPD) |
| Mixed-Use (3 DWPD) | |
| Write-Intensive (10 DWPD) | |
| By Capacity Range | ≤ 1 TB |
| 1-2 TB | |
| 2-4 TB | |
| ≥ 4 TB | |
| By End-User | Hyperscale Cloud Providers |
| Colocation / Carrier-Neutral Facilities | |
| Enterprise and Financial-Services Data Centers | |
| By Geography | North America |
| South America | |
| Europe | |
| Asia-Pacific | |
| Middle East | |
| Africa |


Key Questions Answered in the Report
What is the current size of the data center SSD market?
The data center SSD market size stood at USD 49 billion in 2025 and is set to exceed USD 167 billion by 2031.
Which region is growing the fastest for data center SSD adoption?
APAC registers the highest growth, expanding at an 18.4% CAGR through 2030 as China, India, and Southeast Asia build new AI-ready facilities.
Why are hyperscale cloud providers critical to SSD demand?
They control 53.8% of the data center SSD market and drive innovation by ordering custom, high-density flash arrays optimized for AI workloads.
How will PCIe 5.0 influence future data center storage?
PCIe 5.0 doubles link bandwidth, enabling SSDs to deliver over 14 GB/s sequential reads, a requirement for large-scale AI training clusters.
What technological shift is challenging TLC NAND’s dominance?
QLC NAND’s rapid maturity—posting 31.1% CAGR—offers HDD-like cost with flash performance, making it suitable for the majority of read-heavy cloud tasks.
How do export controls affect SSD supply chains?
Restrictions on advanced lithography limit controller IC availability, compelling manufacturers to localize production and diversify supplier bases, which could temper short-term market growth.
Page last updated on:


