Middle East Data Center SSD Market Size and Share
Market Overview
| Study Period | 2020 - 2031 |
|---|---|
| Forecast Data Period | 2026 - 2031 |
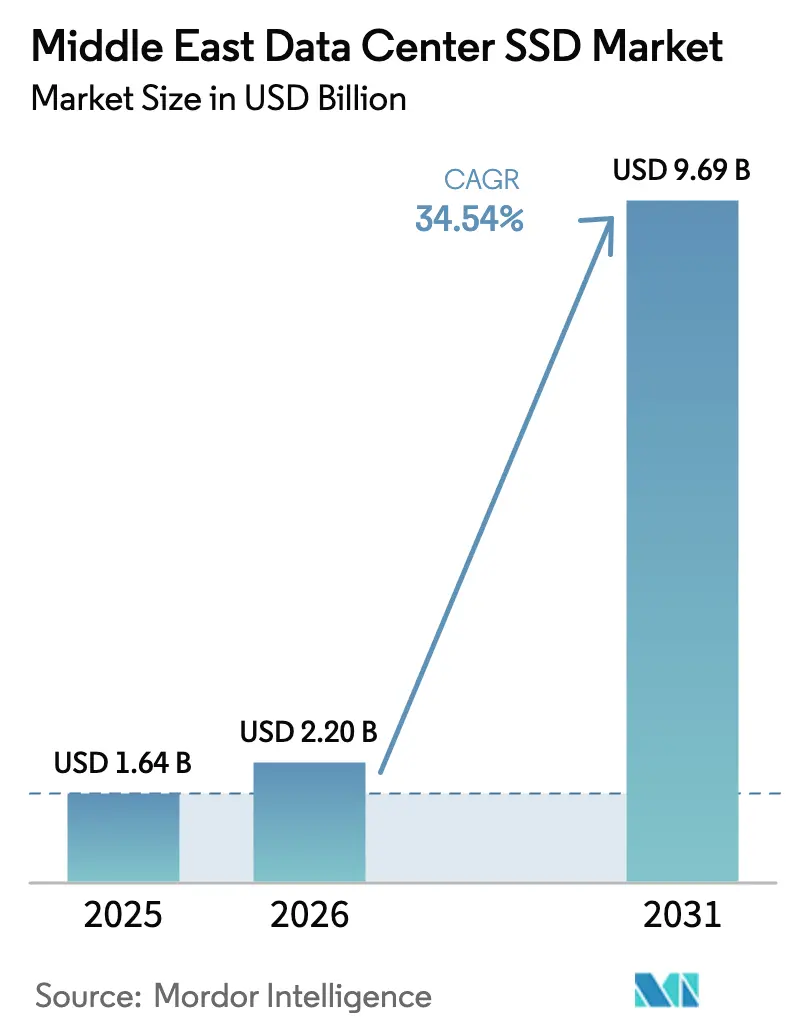
| Base Year Market Size (2025) | USD 1.64 Billion |
| Market Size (2026) | USD 2.20 Billion |
| Market Size (2031) | USD 9.69 Billion |
| Growth Rate (2026 - 2031) | 34.54% CAGR |
| Market Concentration | Medium |
Major Players *Disclaimer: Major Players sorted in no particular order Image © Mordor Intelligence. Reuse requires attribution under CC BY 4.0. | |
Middle East Data Center SSD Market Analysis by Mordor Intelligence
The Middle East data center SSD market size is projected to expand from USD 1.64 billion in 2025 and USD 2.20 billion in 2026 to USD 9.69 billion by 2031, registering a CAGR of 34.54% between 2026 to 2031. Fierce investment by Gulf Cooperation Council governments is transferring sovereign oil revenue into hyperscale campuses that demand low-latency, all-flash storage for artificial intelligence, edge analytics, and high-performance computing. Sovereign data-protection rules in Saudi Arabia, the United Arab Emirates, and Qatar force in-country retention of personal information, encouraging greenfield builds instead of retrofits. Operators are standardizing on non-volatile memory express interfaces and advanced form factors to maximize rack density in a region where land and power are expensive and ambient temperatures are high. Intensifying NAND layer counts are pushing cost per gigabyte toward parity with mission-critical hard disk drives, giving the Middle East data center SSD market a cost tailwind alongside the policy and workload catalysts.
Key Report Takeaways
- By form factor, the 2.5-inch U.2 and U.3 segment captured 58.13% of the Middle East data center SSD market share in 2025, while EDSFF variants are poised to expand at a 35.14% CAGR through 2031.
- By interface, PCIe accounted for 70.21% share of the Middle East data center SSD market size in 2025 and is forecast to advance at a 35.74% CAGR over 2026-2031.
- By NAND type, TLC held 36.72% of share in 2025, whereas QLC is set to climb at a 35.46% CAGR during the same period.
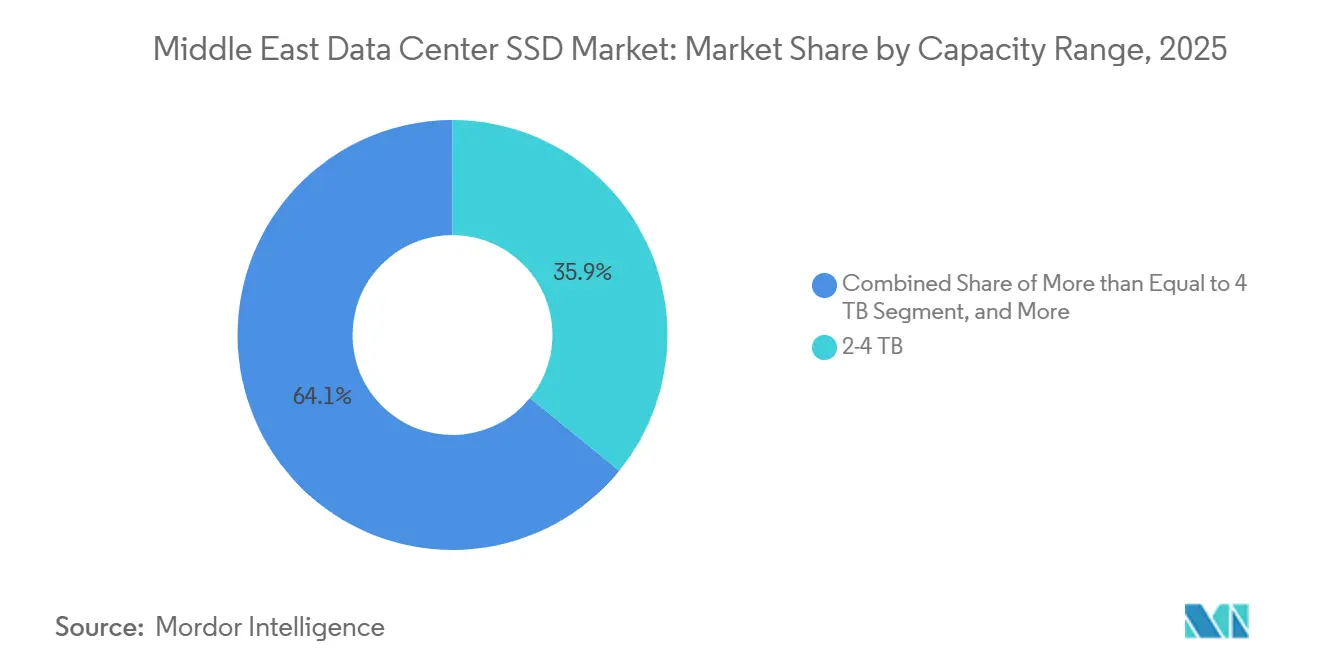
- By capacity, the 2-4 TB band led with 35.87% share in 2025, while drives of 4 TB and above are projected to grow at 35.61% CAGR to 2031.
- By tier classification, Tier 3 facilities commanded 51.86% share in 2025, yet Tier 4 sites are on track for a 35.88% CAGR through 2031.
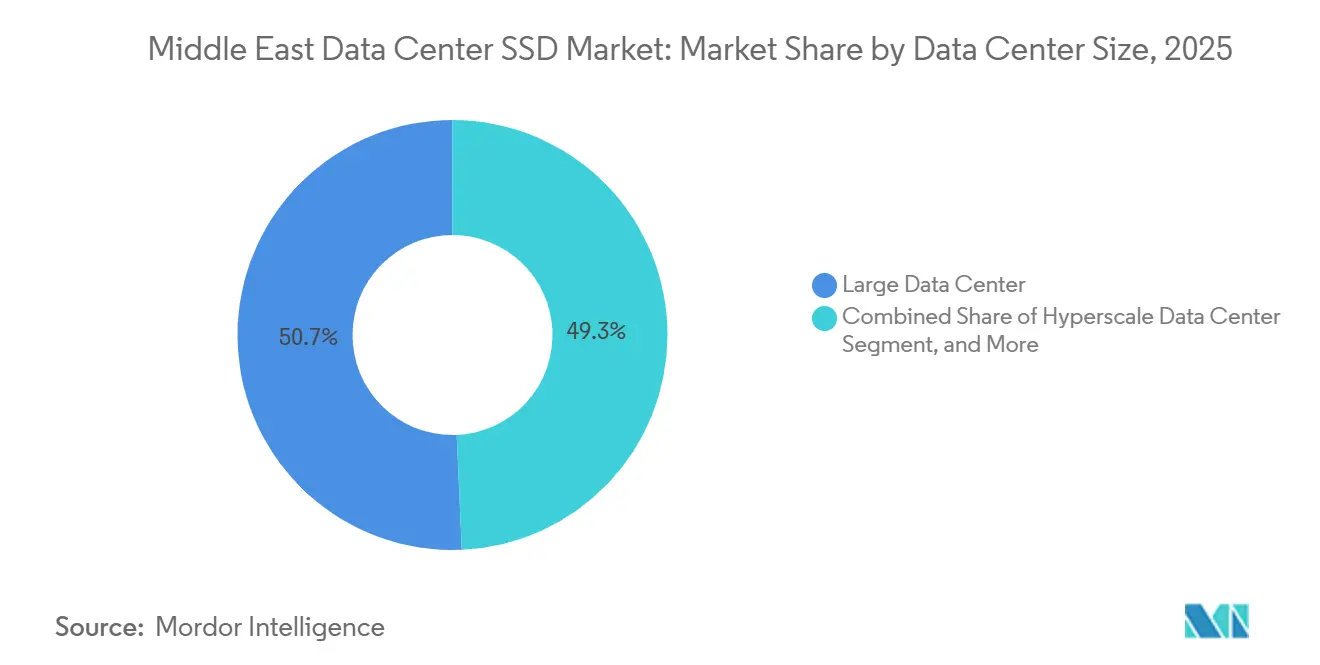
- By data-center size, large facilities held 50.68% share in 2025; hyperscale campuses are expected to rise at a 35.27% CAGR to 2031.
- By data center type, colocation providers controlled 53.38% share in 2025, but hyperscalers and cloud service providers will grow at a 35.33% CAGR.
- By country, Saudi Arabia led with 31.02% share in 2025, whereas the United Arab Emirates is forecast to record a 35.58% CAGR through 2031.
Note: Market size and forecast figures in this report are generated using Mordor Intelligence’s proprietary estimation framework, updated with the latest available data and insights as of January 2026.
Middle east operates as part of an interconnected international environment rather than as a self-contained unit. The data center ssd market research by Mordor Intelligence places together all major regional developments across the globe within that wider frame.
Middle East Data Center SSD Market Trends and Insights
Drivers Impact Analysis*
| Driver | (~)% Impact on CAGR Forecast | Geographic Relevance | Impact Timeline |
|---|---|---|---|
| Accelerating AI and HPC Workloads in GCC Hyperscale Data Centers Driving NVMe Adoption | +8.5% | Saudi Arabia, United Arab Emirates, Qatar | Medium term (2-4 years) |
| Saudi Vision 2030 and UAE Digital-Government Projects Funding Greenfield All-Flash Sites | +7.2% | Saudi Arabia, United Arab Emirates | Long term (≥ 4 years) |
| Declining USD/GB of 3D-NAND Reaching Price-Parity With Mission-Critical HDDs | +6.1% | Global, with concentrated adoption in GCC hyperscale deployments | Short term (≤ 2 years) |
| Edge and 5G Micro-Data-Center Roll-Outs in Oil and Gas Fields Demanding Rugged, Low-Power SSDs | +4.3% | Saudi Arabia, United Arab Emirates, Qatar, Oman | Medium term (2-4 years) |
| Regional Data-Sovereignty Mandates (Saudi PDPL, UAE DIFC, Qatar PDP) Spurring In-Country All-Flash Builds | +3.8% | Saudi Arabia, United Arab Emirates, Qatar, Bahrain | Long term (≥ 4 years) |
| Early CXL and Computational-Storage Pilots Led by Israel's Semiconductor Ecosystem | +2.4% | Israel, with spill-over to UAE and Saudi Arabia | Long term (≥ 4 years) |
| Source: Mordor Intelligence | |||
Accelerating AI and HPC Workloads In GCC Hyperscale Data Centers Driving NVMe Adoption
Government-backed capital is flowing into hyperscale campuses that train large language models and run high-fidelity simulations, workloads that are intolerant of disk latency. Microsoft and G42 committed USD 15.2 billion to add 200 MW of capacity in the United Arab Emirates, and the United States-UAE initiative targets a 5 GW artificial-intelligence estate, both architected around non-volatile memory express drives delivering sub-100-microsecond read latency.[1]Microsoft News Center, “Microsoft and G42 Expand UAE Cloud Capacity,” microsoft.com Oracle entered the region in 2025 with a GPU-rich cluster that streams data at 14 GB/s through PCIe Gen5 controllers, showing operators the practical advantage of an all-flash spine.[2]Oracle Corporation, “Oracle Introduces Supercloud Cluster in the Middle East,” oracle.com Saudi Arabia’s Public Investment Fund allocated more than USD 21 billion to projects such as the 480 MW Hexagon facility, positioning NVMe arrays as the default storage layer for sovereign AI models.[3]Saudi Vision 2030, “Hexagon Data Center Highlights National Strategy,” vision2030.gov.sa As compute density climbs, campuses prefer SSDs that minimize I/O bottlenecks and simplify horizontal scaling, giving the Middle East data center SSD market strong structural momentum.
Saudi Vision 2030 and UAE Digital-Government Projects Funding Greenfield All-Flash Sites
Riyadh’s National Data Center Strategy targets 1.5 GW by 2030 and requires public workloads to run in domestic facilities certified to stringent security standards, a decree that effectively locks in flash media from the first rack. Abu Dhabi spent AED 13 billion (USD 3.5 billion) on a 19 MW government data centre that cut power draw by 40% after migrating to NVMe arrays. The UAE Central Bank is building a sovereign financial cloud with Core42, adding another workload that cannot leave national borders and therefore must sit on local, high-performance drives. DataVolt and Neom agreed to a USD 5 billion hyperscale campus that scales to 1 GW and uses ruler-style E1.S drives for density, proving that fresh land and power allocations allow flash to displace spinning media from day one.
Declining USD/GB ff 3D NAND Reaching Price Parity with Mission-Critical HDDs
Micron’s 232-layer QLC and Samsung’s ninth-generation V-NAND push cost per gigabyte below USD 0.10 in enterprise contracts, erasing the historic premium that confined flash to hot tiers. Solidigm’s 61.44 TB D5-P5336 undercuts nearline hard drives on a total-cost basis once rack space and cooling are included. Western Digital’s Ultrastar DC SN861 sustains 14 GB/s reads in a slim E1.S sled, illustrating that high bit density now aligns with high throughput. As fabs migrate to 400-millimeter wafers after 2027, analysts expect another 15-20% price slide, accelerating the Middle East data center SSD market’s pivot away from mechanical media.
Edge and 5G Micro-Data-Center Rollouts In Oil and Gas Fields Demanding Rugged, Low-Power SSDs
ADNOC and e and built an 11,000-square-kilometer private 5G network that connects 12,000 wells to edge nodes, each fitted with industrial-grade NVMe drives rated for –40 °C to 85 °C and sub-5-watt draw. Batelco opened Bahrain’s first edge site in January 2026 to serve refineries with sub-10-millisecond latency. Qatar Petroleum is equipping 8,000 offshore platforms with M.2 drives that slash satellite data traffic by 70%, proving that rugged flash unlocks real-time analytics where fiber is unavailable. Saudi Aramco’s automation roadmap specifies conformally coated U.2 media to resist sand ingress, creating a dedicated channel for vendors that can certify extreme endurance. These projects broaden the Middle East data center SSD market beyond urban hyperscale corridors into remote hydrocarbons infrastructure.
Restraints Impact Analysis*
| Restraint | (~) % Impact on CAGR Forecast | Geographic Relevance | Impact Timeline |
|---|---|---|---|
| NAND Price-Volatility Cycles Compressing Vendor Margins | -4.2% | Global, with acute impact on Middle East procurement budgets | Short term (≤ 2 years) |
| Persistent Controller-IC Supply Constraints Extending Enterprise-SSD Lead-Times | -3.5% | Global, affecting Middle East project timelines | Medium term (2-4 years) |
| Escalating Electricity-Tariff Reforms Raising TCO for Regional Operators | -2.8% | Saudi Arabia, United Arab Emirates, Qatar | Medium term (2-4 years) |
| Geopolitical Tensions and Cross-Border Trade Restrictions Heightening Supply-Chain Risk | -2.1% | Middle East, with dependencies on East Asian NAND fabs | Long term (≥ 4 years) |
| Source: Mordor Intelligence | |||
NAND Price-Volatility Cycles Compressing Vendor Margins
Memory-chip prices doubling across 2025-2026 as suppliers diverted wafers to automotive and mobile lines, lifting enterprise-SSD contract prices by more than 50%. Samsung raised quotes quarter over quarter, while Transcend publicly acknowledged a lapse in NAND deliveries that forced a production halt. Controller specialists such as Phison recorded fill rates below 30%, stretching lead times to 30 weeks and exposing Middle East operators that buy on the spot market to severe cost swings. Prolonged volatility pressures already thin margins for regional system integrators and may slow purchase orders even as workloads climb.
Persistent Controller-IC Supply Constraints Extending Enterprise SSD Lead Times
Foundries are prioritizing higher-margin automotive and industrial chips, starving enterprise controllers and pushing vendors to demand multiyear prepayments, a model ill-suited to cash-constrained integrators. Silicon Motion’s SM2508 and Phison’s Max14um parts now ship in 30-week windows, forcing data-center builders in Saudi Arabia and the UAE to sequence storage procurement with electrical and cooling milestones. The mismatch adds holding costs and risks idle racks, tempering the short-term outlook for the Middle East data center SSD market.
*Our forecasts treat driver/restraint impacts as directional, not additive. The impact forecasts reflect baseline growth, mix effects, and variable interactions.
Segment Analysis
By Form Factor: EDSFF Becomes The Density Standard
The 2.5-inch U.2 and U.3 bays delivered 58.13% of the Middle East data center SSD market share in 2025, reflecting their compatibility with legacy hot-swap trays. EDSFF variants is expected to expand at a 35.14% CAGR during the forecast period. Rising rack-space premiums and airflow constraints, however, are prompting operators to pursue the elongated data center SSD capacities enabled by E1.S, E1.L, and E3 designs that double drive count per rack unit. Leading hyperscalers in the region have moved pilot clusters to E1.S sleds that cut power draw per terabyte by more than one-third. Thermal gains are equally important, because denser flash arrays let facilities throttle fan speeds and sustain economizer cooling in desert climates. These savings resonate with utility tariffs that now index costs to load factor, making slimmer drives a hedge against future electricity reforms.
The transition accelerates in 2026 as controller roadmaps converge on EDSFF first, leaving legacy 2.5-inch form factors a step behind the performance curve. Western Digital’s Ultrastar DC SN861 in E1.S sustains 13.5 GB/s writes while operating at 45 °C air, a specification aligned with Gulf climatics. Kioxia’s CD8-V in E3.S adds 30.72 TB in a single stick, letting Saudi Arabia’s Hexagon campus fit 1.5 PB per 42U cabinet without exotic cooling. As a result, the Middle East data center SSD market size for EDSFF units is positioned for outsized growth, while U.2 demand tapers toward refresh rather than expansion cycles. Vendors that lack an EDSFF line risk displacement as procurement documents embed the new form factor as a minimum requirement.


By Interface: PCIe Cemented As The High-Bandwidth Backbone
PCIe captured 70.21% of the market share in 2025 and will continue compounding at a 35.74% CAGR as Gen5 boards reach 14 GB/s, saturating GPU pipelines in AI clusters. SATA maintains a niche in cost-sensitive edge gateways, yet its 6 Gb/s ceiling cannot service real-time inference. SAS fell to a mid-single-digit slice as dual-port redundancy now arrives via network fabrics rather than controller pairs. The Middle East data center SSD market size tied to PCIe therefore rises not only on unit growth but also on average selling price, because higher lane counts and faster controllers carry better margins.
Gen6 silicon finalised at 128 GT/s in the PCI-SIG 6.0 spec ships to hyperscalers in late 2026, doubling Gen5 throughput and ensuring ample headroom for next-generation GPUs. UAE projects backed by Microsoft-G42 have written Gen5 as baseline and request Gen6 readiness, illustrating how buyers in the region leapfrog incremental steps. Backward compatibility lets operators stage upgrades without forklift swaps, smoothing deployment Cadence. This dynamic keeps the Middle East data center SSD market firmly oriented around PCIe, while SATA fades into archival edges.
By NAND Technology: QLC Narrows The Durability Gap
TLC led the market at 36.72% in 2025 thanks to its balance of price and write endurance, though QLC is set to climb at a 35.46% CAGR during the forecast period by offering 50% higher areal density. Rising layer counts above 280 let QLC drives promise 1 drive write per day over 5 years, adequate for object storage and analytics lakes that dominate hyperscale clouds. The shrinking cost delta invites operators to replace cold HDD tiers with flash, a shift that benefits the Middle East data center SSD market, where floor space and cooling caps are binding.
Micron’s 232-layer QLC and Solidigm’s 61.44 TB ruler both demonstrate that four-bit cells can deliver 7 GB/s sequential writes while holding down watts per terabyte. Western Digital’s dynamic write acceleration further stretches durability by staging writes in SLC buffers, removing the last argument against deep QLC adoption. Together, these moves will rebalance the Middle East data center SSD market share between TLC and QLC by the decade’s close.
By Capacity Range: High-Capacity Drives Tackle Large AI Models
The 2-4 TB band owned 35.87% of the share in 2025, but soaring parameter counts in language models and analytics pipelines require flash pools measured in petabytes, pushing buyers toward 15 TB and 30 TB sleds. Hyperscale builders specify 15.36 TB as the new floor to hit 1.5 PB per rack, driving average capacity higher each refresh cycle. The Middle East data center SSD market size captured by 4 TB-plus units, therefore, grows at a 35.61% CAGR to 2031, on a unit basis, amplifying vendor revenue.
As NAND moves to 400-millimeter wafers, single-drive capacities will approach 100 TB by 2028, unlocking two-digit petabytes per rack and freeing power and cooling headroom for accelerators. Solidigm’s 61.44 TB ruler already alters cabinet design by eliminating entire rows of bays, evidence that higher capacity is transformative at the facility level. Density plays resonate in Saudi and UAE campuses where utility discounts tie to power usage effectiveness targets, creating a long runway for very-large drives.
By Tier Type: Tier 4 Certification Becomes A Baseline Expectation
Tier 3 sites supplied 51.86% of Middle East data center SSD market share in 2025, as many colocation tenants weigh capex against 99.995% uptime. Government cloud mandates and financial regulators now call for fault-tolerant power and cooling, however, lifting Tier 4 builds. The UAE Central Bank requires Tier 4 for its sovereign cloud, and Saudi policy documents encourage similar resilience for citizen data workloads.
Operators that certify Tier 4 enjoy insurance discounts and service-level premiums that recoup the upfront capex, an equation particularly favourable in emerging hubs. NVMe-over-Fabric architectures simplify the dual-path storage topology Tier 4 demands, keeping incremental flash cost moderate. Consequently, Tier 4’s CAGR of 35.88% runs ahead of the total Middle East data center SSD market, while Tier 1 and Tier 2 fall into life-cycle extensions rather than fresh builds.
By Data Center Size: Hyperscale Campuses Dominate The Expansion Cycle
Large facilities between 10 MW and 50 MW held a 50.68% share in 2025; yet hyperscale campuses are expected to rise at a 35.27% CAGR to 2031. Microsoft-G42’s 200 MW block and DataVolt’s Neom blueprint illustrate the pivot. Higher rack-level densities translate directly into multi-million-unit flash orders, scaling the Middle East data center SSD market faster than legacy facilities can match.
Abu Dhabi’s low single-digit cent tariff cuts operating cost by up to 30%, sharpening the business case for hyperscale footprints. Liquid-cooling designs that push 60 kW racks need flash because spinning disks cannot tolerate elevated inlet temperatures. These structural shifts keep hyperscale CAGRs above 35%, while small- and medium-footprint CAGRs trend sideways.
By Data Center Type: Hyperscalers And CSPs Internalize The Stack
Colocation landlords retained 53.38% of share in 2025, but cloud service providers is expected to grow at a 35.33% CAGR, and now favour owned sites to gain latency control and secure renewable power contracts. Microsoft’s UAE build and Oracle’s regional cluster demonstrate how single-operator campuses combine compute, storage, and interconnect into a single fabric, improving flash procurement efficiency.
Vertical integration compresses buying cycles to a handful of global purchasers, which in turn negotiate multiyear supply deals directly with NAND giants. Smaller regional colocation firms face pricing pressure when upstream shortages hit, risking margin squeeze. As data-sovereignty laws multiply, hyperscalers will replicate their stack in each GCC state, turning their internal demand into the prime engine of the Middle East data center SSD market.
Geography Analysis
Saudi Arabia delivered 31.02% of the share in 2025 on the back of Vision 2030’s mandate for a 1.5 GW footprint and firm sovereign backing for the 480 MW Hexagon anchor. DataVolt’s USD 5 billion campus embeds renewable generation and liquid cooling to meet PUE targets below 1.2, placing a premium on high-temperature-tolerant flash pools. Add rig-automation programs that specify rugged SSDs and the kingdom spans both the hyperscale and edge ends of the demand spectrum.
The United Arab Emirates posts the highest CAGR at 35.58% thanks to a dedicated AI data center tariff and a 200 MW Microsoft-G42 expansion. Abu Dhabi’s public-sector consolidation slashes response times by 60% after switching to NVMe, turning government workloads into showcase references for private buyers. Together, the two countries will remain the twin pillars of the Middle East data center SSD market through 2031, while Turkey and a collection of smaller Gulf states contribute incremental edge and colocation projects.
Secondary markets such as Turkey, Qatar, Bahrain, Jordan, and Oman collectively add edge nodes in oil, gas, and maritime logistics corridors. Qatar Petroleum’s offshore telemetry programme uses industrial M.2 drives to compress satellite backhaul spend, while Bahrain’s Batelco data-center launch targets refinery digitalisation. Although smaller in absolute dollars, these rollouts diversify the regional Middle East data center SSD market and create growth niches for vendors that specialize in ruggedized media and localized service.
The data center ssd market is assessed by Mordor Intelligence through a multi-layered geographic lens, covering other regions such as Asia, Europe, and Latin America, along with detailed country-level analysis for China and United States.
Competitive Landscape
Market share is moderately concentrated, with players such as Samsung, Kioxia, Western Digital, Solidigm and others. Hyperscalers have begun signing multiyear off-take agreements directly with NAND manufacturers, bypassing the distribution layer and narrowing margins for regional resellers. Israeli startups are injecting computational-storage engines that offload database and encryption tasks to ARM cores inside the drive, cutting CPU load by up to 40 percent and freeing space for more revenue-earning compute, a feature that early adopters in the United Arab Emirates are piloting.
Technology differentiation now orbits around layer counts, thermal robustness, and form-factor flexibility. Samsung’s ninth-generation V-NAND exceeds 280 layers, while Kioxia’s charge-trap architecture pushes TLC endurance to three drive writes per day. Western Digital clocks 13.5 GB/s sustained writes under 45 °C air thanks to dynamic write acceleration, a metric critical for desert facilities that rely on economizer cooling. Marvell’s Bravera SC5 controller brings CXL 3.1 linkages that enable memory pooling, positioning storage as a composable resource rather than a peripheral.
Local after-sales support is becoming a deciding factor. Vendors with in-country spares depots and Arabic-language technical teams score higher on government tenders that value supply-chain sovereignty. As Saudi Arabia and the United Arab Emirates tighten localization rules, companies that invest early in service footprints could capture outsized share of the Middle East data center SSD market even if their global brand weight is smaller.
Middle East Data Center SSD Industry Leaders
Samsung Electronics Co., Ltd.
Kioxia Corporation
Micron Technology, Inc.
Hewlett Packard Enterprise Co.
Fujitsu Limited
- *Disclaimer: Major Players sorted in no particular order

Recent Industry Developments
- February 2026: Hewlett Packard Enterprise introduced Alletra Storage MP, a multi-protocol all-flash platform that compresses data center footprint by 60 percent.
- January 2026: Dell Technologies rolled out PowerStore 3.5 with PCIe Gen5 drives and predictive I/O placement that lifts database response by 35 percent.
- January 2026: Pure Storage announced FlashBlade//E, a 75-petabyte-per-rack QLC array aimed at object stores in high-rent colocation sites.
- January 2026: Kingston Technology debuted the NV3 PCIe 4.0 drive up to 4 TB for budget-constrained edge nodes.


Middle East Data Center SSD Market Report Scope
The Middle East Data Center SSD Market refers to the segment of the data storage industry focused on Solid State Drives (SSDs) specifically designed for use in data centers across the Middle East region. These SSDs are optimized for high performance, reliability, and scalability to meet the demands of modern data center operations.
The Middle East Data Center SSD Market Report is Segmented by Form Factor (2.5-inch, M.2, PCIe Add-In Card, and EDSFF), Interface (SATA, SAS, and PCIe), NAND Technology (SLC, MLC, TLC, and QLC), Capacity Range (≤1 TB, 1-2 TB, 2-4 TB, and ≥4 TB), Tier Type (Tier 1 and 2, Tier 3, and Tier 4), Data Center Size (Small, Medium, Large, and Hyperscale), Data Center Type (Colocation, Hyperscalers/CSPs, and Enterprise and Edge), and Country (Saudi Arabia, UAE, Turkey, and Rest of Middle East). The Market Forecasts are Provided in Terms of Value (USD).
| 2.5-inch (U.2/U.3) |
| M.2 |
| PCIe Add-In Card |
| EDSFF (E1.S/E1.L/E3) |
| SATA | |
| SAS | |
| PCIe | PCIe/NVMe Gen3 |
| PCIe/NVMe Gen4 | |
| PCIe/NVMe Gen5 | |
| PCIe/NVMe Gen6 |
| SLC |
| MLC |
| TLC |
| QLC |
| ≤1 TB |
| 1-2 TB |
| 2-4 TB |
| ≥4 TB |
| Tier 1 and 2 |
| Tier 3 |
| Tier 4 |
| Small Data Center |
| Medium Data Center |
| Large Data Center |
| Hyperscale Data Center |
| Colocation Data Center |
| Hyperscalers Data Center/CSPs |
| Enterprise and Edge Data Center |
| Saudi Arabia |
| United Arab Emirates |
| Turkey |
| Rest of Middle East |
| By Form Factor | 2.5-inch (U.2/U.3) | |
| M.2 | ||
| PCIe Add-In Card | ||
| EDSFF (E1.S/E1.L/E3) | ||
| By Interface | SATA | |
| SAS | ||
| PCIe | PCIe/NVMe Gen3 | |
| PCIe/NVMe Gen4 | ||
| PCIe/NVMe Gen5 | ||
| PCIe/NVMe Gen6 | ||
| By NAND Technology | SLC | |
| MLC | ||
| TLC | ||
| QLC | ||
| By Capacity Range | ≤1 TB | |
| 1-2 TB | ||
| 2-4 TB | ||
| ≥4 TB | ||
| By Tier Type | Tier 1 and 2 | |
| Tier 3 | ||
| Tier 4 | ||
| By Data Center Size | Small Data Center | |
| Medium Data Center | ||
| Large Data Center | ||
| Hyperscale Data Center | ||
| By Data Center Type | Colocation Data Center | |
| Hyperscalers Data Center/CSPs | ||
| Enterprise and Edge Data Center | ||
| By Country | Saudi Arabia | |
| United Arab Emirates | ||
| Turkey | ||
| Rest of Middle East | ||


Key Questions Answered in the Report
How fast is the Middle East data center SSD market expected to grow over the next five years?
It is projected to register a 34.54% CAGR from 2026 to 2031, reaching USD 9.69 billion by the end of the period.
Which form factor is gaining the most traction among hyperscale buyers in the region?
EDSFF, especially E1.S and E3 variants, is winning adoption for its double-density advantage and improved airflow.
Why are PCIe-based drives dominant in new Middle East data center builds?
PCIe offers up to 14 GB/s sequential throughput on Gen5 and will double again on Gen6, matching the bandwidth needs of AI accelerators.
What is driving the shift toward QLC NAND in enterprise deployments?
High layer counts push QLC cost per gigabyte below USD 0.10 while endurance now reaches one drive write per day, acceptable for most object storage.
How do regional electricity tariffs influence flash adoption?
New low-cost tariffs for AI data centers in the UAE and similar incentives elsewhere magnify the energy-efficiency benefits of all-flash storage.
Which countries lead demand for data center SSDs in the Middle East?
Saudi Arabia currently leads on spend, while the United Arab Emirates records the highest growth rate through 2031.
Page last updated on:


