Europe Data Center SSD Market Size and Share
Market Overview
| Study Period | 2019 - 2031 |
|---|---|
| Forecast Data Period | 2025 - 2031 |
| Historical Data Period | 2019 - 2023 |
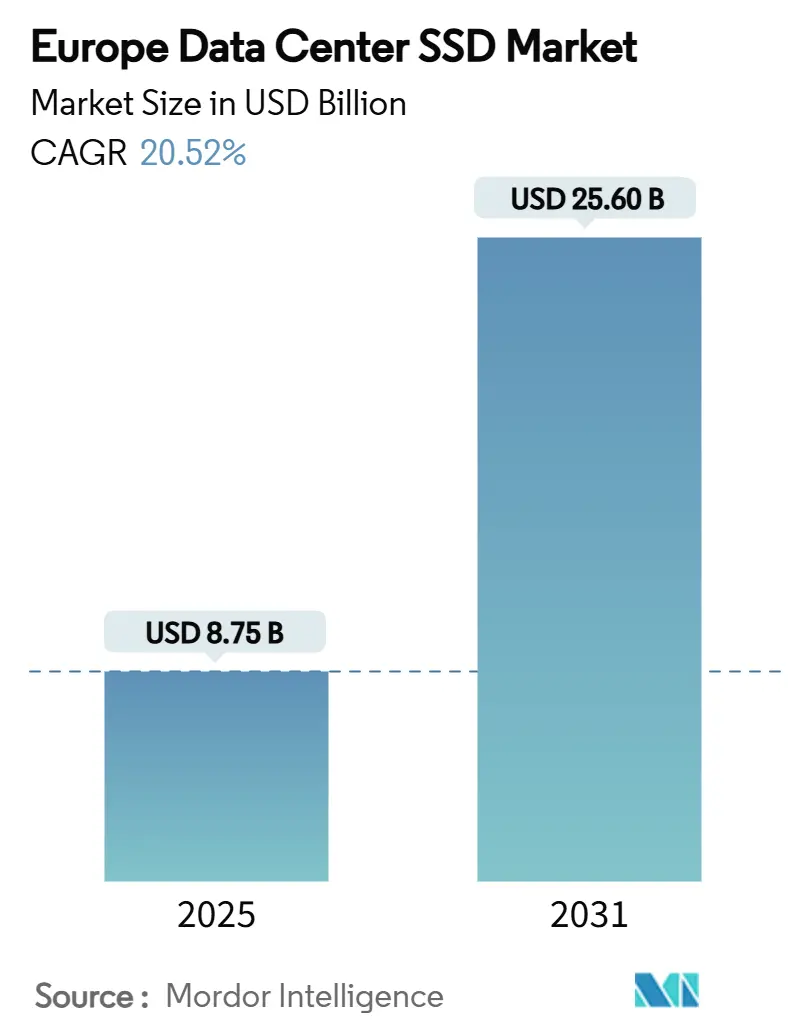
| Market Size (2025) | USD 8.75 Billion |
| Market Size (2031) | USD 25.60 Billion |
| Growth Rate (2025 - 2031) | 20.52% CAGR |
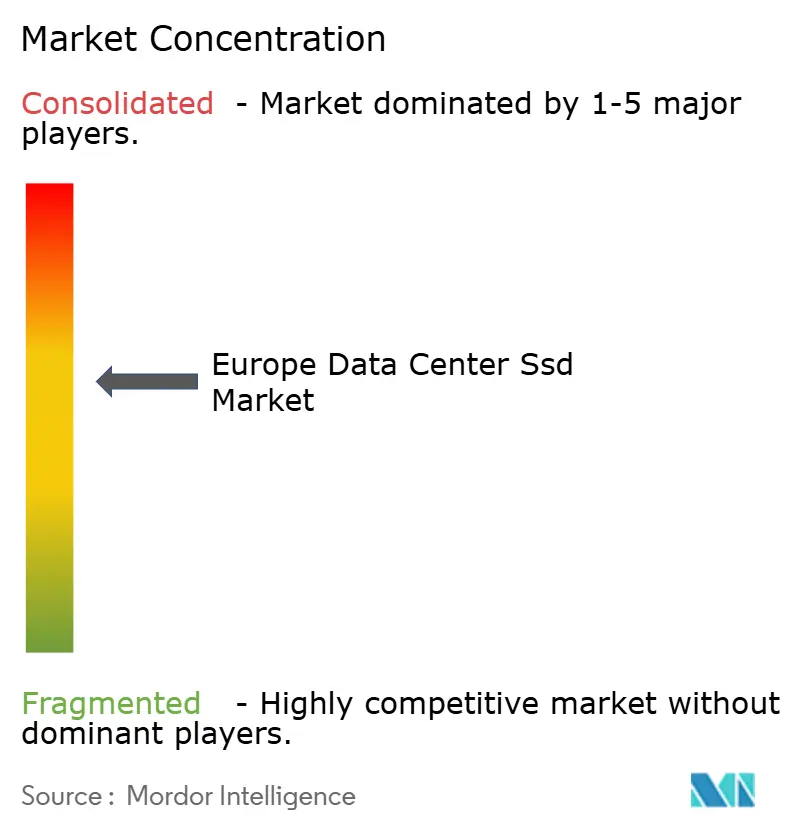
| Market Concentration | Medium |
Major Players *Disclaimer: Major Players sorted in no particular order Image © Mordor Intelligence. Reuse requires attribution under CC BY 4.0. | |
Europe Data Center SSD Market Analysis by Mordor Intelligence
Market Analysis
The Europe data center SSD market size reached USD 8,753.78 million in 2025 and is forecast to climb to USD 25,598.54 million by 2031, translating into a 20.52% CAGR. This strong trajectory mirrors the region’s rapid shift toward AI-centric infrastructure and the EU’s data-localization statutes, both of which demand low-latency, high-throughput flash storage rather than rotational media. Steadily falling 3D-NAND costs, the growing maturity of PCIe 5.0 and 6.0 interfaces, and energy-efficiency mandates under the EU Green Deal are reinforcing the conversion from HDD to SSD in hyperscale and colocation facilities. At the same time, controller shortages and NAND pricing cycles continue to pressure vendor margins, pushing suppliers toward tighter supply-chain integration and differentiated architectures. Competitive intensity is further heightened by the entry of software-defined and computational-storage specialists that are targeting the AI performance tier of the Europe data center SSD market.
Key Report Takeaways
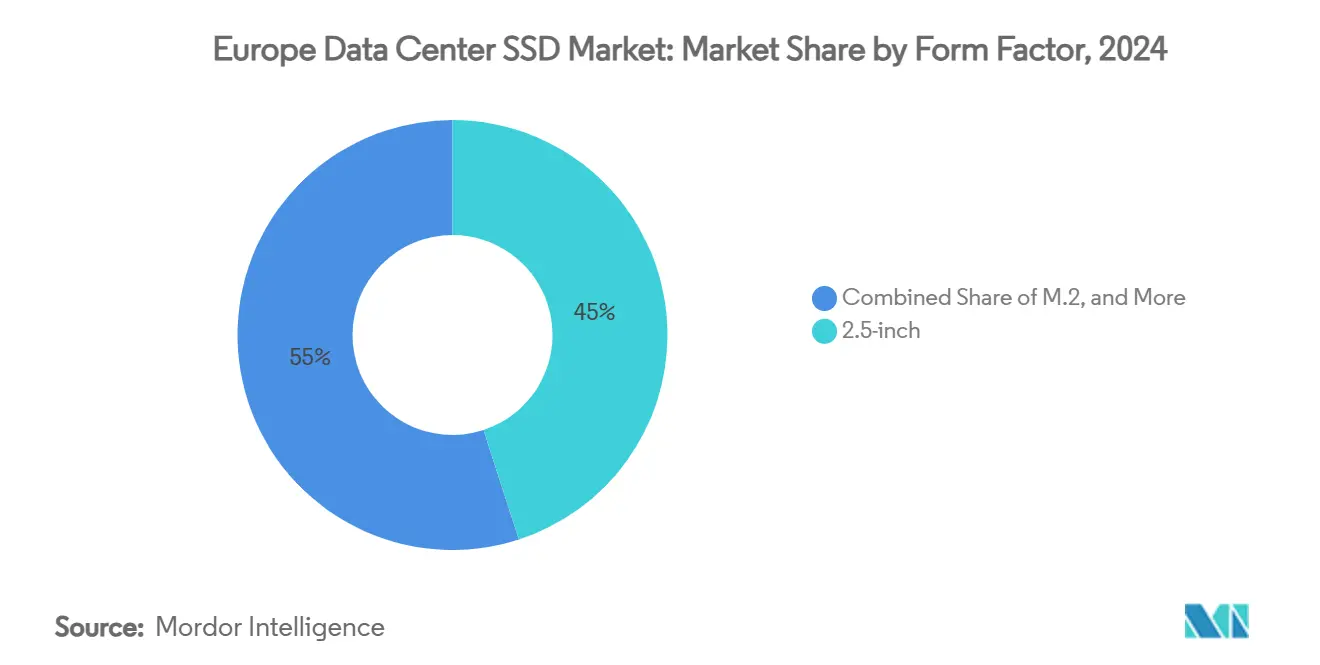
- By form factor, 2.5-inch U.2 drives held 45% revenue share of the Europe data center SSD market in 2024, while PCIe add-in cards are projected to expand at a 21.4% CAGR through 2031.
- By interface, PCIe commanded 70% of the Europe data center SSD market share in 2024; NVMe-oF is the fastest-growing interface at 18.9% CAGR to 2031.
- By NAND technology, TLC captured 54% share of the Europe data center SSD market size in 2024, yet QLC show the highest projected growth at 21.0% CAGR through 2031.
- By drive architecture, mixed-use (3 DWPD) products accounted for 41.0% of the Europe data center SSD market size in 2024 and are advancing at a 22.5% CAGR to 2031.
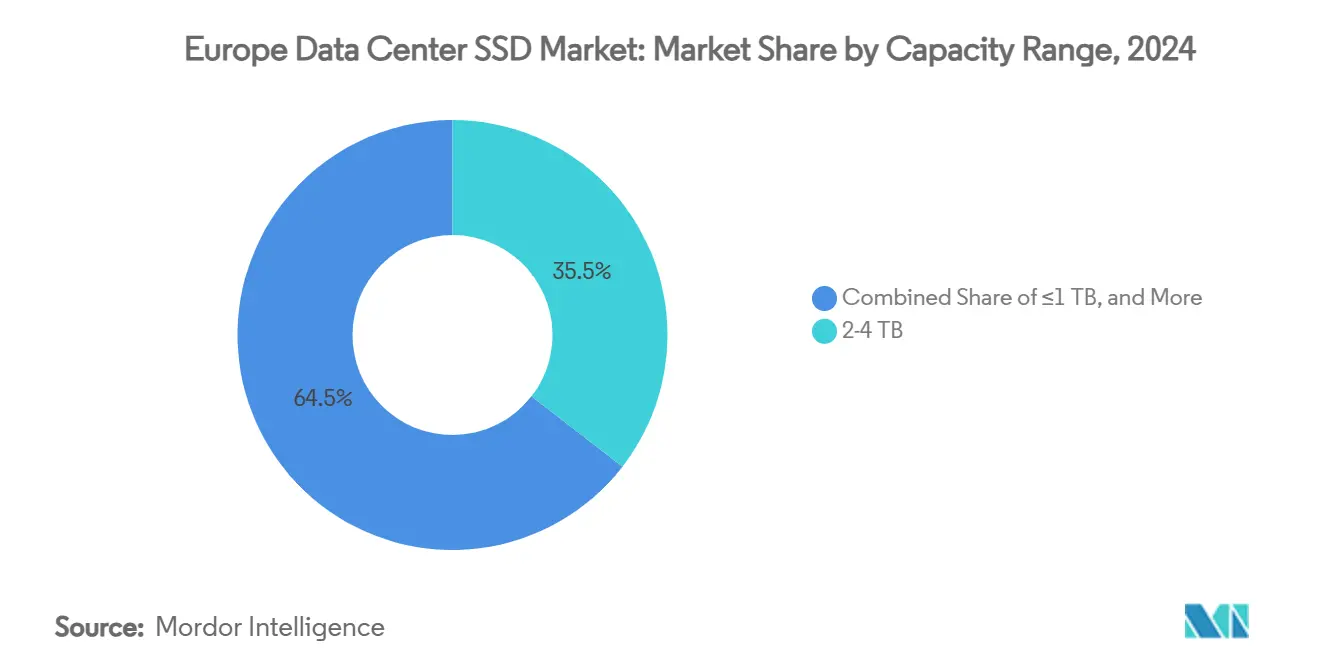
- By capacity range, 2-4 TB accounted for 35.50% of the Europe data center SSD market size in 2024 and are advancing at a 23.10% CAGR to 2031.
- By end user, hyperscale cloud providers captured 49.2% share of the Europe data center SSD market size in 2024, yet colocation facilities show the highest projected growth at 19.8% CAGR through 2031.
- By country, Germany led with 25.8% of Europe data center SSD market share in 2024, whereas the Netherlands is forecast to post a 17.6% CAGR to 2031.
Competitive positioning in Europe includes both locally based firms and those operating across multiple regions. The market landscape in the global data center ssd industry research shows how these players are arranged internationally.
Europe Data Center SSD Market Trends and Insights
Drivers Impact Analysis*
| Driver | (~)% Impact on CAGR Forecast | Geographic Relevance | Impact Timeline |
|---|---|---|---|
| Surging AI and HPC workloads in European hyperscale data centers accelerating NVMe adoption | +6.20% | Germany, Netherlands, Ireland, France | Medium term (2-4 years) |
| EU Green Deal carbon-neutral mandates favoring energy-efficient SSD infrastructure | +4.80% | EU-wide, strongest in Germany and Netherlands | Long term (≥ 4 years) |
| Declining $/GB of 3D-NAND enabling price-parity with performance HDDs | +3.90% | EU-wide | Short term (≤ 2 years) |
| Edge data-center expansion demanding high-density, low-power SSDs | +2.70% | UK, Germany, France, Nordic countries | Medium term (2-4 years) |
| EU Data Act localization requirements stimulating regional all-flash deployments | +2.10% | EU-wide | Short term (≤ 2 years) |
| Horizon Europe incentives catalyzing computational-storage and CXL-attached SSD uptake | +1.50% | Germany, France, Netherlands | Long term (≥ 4 years) |
| Source: Mordor Intelligence | |||
Surging AI and HPC Workloads in European Hyperscale Data Centers Accelerating NVMe Adoption
Hyperscale operators are re-architecting storage stacks to sustain sequential write speeds above 10 GB/s per drive—levels needed for large language-model checkpointing. Micron’s 9550 NVMe SSD delivers 14.0 GB/s reads at 43% lower active power, illustrating why the Europe data center SSD market is pivoting from SATA and SAS toward PCIe 5.0 and soon PCIe 6.0 [1]Micron Technology, “Micron 9550 NVMe SSD Product Brief,” micron.com. AI training clusters also favor high-endurance TLC drives, while inference nodes increasingly adopt capacity-dense QLC, reinforcing a dual-track procurement strategy across the Europe data center SSD market.
EU Green Deal Carbon-Neutral Mandates Favoring Energy-Efficient SSD Infrastructure
Data centers consumed 18 billion kWh in Germany during 2024, equal to 3.7% of national usage, prompting requirements for 50% renewable energy sourcing in 2025 and complete decarbonization by 2027 [2]JLL, “Data Center Sustainability Trends 2025,” jll.com. SSD arrays draw roughly 80% less power than equivalent HDD arrays, and vendors such as KIOXIA have introduced PCIe 5.0 drives optimized for sub-10 W steady-state operation. These efficiencies allow operators to hit aggressive PUE thresholds, making SSD-first architectures core to compliance plans across the Europe data center SSD market.
Declining $/GB of 3D-NAND Enabling Price Parity with Performance HDDs
Industry roll-out of 321-layer and 400-plus-layer NAND pushes bit cost to record lows. German retail pricing for 1 TB NVMe drives fell to EUR 40 in 2024, a 60% drop from 2022, bringing SSDs within reach of performance HDD budgets. Mass-production gains let vendors defend margins while lowering list prices, accelerating flash adoption in cost-sensitive colocation racks inside the Europe data center SSD market.
Edge Data-Center Expansion Demanding High-Density, Low-Power SSDs
5G backhaul and latency-critical workloads require micro-data centers within 20 km of end users. KIOXIA’s LC9 Series offers 122.88 TB in a 2.5-inch package, enabling edge sites to deploy over 1 PB per 1U without exceeding 20 W per drive. Nordic facilities capitalizing on renewable energy further magnify demand for rugged, temperature-tolerant SSDs within the Europe data center SSD market.
Restraints Impact Analysis*
| Restraint | (~)% Impact on CAGR Forecast | Geographic Relevance | Impact Timeline | ||
|---|---|---|---|---|---|
| NAND price-volatility cycles compressing vendor margins | -3.40% | EU-wide | Short term (≤ 2 years) | ||
| Ongoing controller-IC shortages extending enterprise-SSD lead-times | -2.80% | Germany, Netherlands, France | Medium term (2-4 years) | ||
| Stricter e-waste rules raising lifecycle compliance costs | -1.90% | EU-wide | Long term (≥ 4 years) | ||
| Fragmented NVMe-oF implementations limiting cloud interoperability | -1.30% | Germany, UK, Netherlands | Medium term (2-4 years) | ||
| Source: Mordor Intelligence | |||||
NAND Price-Volatility Cycles Compressing Vendor Margins
Quarter-on-quarter enterprise SSD pricing swung by 20-30% during 2024 as suppliers alternated between capacity cuts and inventory corrections. European channel partners without captive NAND fabs struggled to absorb surcharges, delaying purchase orders and elongating refresh cycles inside the Europe data center SSD market [3].Samsung Electronics, “Q4 2024 Memory Business Results,” samsung.com
Ongoing Controller-IC Shortages Extending Enterprise-SSD Lead Times
Advanced PCIe 5.0 controllers share 7 nm and 5 nm foundry lines with automotive and mobile SoCs. Lead times for enterprise NVMe drives expanded to 16-24 weeks in early 2025, forcing European operators to lock in volume commitments six months ahead, limiting flexibility and raising working-capital needs across the Europe data center SSD market [4].Silicon Motion, “PCIe 6.0 SSD Controller Roadmap,” siliconmotion.com
*Our forecasts treat driver/restraint impacts as directional, not additive. The impact forecasts reflect baseline growth, mix effects, and variable interactions.
Segment Analysis
By Form Factor: Transition from U.2 to Density-Optimized EDSFF
2.5-inch U.2 drives continued to dominate in 2024, capturing 45% of the Europe data center SSD market share thanks to broad server compatibility. However, PCIe add-in cards are widening adoption, expanding at a 21.4% CAGR as AI nodes seek maximum bandwidth per slot. EDSFF designs are scaling from 7.2% penetration in 2022 to a projected 25.9% by 2027. The new E3.S format lets operators pack 60 TB per device, translating to 1.2 PB per rack-unit while reducing watt-per-terabyte by up to 30%. This density upside aligns with rack-space constraints in Frankfurt and Amsterdam hubs, supporting regulatory pressure for greener compute estates within the Europe data center SSD market.
Hyperscalers validate EDSFF through open hardware programs, and component vendors respond with hot-pluggable, front-serviceable trays that remove the need for oversized backplanes. Germany’s financial-trading clusters and the Netherlands’ cloud gaming farms are early adopters, pushing ODMs to prioritize E1.L and E3.S in new server bills of materials. Consequently, 2.5-inch shipments will grow slowly, mostly serving legacy nodes, while EDSFF and add-in cards capture incremental capacity demand throughout the Europe data center SSD market.


By Interface: PCIe Dominance and the Rise of NVMe-oF
PCIe held 70% of the 2024 revenue pie, cementing its role as the backbone interface for modern flash arrays in the Europe data center SSD market. PCIe 5.0 doubles lane bandwidth to 32 GT/s, providing headroom for sequential reads beyond 14 GB/s. NVMe-oF, though only 7% by value today, is scaling at an 18.9% CAGR as operators embrace disaggregated architectures that pool flash behind 100 Gbit/s Ethernet fabrics. Early pain points around vendor-specific transports are easing through Storage Networking Industry Association plug-fests that aim for cross-vendor target-initiator compatibility.
SATA and SAS shipments are in structural decline, but they retain niches in archival tiers and dual-ported mission-critical arrays. Over the forecast horizon, PCIe 6.0 and CXL 3.0-attached storage devices will extend the protocol roadmap, reinforcing performance leadership while enabling memory-semantic access to flash in data-intensive AI pipelines across the Europe data center SSD market.
By NAND Technology: QLC Gains Momentum
TLC accounted for 54% of 2024 billings, offering balanced endurance at acceptable cost per gigabyte. QLC, however, is the fastest mover, advancing at 21.0% CAGR as error-correction and wear-leveling algorithms mature. Meta’s public adoption of QLC for inference clusters illustrates trust in its read-centric endurance profile. Samsung’s 280-layer QLC and Micron’s 232-layer ramps allow 30 TB QLC drives to hit price parity with 3.84 TB performance HDDs, opening fresh demand in logging, content delivery, and cold data pools across the Europe data center SSD market.
By Drive Architecture: Mixed-Use Drives Dominate
Mixed-use 3 DWPD models seized 41.0% revenue in 2024 and exhibit the strongest trajectory, advancing at 22.5% CAGR, as virtualization blurs workload boundaries. Operators prefer one SKU that spans OLTP bursts, analytic queries, and periodic sequential scans. Write-intensive 10 DWPD drives stay critical for financial ledgers, whereas read-intensive 1 DWPD SSDs address CDN caches. Balanced mixed-use portfolios simplify procurement and lower inventory risk throughout the Europe data center SSD market.
By Capacity Range: 2-4 TB Sweet Spot
The 2-4 TB bracket commanded 35.5% share in 2024 and is on track for 23.1% CAGR. This capacity aligns with common DRAM-to-flash ratios in single-socket servers, minimizing stranded capacity and easing rebuild times when failures occur. Cost curves and failure-rate data show 2-4 TB drives deliver 15-20% stronger price-performance than smaller or larger sizes, reinforcing buyer preference inside the Europe data center SSD market.
By End User: Hyperscale Scale vs. Colocation Growth
Hyperscale clouds held 49.2% of 2024 sales, reflecting direct-source contracts and tight integration with SSD roadmaps. Even so, colocation providers display the fastest growth at 19.8% CAGR, as enterprises migrate latency-sensitive workloads into carrier-neutral sites to satisfy data-sovereignty and multicloud strategies. This new demand profile pushes vendors to craft reference architectures optimized for shared-tenancy quality of service, enhancing diversity in the Europe data center SSD market.
Geography Analysis
Germany remains the epicenter of the Europe data center SSD market, securing 25.8% revenue share in 2024 on the strength of its 2,700 MW installed IT load and Frankfurt’s role as DE-CIX’s core switching node. Power-grid stability and clear permitting pathways attract multi-billion-dollar expansions from AWS and Microsoft, both architected around all-flash storage pods to support AI model training. Energy-efficiency mandates compel operators to source 50% renewables already in 2025, a goal met through wind offsets in Schleswig-Holstein and solar feeds in Bavaria, further encouraging SSD over HDD adoption.
The Netherlands is the fastest-growing territory, advancing at 17.6% CAGR through 2031. Google’s USD 640 million extension in Groningen and Amsterdam’s AMS-IX connectivity density draw hyperscale tenants that require PCIe 5.0 flash arrays for cloud gaming and streaming. Sub-1.15 PUE achievements, enabled by indirect evaporative cooling and green-energy PPAs, bolster the case for dense flash deployment in Dutch campuses situated along coastal wind corridors.
The United Kingdom, France, and Ireland supply the next tier of demand. London’s financial-transaction clearing and emerging AI hubs in Cambridge stimulate procurement of write-intensive SSDs, while Paris hosts large-scale AI compute clusters backed by nuclear baseload, lowering carbon intensity per inference. Ireland’s tax incentives continue to attract US tech majors, sustaining steady imports of mixed-use NVMe drives despite power-quota constraints around Dublin. Together these sub-markets inject resilience into the Europe data center SSD market by diversifying beyond a single geography.
Mordor Intelligence tracks the data center ssd market across other major regions such as Africa, North America, and Asia, with additional country-level coverage spanning United States and China, each reflecting localized structural drivers, restraints and more.
Competitive Landscape
Samsung, KIOXIA, Micron, Western Digital, and Solidigm collectively anchor supply with vertically integrated flash and controller stacks. Western Digital’s 2025 spin-off of its NAND division into a separate SanDisk entity underscores a strategic bifurcation between HDD and flash portfolios, allowing sharper R and D alignment with AI-centric workloads. Samsung broadened its portfolio by acquiring HVAC specialist FläktGroup, an unusual move that embeds thermal-management IP into future storage platforms, a differentiator within the Europe data center SSD market.
Mid-tier challengers such as Lightbits Labs and GRAID Technology focus on software-defined and computational storage that offloads processing from host CPUs, promising up to 30% latency cuts in AI-inference paths. Controller makers Phison and Silicon Motion vie for 5 nm mature-node capacity to ship PCIe 6.0 designs that reach 28 GB/s. ODM white-box vendors leverage Open Compute Project specifications to lower entry barriers, accelerating commoditization at the mainstream tier, while premium AI drives remain margin-rich for innovators. Overall, buyer preference is tilting toward suppliers that demonstrate silicon-to-system control plus a credible sustainability roadmap, hallmarks needed to scale inside the Europe data center SSD market.
Europe Data Center SSD Industry Leaders
Samsung Electronics Co., Ltd.
Kioxia Corporation
Western Digital Corporation
Hewlett Packard Enterprise Co.
Silicon Motion Technology Corp.
- *Disclaimer: Major Players sorted in no particular order

Recent Industry Developments
- May 2025: Samsung Electronics acquired FläktGroup for EUR 1.5 billion to enhance data-center cooling integration.
- May 2025: KIOXIA introduced CM9 Series PCIe 5.0 NVMe SSDs offering up to 61.44 TB capacity with 95% higher sequential write throughput than prior generations.
- February 2025: Western Digital completed the separation of its flash business, creating an independent SanDisk entity focused on NAND technologies.
- February 2025: Fluidstack signed a EUR 10 billion agreement with the French government to build a 1 GW AI supercomputer powered by nuclear energy.
- November 2024: Micron rolled out the 6550 ION E3.S 60 TB PCIe 5.0 SSD delivering 12 GB/s at 20 W.


Europe Data Center SSD Market Report Scope
| 2.5-inch (U.2/U.3) |
| M.2 |
| PCIe Add-in Card |
| EDSFF (E1.S/E1.L/E3) |
| SATA |
| SAS |
| PCIe |
| SLC |
| MLC |
| TLC |
| QLC |
| Read-Intensive (1-DWPD) |
| Mixed-Use (3-DWPD) |
| Write-Intensive (10-DWPD) |
| ≤1 TB |
| 1-2 TB |
| 2-4 TB |
| ≥4 TB |
| Hyperscale Cloud Providers |
| Colocation / Carrier-Neutral Facilities |
| Enterprise and Financial Services Data Centers |
| Germany |
| United Kingdom |
| France |
| Netherlands |
| Ireland |
| Rest of Europe |
| By Form Factor | 2.5-inch (U.2/U.3) |
| M.2 | |
| PCIe Add-in Card | |
| EDSFF (E1.S/E1.L/E3) | |
| By Interface | SATA |
| SAS | |
| PCIe | |
| By NAND Technology | SLC |
| MLC | |
| TLC | |
| QLC | |
| By Drive Architecture | Read-Intensive (1-DWPD) |
| Mixed-Use (3-DWPD) | |
| Write-Intensive (10-DWPD) | |
| By Capacity Range | ≤1 TB |
| 1-2 TB | |
| 2-4 TB | |
| ≥4 TB | |
| By End-User | Hyperscale Cloud Providers |
| Colocation / Carrier-Neutral Facilities | |
| Enterprise and Financial Services Data Centers | |
| By Country | Germany |
| United Kingdom | |
| France | |
| Netherlands | |
| Ireland | |
| Rest of Europe |


Key Questions Answered in the Report
What is the Europe data center SSD market size in 2025?
The Europe data center SSD market size stands at USD 8,753.78 million in 2025.
How fast will the Europe data center SSD market grow by 2031?
Revenue is projected to reach USD 25,598.54 million, reflecting a 20.52% CAGR through 2031.
Which country leads the Europe data center SSD market?
Germany holds the lead with 25.8% market share thanks to Frankfurt’s dense interconnection ecosystem.
Why are PCIe interfaces dominating the Europe data center SSD market?
PCIe 5.0 and 6.0 deliver the bandwidth required for AI workloads, giving PCIe 70% share in 2024.
Page last updated on:


