Market Overview
| Study Period | 2019 - 2030 |
|---|---|
| Forecast Data Period | 2025 - 2030 |
| Historical Data Period | 2019 - 2023 |
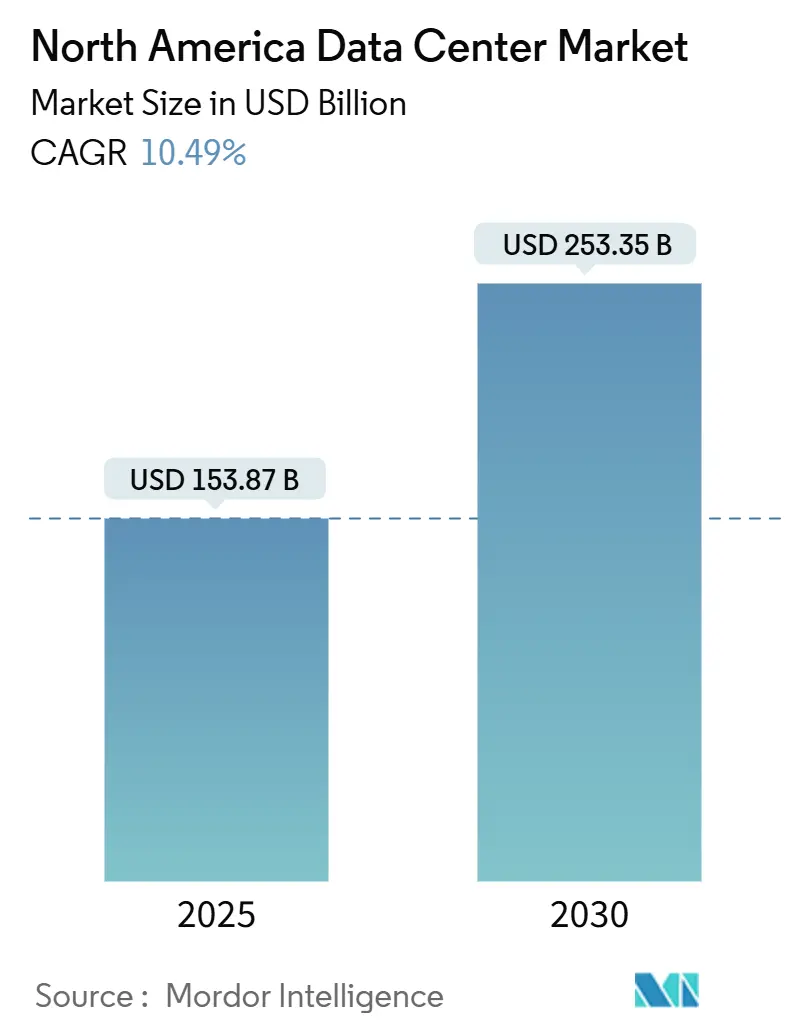
| Market Size (2025) | USD 153.87 Billion |
| Market Size (2030) | USD 253.35 Billion |
| Growth Rate (2025 - 2030) | 10.49% CAGR |
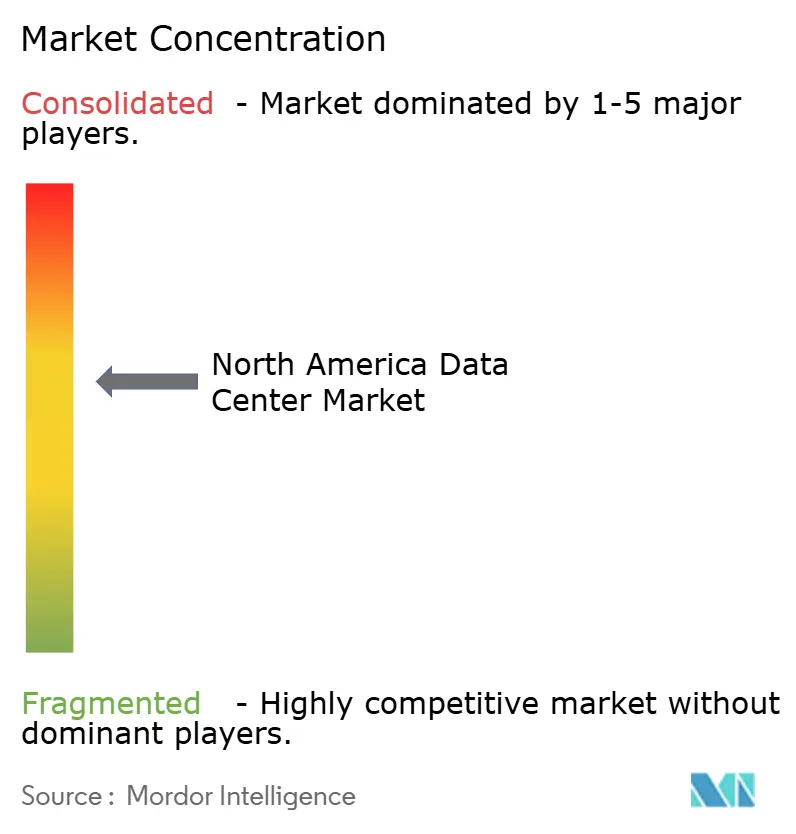
| Market Concentration | Medium |
Major Players *Disclaimer: Major Players sorted in no particular order Image © Mordor Intelligence. Reuse requires attribution under CC BY 4.0. | |
North America Data Center Market Analysis by Mordor Intelligence
The North America Data Center Market size is estimated at USD 153.87 billion in 2025, and is expected to reach USD 253.35 billion by 2030, at a CAGR of 10.49% during the forecast period (2025-2030). In terms of installed base, the market is expected to grow from 60.34 thousand megawatt in 2025 to 114.39 thousand megawatt by 2030, at a CAGR of 13.64% during the forecast period (2025-2030). The market segment shares and estimates are calculated and reported in terms of MW. Intense demand for generative-AI training clusters, each drawing 10-50 MW per hall, keeps new-build pipelines dominated by hyperscale designs optimized for high-density liquid cooling. Colocation operators benefit from preleasing that locks in customers 18-36 months before energization, preserving price discipline even as supply chain delays extend transformer deliveries to 24 months. Geographic diversification gathers momentum as tax-advantaged, renewable-heavy corridors in Texas, Illinois, and Canadian hydro provinces undercut legacy coastal power prices, while small modular reactors (SMRs) enter pilot stages to secure carbon-free baseload supply. Competitive intensity rises because hyperscale self-builds squeeze traditional retail colocation margins, opening white-space niches for edge-cloud and hybrid interconnection platforms.
Key Report Takeaways
- By data center size, medium-scale sites captured 14.93% share of the North America data center market size in 2024, while large campuses are set to climb at a 4.25% CAGR during the forecast window.
- By tier type, Tier 3 infrastructure accounted for 68.94% of the North America data center market share in 2024; Tier 4 is poised to expand at a 5.20% CAGR through 2030.
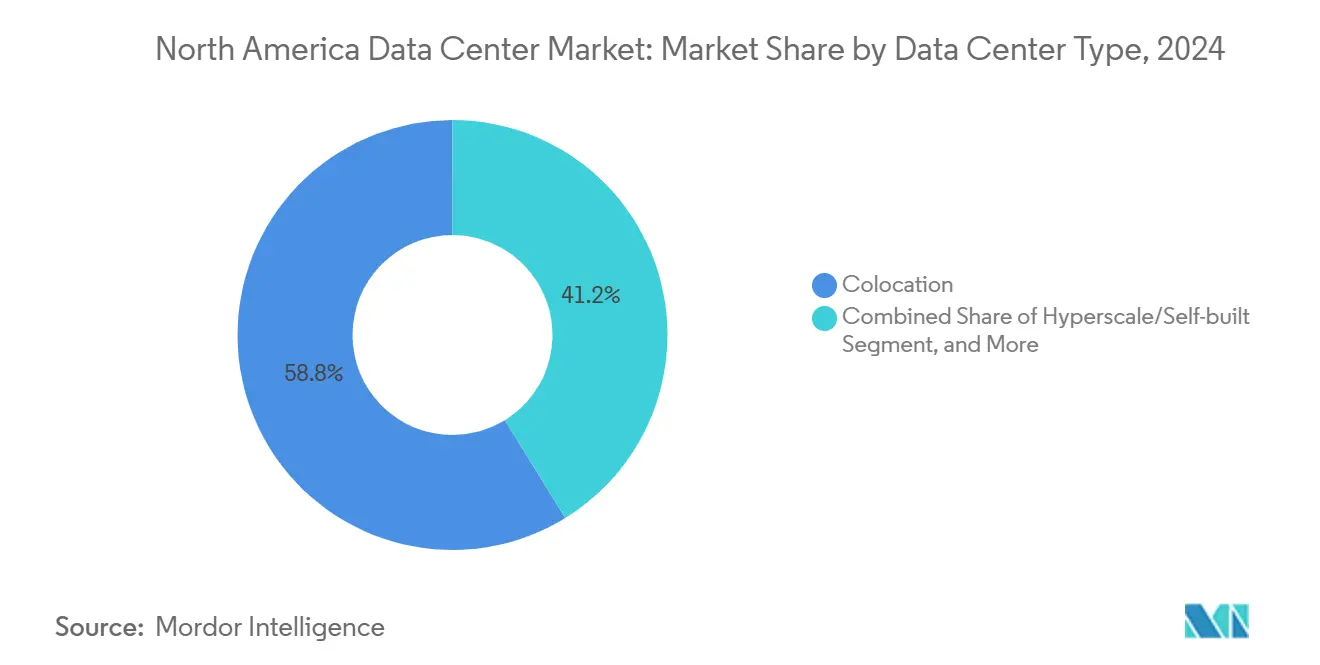
- By data center type, colocation services held 58.79% revenue share in 2024, whereas hyperscale self-built facilities are projected to advance at a 5.10% CAGR through 2030.
- By end user, IT and telecom commanded 68.50% of the North America data center market size in 2024; BFSI leads growth at a 4.39% CAGR through 2030.
- By geography, the United States dominated with 76.54% revenue share in 2024, yet Canada is on course to rise at a 6.00% CAGR to 2030.
North America Data Center Market Trends and Insights
Drivers Impact Analysis
| Driver | (~) % Impact on CAGR Forecast | Geographic Relevance | Impact Timeline |
|---|---|---|---|
| AI and generative-AI workload surge | +1.20% | United States core hyperscale hubs | Short term (≤ 2 years) |
| Record-low vacancy-driven preleasing | +0.80% | U.S. primary markets; spillover into Canada | Medium term (2-4 years) |
| Tax incentives and renewable corridors | +0.60% | Midwest and Southwest U.S.; nationwide Canada | Long term (≥ 4 years) |
| Small modular reactor adoption | +0.40% | U.S. SMR pilot zones; selective Canada | Long term (≥ 4 years) |
| New subsea cable landings | +0.30% | Mid-Atlantic U.S. | Medium term (2-4 years) |
| Rural electric-co-op fiber buildouts | +0.20% | U.S. rural markets | Long term (≥ 4 years) |
| Source: Mordor Intelligence | |||
AI and Generative-AI Workload Surge
Generative-AI model training requires roughly 10-100 times the compute of typical enterprise workloads, driving unprecedented rack densities well beyond 50 kW.[1]NVIDIA Corporation, “Liquid-Cooled Reference Architecture for AI Data Centers,” nvidia.comxAI’s 100,000-GPU Memphis cluster consumes 150 MW and illustrates how hyperscalers now size campuses expressly for accelerated computing demands. Operators respond with liquid and direct-chip cooling, high-amp busways, and 100G/400G optical fabrics that standard Tier 3 halls cannot cost-effectively retrofit. Enterprise buyers follow suit, pre-contracting inference-optimized blocks that piggyback hyperscale design standards. This wave locks in power contracts earlier, lifts land prices in fiber-rich counties, and compresses deployment cycles throughout the North America data center market. The runway remains long because leading LLM providers project parameter counts in the trillions, ensuring continuous refresh of AI-ready capacity.
Record-Low Vacancy-Driven Preleasing
Vacancy in Northern Virginia, Dallas-Fort Worth, and Silicon Valley fell below 2% during 2024, spurring enterprises to reserve suites two years before commissioning. Wholesale colocation pricing in top U.S. metros rose 15-25% year-over-year, a premium operators justify by offering immediate path-to-power plus sustainability credentials. Development capital now flows to secondary U.S. markets such as Columbus and Phoenix, yet transformer constraints keep near-term deliveries tight, reinforcing preleasing discipline. For Canada, low vacancy in Montreal and Toronto channels overflow demand into Calgary and Winnipeg, pushing investors to evaluate 100-MW-plus campuses tied to hydro grids. The result is heightened forward-contract visibility across the North America data center market that underpins steady margin outlooks through 2027.
Tax Incentives and Renewable Power Corridors
State and provincial incentive bundles shave 20-30% from total cost of ownership by marrying tax abatements with guaranteed access to clean power. Texas’s Chapter 313 program offers 10-year property-tax relief and sales-tax exemptions, while ERCOT’s deregulated market enables 24x7 wind-solar purchase agreements.[2]Texas Comptroller, “Data Center Tax Incentives – Chapter 313,” comptroller.texas.govSimilar structures in Quebec provide 15-year fixed-rate hydroelectric contracts, cutting delivered power costs to <USD 0.04/kWh. Operators use these corridors to meet net-zero pledges without purchasing unbundled renewable certificates, reinforcing a migration away from legacy coastal hubs. Over the long term, incentive-driven site selection reshapes the geographic footprint of the North America data center market, spreading infrastructure into lower-population states and provinces with ample land, water, and power headroom.
Small Modular Reactors and On-Site Cogeneration Adoption
SMR technology offers 50-300 MW units that can be co-located within data center campuses, providing carbon-free baseload and grid-island resilience. Microsoft’s 835 MW purchase agreement tied to the Three Mile Island restart showcases early hyperscale commitment to nuclear baseload for AI estates.[3]Microsoft Corporation, “Microsoft Invests $15 Billion in U.S. AI Infrastructure,” microsoft.comWhile NRC approvals push commercial deployment beyond 2028, design-certification wins by several vendors encourage operators to secure interconnection sites adjacent to decommissioned coal plants. Combining SMRs with cogeneration unlocks waste-heat reuse for district heating or adsorption cooling, boosting overall energy efficiency. Over the long term, SMRs can flatten power-price volatility and eliminate grid-curtailment risk, reinforcing hyperscale self-build economics inside the North America data center market.
Restraints Impact Analysis
| Restraint | (~) % Impact on CAGR Forecast | Geographic Relevance | Impact Timeline |
|---|---|---|---|
| Utility transmission bottlenecks | -0.9% | High-growth U.S. clusters | Short term (≤ 2 years) |
| Transformer and switchgear shortages | -0.7% | Global supply chain; U.S. focus | Medium term (2-4 years) |
| Community zoning pushback | -0.4% | U.S. suburban expansion corridors | Medium term (2-4 years) |
| Cooling-water stress in arid markets | -0.3% | Southwest U.S. | Long term (≥ 4 years) |
| Source: Mordor Intelligence | |||
Utility Transmission Bottlenecks
PJM’s interconnection queue contains 40 GW of pending data center load; upgrades valued at USD 15 billion stretch average energization timelines to five years.[4]PJM Interconnection, “Regional Transmission Upgrade Plans,” pjm.comSimilar congestion plagues ERCOT and NYISO, forcing operators to procure temporary diesel generation or relocate builds to less-congested substations. Delays erode return on invested capital and can trigger contractual penalty clauses tied to client go-live dates. Until federal grid-modernization funds flow through 2027, transmission scarcity will temper near-term capacity additions throughout the North America data center market.
Transformer and Switchgear Shortages
Lead times for 100-MVA power transformers now exceed 24 months, triple the historical norm, due to limited global core-steel output and competing renewable-energy orders. Custom medium-voltage switchgear faces comparable delays, compelling developers to preorder equipment before land purchase-locking capital earlier in the project cycle. The constraint disproportionally affects 250-MW-plus campuses that require a dozen step-down transformers, nudging some hyperscalers toward staggered phase commissioning to de-risk schedule slips inside the North America data center market.
Segment Analysis
By Data Center Size: Large Facilities Command AI Scale
Large campuses ranging from 150 MW to 400 MW represent the fastest-growing size band at a 4.25% CAGR, reflecting hyperscalers’ preference for fewer, bigger footprints to streamline GPU cluster consolidation. Medium facilities still hold 14.93% of the North America data center market size, catering to enterprises seeking dedicated suites but lacking hyperscale volumes. Capital efficiency favors large builds because fixed development costs-substation, fiber, water rights-amortize across more IT load, trimming per-MW spend.
The land-banking race concentrates along high-capacity 230-kV transmission corridors where zoning supports multi-hall campuses. Meta’s 2.5 million-sq-ft DeKalb build embodies the template, 300 MW, liquid immersion bays, and onsite 120 MW spare pad to future-proof AI expansions. Insurance carriers flag aggregation risk; as a result, facility-level redundancy rises to N+2 for chillers and UPS blocks. Together, these factors reinforce the primacy of large-scale campuses in sustaining the North America data center market through 2030.


By Tier Type: Tier 4 Adoption Accelerates
Tier 4 halls grew 5.20% CAGR through 2025 and are expected to maintain that clip because fault-tolerant, concurrently maintainable architectures minimize catastrophic GPU training restarts. Tier 3 facilities own 68.94% of the North America data center market share, serving most SaaS and ecommerce tenants that balance uptime against cost. Hardware density drives new Tier 4 design norms such as 100% lithium-ion UPS, segmented power trains, and dual 34.5 kV feeds, lifting capital intensity above USD 15 million per MW.
Financial-services compliance (SOX, PCI DSS) and AI model-training resilience both favor Tier 4, stimulating retrofits of legacy Tier 3 halls with additional distribution paths and controls. The Uptime Institute’s latest Tier Standard clarifies modular expansion methods, prompting operators to pre-plan knock-out panel bays for incremental growth This structured pathway to high availability ensures Tier 4 will capture outsized share of future capex inside the North America data center market.
By Data Center Type: Hyperscale Self-Build Momentum
Self-built hyperscale facilities are forecast to expand 5.10% CAGR, outpacing retail and wholesale colocation, as cloud providers internalize rising AI infrastructure budgets. Colocation retains a 58.79% foothold, offering flexible contracts and network-dense ecosystems for multicloud interconnect. The pivot to self-build stems from economies of scope-cloud operators align power procurement, hardware refresh, and software stack under one umbrella, improving margin leverage.
AWS’s USD 35 billion Virginia expansion typifies the commitment - 12 new halls across two counties, each pre-equipped for liquid cooling and direct-to-chip manifolds. Colocation incumbents counter via powered shell programs and joint ventures that let hyperscalers deploy at scale while retaining operator services. Over the forecast horizon, both models co-exist, but self-builds likely capture incremental high-density GPU deployments at the edge of the North America data center market.
By End User: BFSI Leads Incremental Growth
IT and telecom remains the anchor tenant segment with 68.50% share of the North America data center market size, supplying network, CDN, and multicloud backbone workloads. Yet BFSI is set to expand at a 4.39% CAGR as algorithmic trading, fraud analytics, and real-time risk engines require sub-millisecond data paths. JPMorgan Chase’s 60-facility global estate exemplifies large-bank commitment to private compute enclaves for regulated workloads.
Regulatory thrusts-Basel III, SEC Rule 613 CAT-mandate granular data retention and synchronous replication across redundant spread-trading nodes, necessitating Tier 4 or better availability. Fintech disruptors increasingly colocate adjacent to exchange matching engines, boosting demand for micro-colocation cabinets positioned within 50 feet of latency-critical fiber meet-points. As digitization of finance accelerates, BFSI’s share of new MW adds will continue expanding inside the North America data center market.
Geography Analysis
The United States anchors the North America data center market, holding 76.54% share in 2024 thanks to dense fiber grids and deep capital pools. Virginia’s I-95 corridor alone routes more than 70% of global Internet packets and hosts over 2 GW of active IT load, with Microsoft injecting USD 15 billion for AI server farms across the state during 2025. Transmission congestion, however, pushes incremental builds into Texas, Ohio, and Iowa where deregulated power and workable land banks shorten entitlement cycles. Three hundred-mile dark-fiber spurs keep latency below 12 ms to Ashburn, preserving application-level performance.
Canada charts the fastest ascent, clocking a 6.00% CAGR to 2030 on the back of hydro-rich provinces offering delivered power below USD 0.04/kWh and 15-year rate locks. Quebec’s Investissement Québec program couples these rates with property-tax abatements, drawing hyperscalers and colocation giants to Montreal and Lévis for carbon-neutral capacity. Toronto’s existing metro network lifts cross-border connectivity, letting U.S. enterprises satisfy data-sovereignty rules while avoiding East-Coast grid constraints.
Mexico represents the emergent edge, with federal fiber-backhaul projects linking Mexico City, Guadalajara, and Monterrey by 2026. Nearshoring shifts in electronics and automotive manufacturing raise demand for local private-cloud zones supporting factory automation, while revised data-protection statutes encourage national hosting. Although Mexico’s share remains modest today, growth potential lies in modular 5-10 MW edge nodes proximal to industrial parks, a pattern mirroring rural U.S. electric-co-op builds and incrementally enlarging the overall North America data center market footprint.
Competitive Landscape
Moderate consolidation characterizes the North America data center industry, with the top 10 owners controlling roughly 60% of installed MW yet competing across divergent service models. Hyperscalers invest directly in land, power, and cooling innovation to tailor sites for GPU density, forgoing traditional colocation except for expansion bridging capacity. Colocation majors such as Digital Realty and Equinix pivot toward interconnection fabrics and hybrid-cloud on-ramps, embedding SDN overlays that deliver cross-region latency under 15 ms for enterprise multicloud workloads.
Technology differentiation centers on efficiency and sustainability. Operators deploy coolant-distribution units delivering 100 kW per 45U rack, collaborate with pump makers on dielectric fluids, and pilot zero-scope-1 designs featuring diesel-free emergency fuel cells. NVIDIA’s reference architecture codifies these liquid-cooling standards, driving campus retrofits among incumbents unable to air-cool next-generation GPU boards. Players that master high-density thermal management capture premium AI workloads and lock in multi-year power commitments that stabilize revenue streams inside the North America data center market.
M and A remains a strategic lever. Digital Realty’s USD 2.8 billion acquisition of eight CyrusOne sites added 450 MW to its portfolio while deepening hyperscale ties in Dallas, Phoenix, and Toronto. Investors view brownfield expansions as faster paths to revenue than greenfield builds hindered by equipment shortages. Private-equity-backed entrants purchase suburban industrial parks, convert them to 20-MW “edge metros,” and flip stabilized assets at sub-6% cap rates, maintaining transaction velocity despite rising interest rates.
North America Data Center Industry Leaders
Amazon Web Services, Inc.
Google Inc.
Microsoft Corporation
Digital Realty Trust, Inc.
Equinix Inc.
- *Disclaimer: Major Players sorted in no particular order

Recent Industry Developments
- January 2025: Amazon Web Services announced USD 11 billion expansion across Virginia, adding 12 facilities to satisfy AI and cloud demand.
- December 2024: Microsoft and Constellation restarted Three Mile Island Unit 1, yielding 835 MW of carbon-free power under a 20-year agreement.
- December 2024: Digital Realty Trust acquired eight CyrusOne data centers for USD 2.8 billion, strengthening capacity in Dallas, Phoenix, and Toronto.
- October 2024: Google committed USD 20 billion for new U.S. facilities in Ohio, Texas, and Virginia, each powered by 100% clean energy.


North America Data Center Market Report Scope
The North America data center market report is segmented by data center size (large, massive, medium, mega, and small), tier type (tier 1 and 2, tier 3, and tier 4), data center type (hyperscale/self-built, enterprise/edge, and colocation), end user (BFSI, IT and ITes, E-commerce, government, manufacturing, media and entertainment, telecom, and other end users), and country (United States, Canada, Mexico). The market forecasts are provided in terms of value (USD), and IT load capacity (MW).
By Data Center Size
| Large |
| Massive |
| Medium |
| Mega |
| Small |
By Tier Type
| Tier 1 and 2 |
| Tier 3 |
| Tier 4 |
By Data Center Type
| Hyperscale/Self-built | ||
| Enterprise/Edge | ||
| Colocation | Non-Utilized | |
| Utilized | Retail Colocation | |
| Wholesale Colocation | ||
By End User
| BFSI |
| IT and ITES |
| E-Commerce |
| Government |
| Manufacturing |
| Media and Entertainment |
| Telecom |
| Other End Users |
By Country
| United States |
| Canada |
| Mexico |
| By Data Center Size | Large | ||
| Massive | |||
| Medium | |||
| Mega | |||
| Small | |||
| By Tier Type | Tier 1 and 2 | ||
| Tier 3 | |||
| Tier 4 | |||
| By Data Center Type | Hyperscale/Self-built | ||
| Enterprise/Edge | |||
| Colocation | Non-Utilized | ||
| Utilized | Retail Colocation | ||
| Wholesale Colocation | |||
| By End User | BFSI | ||
| IT and ITES | |||
| E-Commerce | |||
| Government | |||
| Manufacturing | |||
| Media and Entertainment | |||
| Telecom | |||
| Other End Users | |||
| By Country | United States | ||
| Canada | |||
| Mexico | |||


Key Questions Answered in the Report
What is the projected IT load capacity of the North American data center sector by 2030?
Installed IT load is forecast to reach 76,190 MW by 2030, reflecting a 4.19% CAGR from 2025 levels.
Which facility tier is growing fastest across the region?
Tier 4 campuses lead with a 5.20% CAGR as AI and financial-trading users demand fault-tolerant uptime.
Why are operators favoring large campuses over distributed sites?
Concentrating 150-300 MW of load in single locations lowers per-MW capital costs and simplifies liquid-cooling deployment for GPU clusters.
Which country has the biggest share in the North America Data Center Market?
In 2025, United States accounts for the largest share by country in the North America Data Center Market.
How do Canada’s power prices compare with major U.S. hubs?
Hydro-rich provinces offer delivered electricity below USD 0.04/kWh-around 30-40% cheaper than many U.S. coastal metros.
What supply-chain issue most affects near-term capacity delivery?
Long-lead power transformers now carry 24-month lead times, delaying energization of hyperscale halls across several U.S. markets.
Which end-user segment shows the highest incremental growth?
Banking, financial services, and insurance workloads are expanding at 4.39% CAGR as algorithmic trading and compliance needs intensify.
Page last updated on:


