United States Data Center SSD Market Size and Share
Market Overview
| Study Period | 2019 - 2031 |
|---|---|
| Forecast Data Period | 2025 - 2031 |
| Historical Data Period | 2019 - 2023 |
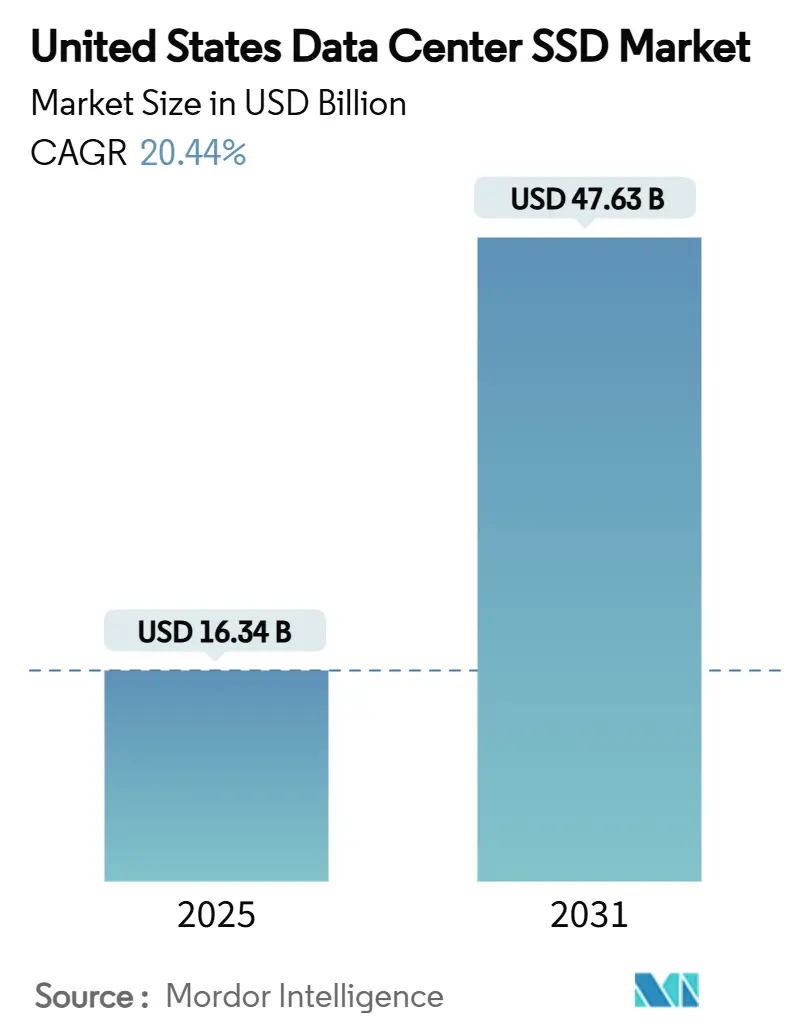
| Market Size (2025) | USD 16.34 Billion |
| Market Size (2030) | USD 47.63 Billion |
| Growth Rate (2025 - 2031) | 20.44% CAGR |
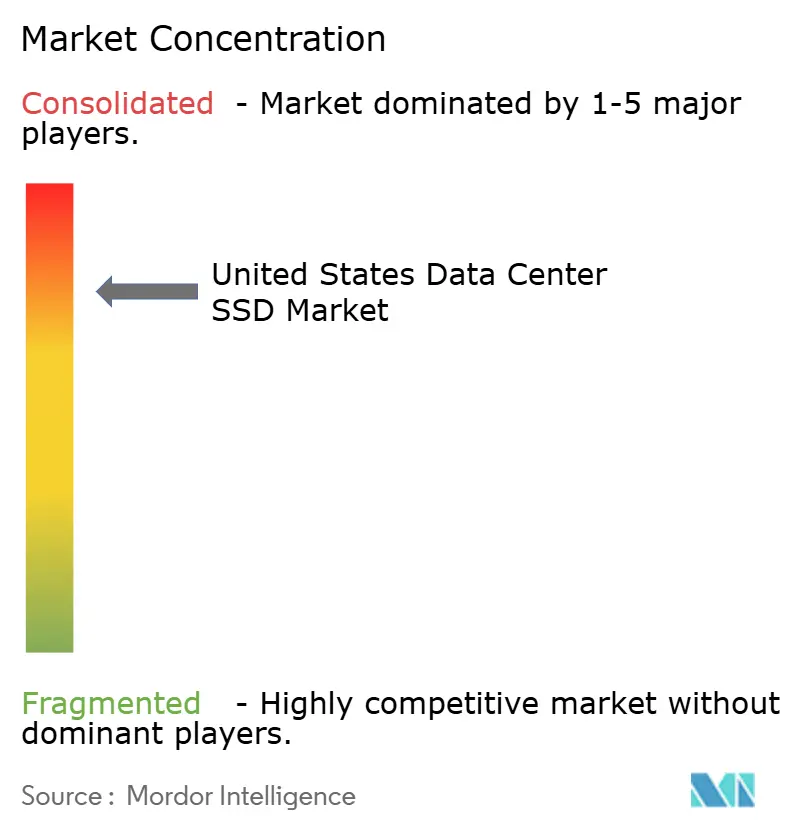
| Market Concentration | High |
Major Players *Disclaimer: Major Players sorted in no particular order Image © Mordor Intelligence. Reuse requires attribution under CC BY 4.0. | |
United States Data Center SSD Market Analysis by Mordor Intelligence
The United States data center SSD market size stands at USD 16.34 billion in 2025 and is forecast to surge to USD 47.63 billion by 2031, expanding at a 20.44% CAGR between 2025-2030. This momentum is anchored in AI model training, real-time inference, and the sweeping modernization of hyperscale and enterprise infrastructure. Adoption of PCIe Gen4/Gen5 NVMe drives is removing historical I/O bottlenecks, while sustainability mandates are accelerating all-flash strategies that trim power draw by as much as 75% versus hybrid arrays. Form-factor innovation around EDSFF E3.S improves thermal headroom and serviceability, creating a pathway for higher power budgets that unlock next-generation throughput. Vendor differentiation is crystallizing around controller architecture, 3D-NAND stacking, and embedded security, yet supply volatility in advanced controller ICs and NAND wafers continues to reshape procurement strategies. Capacity points ≥4 TB are exhibiting the fastest demand uptick as operators seek higher rack densities and lower total cost of ownership.
Key Report Takeaways
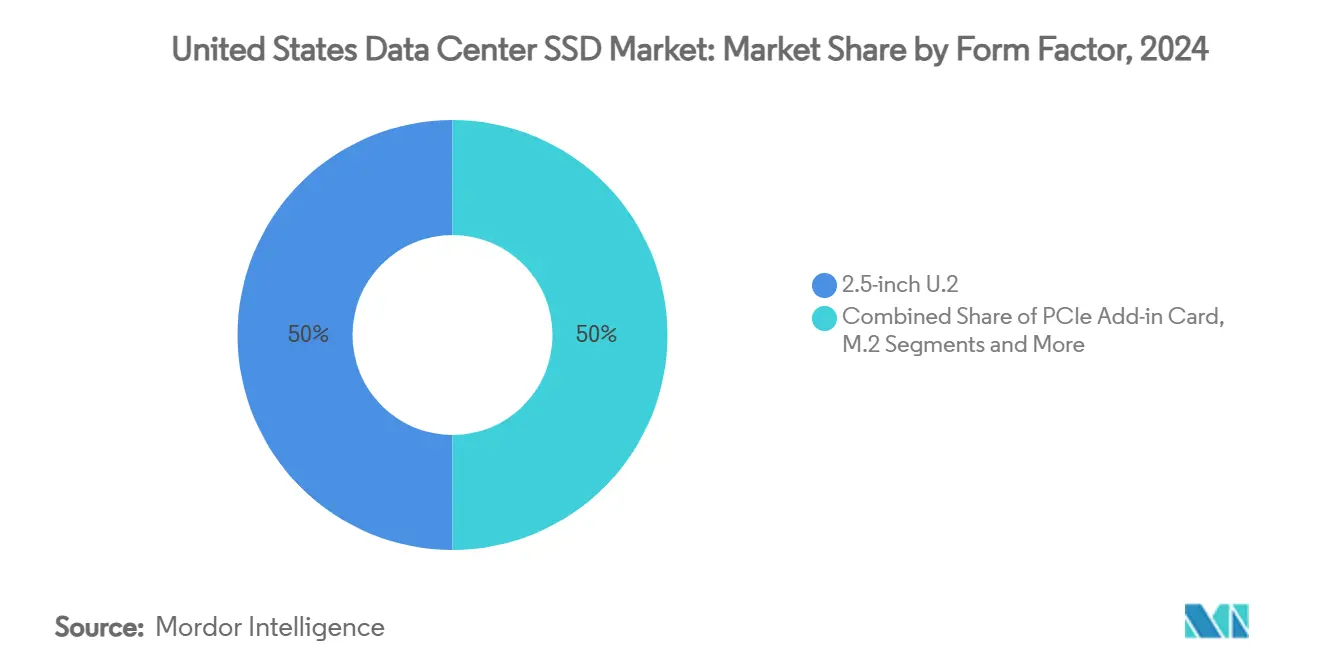
- By form factor, 2.5-inch U.2 maintained 50% revenue share of the United States data center SSD market in 2024, while EDSFF E3.S is projected to rise at 22.01% CAGR through 2030.
- By interface, PCIe/NVMe Gen4 captured 55% of the United States data center SSD market share in 2024; PCIe/NVMe Gen5 is forecast to post 22.40% CAGR to 2030.
- By NAND technology, TLC accounted for 65% share of the United States data center SSD market size in 2024, whereas QLC is expected to record 22.30% CAGR during 2025-2030.
- By drive architecture, read-intensive units led with 55% share in 2024; mixed-use drives are on track for 21.50% CAGR over the forecast horizon.
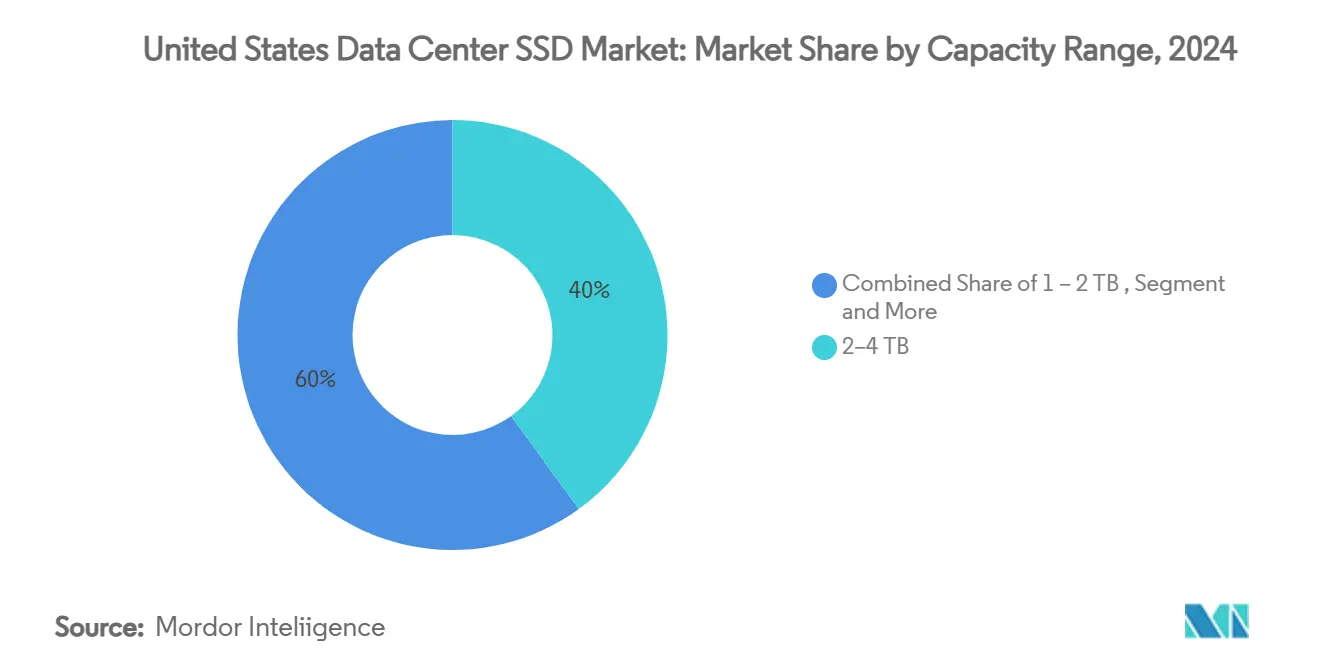
- By capacity range, the 2-4 TB band held 40% share of the United States data center SSD market size in 2024; ≥4 TB drives will grow at 22.81% CAGR through 2030.
- By end-user, hyperscale cloud providers commanded 58.7% share in 2024 and are projected to grow 22.61% CAGR to 2030.
- Samsung, Western Digital, Micron, and Kioxia collectively controlled roughly 70% of 2024 industry revenues.
United states contributes to a system defined not by any single country or region but by the interaction of many. The global data center ssd market data by Mordor Intelligence represents that combined structure.
United States Data Center SSD Market Trends and Insights
Drivers Impact Analysis*
| DRIVER | (~) % IMPACT ON CAGR FORECAST | GEOGRAPHIC RELEVANCE | IMPACT TIMELINE |
|---|---|---|---|
| AI and HPC workloads accelerating NVMe adoption | +6.2% | National, concentrated in hyperscale regions | Medium term (2-4 years) |
| Data-center sustainability mandates driving all-flash transition | +5.8% | National, early gains in California, Texas, Virginia | Long term (≥ 4 years) |
| PCIe Gen4/5 ramp unlocking next-gen throughput | +4.7% | National, led by hyperscale and enterprise segments | Short term (≤ 2 years) |
| Cloud migration from hybrid to all-flash architectures | +4.1% | National, concentrated in cloud service provider hubs | Medium term (2-4 years) |
| OCP 2.0 firmware standardization cutting qualification cycles | +2.9% | National, primarily hyperscale data centers | Short term (≤ 2 years) |
| Accelerated depreciation (IRS §179) boosting SSD capex affordability | +1.8% | National, benefiting mid-market enterprises | Short term (≤ 2 years) |
| Source: Mordor Intelligence | |||
AI and HPC Workloads Accelerating NVMe Adoption
GPU clusters used for model training demand up to 100 MB/s per terabyte, compelling operators to migrate from SATA to PCIe Gen5 NVMe drives that sustain more than 14 GB/s sequential throughput.[1]Derek Dicker, “AI Workloads and the Need for PCIe Gen5 Storage,” micron.com Annual SSD unit demand linked to AI servers grew 35% in 2024 and is projected to triple by 2030 as model sizes expand and vector databases proliferate. Hyperscalers are co-locating high-capacity NVMe pools with compute to remove network latency and shorten checkpoint intervals for transformer models. Inference clusters that underpin retrieval-augmented generation are driving 105% year-on-year storage capacity growth, reinforcing the need for low-latency flash closer to accelerators. These dynamics collectively reinforce sustained spending on PCIe Gen5 devices within the United States data center SSD market.
Data-Center Sustainability Mandates Driving All-Flash Transition
Enterprises shifting from hybrid arrays to all-flash racks are realizing 62% lower power draw and 70% smaller physical footprints, translating into a 41% total-cost-of-ownership improvement over HDD-based systems.[2]Angela Spidi, “Why All-Flash Lowers Data-Center Carbon Footprints,” hitachivantara.com Carbon-neutrality pledges are pushing operators to upgrade storage when seeking better Power Usage Effectiveness scores and reduced Scope 2 emissions. SSD vendors able to document circular-economy practices and lower embodied carbon enjoy preferential procurement status. Flash density advances further reinforce sustainability aims by packing more bytes per rack unit and minimizing cooling loads, particularly in facilities across California’s and Virginia’s mature hyperscale corridors.
PCIe Gen4/5 Ramp Unlocking Next-Gen Throughput
Moving from PCIe Gen3 to Gen4/5 lifts sequential reads from 3.5 GB/s to beyond 14 GB/s and pushes random IOPS past 3 million.[3]Patrick Kennedy, “Thermal Challenges of PCIe Gen5 Drives,” tomshardware.com That benefit is partially offset by thermal challenges; air-cooled Gen5 drives often require dedicated 10,000 RPM fans or liquid loops to avoid throttling. Controller designs fabricated on 7 nm nodes mitigate power spikes, helping enterprise users satisfy latency objectives for real-time analytics. Early adopters in financial services report single-query response times shrinking below 200 µs once Gen5 drives replace Gen3 arrays. These throughput gains underpin many forecast assumptions for the United States data center SSD market.
Cloud Migration from Hybrid to All-Flash Architectures
Hyperscale providers such as AWS, Microsoft Azure, and Google Cloud are phasing out HDD tiers in favor of high-capacity QLC SSD pools that support petabyte-scale AI data sets without compromising service-level agreements. Larger drives simplify fleet management, reduce repair truck-rolls, and enhance reliability. Enterprises modernizing applications around containers and micro-services expect consistent sub-millisecond latency, spurring cloud operators to pre-provision flash-only storage classes. This feedback loop accelerates volume contracts for ≥4 TB devices and reinforces long-run demand expectations.
Restraints Impact Analysis*
| RESTRAINTS | (~) % IMPACT ON CAGR FORECAST | GEOGRAPHIC RELEVANCE | IMPACT TIMELINE |
|---|---|---|---|
| NAND price volatility compressing vendor margins | -3.4% | Global, concentrated impact on US manufacturing | Medium term (2-4 years) |
| Advanced controller-IC supply constraints | -2.8% | National, affecting all market segments | Short term (≤ 2 years) |
| Thermal/airflow limits in legacy racks retarding EDSFF adoption | -2.1% | National, primarily affecting enterprise data centers | Medium term (2-4 years) |
| Zero-trust security certification delays for PCIe Gen5 drives | -1.9% | National, concentrated in regulated industries | Short term (≤ 2 years) |
| Source: Mordor Intelligence | |||
NAND Price Volatility Compressing Vendor Margins
Flash wafer prices climbed more than 50% during 2024 after producers cut output to repair profitability, causing unexpected budget swings for cloud and enterprise buyers. Substrate shortages and constrained high-K dielectric supply chains are expected to maintain upward pressure through 2026. Vendors have responded by renegotiating long-term supply accords and prioritizing hyperscale volumes, but smaller buyers face higher spot prices. Margin compression limits RandD budgets for second-tier suppliers, potentially reducing product diversity in the United States data center SSD market.
Advanced Controller-IC Supply Constraints
High-performance controllers fabricated on 7 nm nodes remain in tight supply, with lead times surpassing 45 weeks for PCIe Gen5 designs. The CHIPS Act funnels USD 6.1 billion toward domestic fabs, yet new capacity will not meaningfully reduce shortages until 2027. Allocation policies force SSD makers to favor enterprise SKUs, delaying availability of cost-optimized QLC models for mid-market users.
*Our forecasts treat driver/restraint impacts as directional, not additive. The impact forecasts reflect baseline growth, mix effects, and variable interactions.
Segment Analysis
By Form Factor: EDSFF Emergence Reshapes Infrastructure
The United States data center SSD market size for 2.5-inch U.2 form factors represented half of 2024 revenues, highlighting entrenched infrastructure preferences. EDSFF E3.S, however, is tracking a 22.01% CAGR, propelled by its larger power envelope and superior thermals suitable for PCIe Gen5 controllers. Operators appreciate the tool-less sled and front-serviceable design, which lower mean-time-to-repair. Although M.2 maintains a foothold in GPU nodes, its 8 W thermal ceiling limits capacity growth. PCIe add-in cards remain a niche solution used for burst-write caching and latency-critical ingest workloads. Migration economics also favor EDSFF as bay-count per RU improves, raising rack-level density by up to 33% relative to U.2.
EDSFF adoption benefits from coordinated standardization within the Open Compute Project, giving hyperscalers confidence to commit to multi-year roadmaps. Meta’s Yosemite v3 trays and Microsoft’s Olympus servers both ship with E3.S slots that can dissipate 20-25 W continuously, a prerequisite for Gen5 performance. Early pilots report 15-20 °C lower controller temperatures, translating into sustained 14 GB/s reads without throttling. Suppliers such as Kioxia, Samsung, and Solidigm have launched EDSFF families that emphasize service-life telemetry, reinforcing enterprise interest in proactive maintenance. As volume scales, manufacturing cost gaps against legacy U.2 products are narrowing, signaling broader crossover by 2027.


By Interface: PCIe Gen5 Drives Next-Generation Performance
PCIe/NVMe Gen4 devices accounted for 55% 2024 revenue share, yet Gen5 is set to log a 22.40% CAGR as thermals stabilize and components commoditize. While SATA persists in archival or edge appliances, its inability to exceed 550 MB/s limits relevance for AI pipelines. SAS dual-port drives still populate mission-critical arrays in financial services, but NVMe multipathing is eroding that niche. Early Gen5 units ship with 4-lane 32 GT/s interfaces, quadrupling Gen3 throughput and slashing p99 latency below 100 µs.
Thermal mitigation advances underpin Gen5 economics. Copper heat-spreaders integrated into drive lids, dynamic PWM fan profiles, and firmware-defined throttling help maintain steady-state performance. Vendors also exploit 7 nm controller nodes to drop active power per terabyte, a prerequisite for SLA-driven colocation budgets. The next leap—PCIe Gen6 at 64 GT/s—is already in engineering validation, but sustained adoption hinges on further improvements in signal integrity and power efficiency. Given that many operators amortize servers over five years, Gen4 and Gen5 will coexist, creating a multi-generation replacement cycle that lifts unit demand.
By NAND Technology: QLC Adoption Accelerates
TLC technology delivered 65% of 2024 revenue thanks to its balanced endurance and cost metrics, yet QLC is forecast to expand at 22.30% CAGR as hyperscalers prioritize capacity over write tolerance. Vendors employ adaptive LDPC and machine-learning-enhanced wear leveling to push QLC endurance toward 1,000 P/E cycles, adequate for read-dominant data lakes. With flash-layer counts now surpassing 400, single die capacity breaches 1 Tb, enabling 61 TB drives in a standard 15 mm height.
Cost reduction is compelling: QLC drives cut dollars-per-terabyte by 15-20% against TLC, narrowing the headroom HDD once enjoyed. As intelligent tiering engines shift cold blocks to object stores, write-amplification concerns diminish, opening mainstream database backup and log archiving to QLC. Research roadmaps anticipate 1,000-layer stacks by 2027 that will underpin ≥200 TB drives, reshaping rack designs around fewer, denser sleds. Nevertheless, mission-critical OLTP still favors TLC, preserving a dual-technology landscape across the United States data center SSD market.
By Drive Architecture: Mixed-Use Gains Momentum
Read-intensive SKUs captured 55% share in 2024 behind content delivery networks and streaming analytics. Mixed-use drives are now charting a 21.50% CAGR because AI workloads exhibit unpredictable write bursts during checkpointing. Vendors integrate dynamic SLC caches that expand during sustained writes, maintaining low latency without sacrificing endurance. Advancements in error recovery allow drive firmware to oscillate between read-optimized and write-optimized operational modes based on workload telemetry.
IDC logs show enterprises simplifying procurement by standardizing on mixed-use models to avoid over-provisioning niche SKUs. This shift reduces spare part count, streamlines qualification, and better aligns with continuous deployment rhythms. Write-intensive drives retain a foothold in high-frequency trading and database redo-log caching, but shrinking segment share demonstrates broader convergence toward multi-purpose architectures.
By Capacity Range: High-Capacity Drives Dominate Growth
Drives in the 2-4 TB range supplied 40% of 2024 demand because they match one-year AI training data set expansions and fit within legacy server bays. Yet ≥4 TB units will accelerate at 22.81% CAGR fuelled by higher layer-count NAND and better error-correction coding. Solidigm’s 61 TB E3.S and 122.88 TB E3.L offerings already deliver up to 67% rack-density gains while dropping wattage per terabyte by 40%. Multi-detector readers confirm that hyperscalers are renegotiating power contracts contingent on ultra-dense flash footprints that permit data center buildouts within constrained substation limits.
Edge deployments still consume ≤1 TB modules because of environmental hardening and cost, but aggregate volume remains modest. As software-defined storage stacks mature, tiering can segregate hot and warm blocks within a single high-capacity device, further tilting economics toward large drives. Industry experts thus expect blended fleet capacity per server to triple by 2030.
By End-User: Hyperscale Providers Drive Innovation
Hyperscale cloud providers captured 58.7% of 2024 revenues and are projected to grow 22.61% CAGR on the back of AI SuperPOD builds that integrate tens of thousands of GPUs with NVMe fabrics. Volume purchasing power enables these firms to codify standards through the Open Compute Project, shortening design-win windows for new NAND generations. Colocation and carrier-neutral facilities are benefitting from enterprise offloads that seek low-latency connections to public cloud on-ramps, reinforcing SSD demand for multi-tenant storage nodes. Financial-services operators adopt premium drives that meet stringent deterministic latency and FIPS certification, further segmenting the market.
Edge and metro data centers are emerging as a discrete end-user class. Telco-led 5G rollouts deploy ruggedized NVMe to support user-plane function caching and AI inferencing at cell sites. Although unit volumes trail hyperscale builds, the sheer number of edge nodes promises sustained pull-through for smaller capacity SKUs. This heterogeneity illustrates why the United States data center SSD market remains one of the most dynamic flash ecosystems globally.
Geography Analysis
The United States data center SSD market size is tightly coupled to the country’s four flagship hyperscale regions—Northern Virginia, Northern California, Texas’s “Silicon Prairie,” and the Pacific Northwest—yet expansion is increasingly radiating toward the Southeast and Midwest. In the Pacific time zone, land prices and environmental regulations push operators to pursue vertical racks and high-density flash as a lever to manage power budgets. Washington’s abundant hydroelectricity attracts AI cluster builds that commit to multi-gigawatt footprints over multi-year horizons. Energy-efficient Gen5 SSDs help satisfy utility-imposed power-cap contracts, making flash procurement a critical path item for site approvals.
Northern Virginia’s “Data Center Alley” remains the world’s largest single aggregation of leased capacity, and its sub-millisecond round-trip latency to Eastern seaboard population hubs explains persistent demand for high-performance SSD arrays. Operators have tested liquid immersion cooling paired with E3.S trays to fit more GPUs per square foot, a strategy impossible without flash because HDDs fail under immersion. Texas continues attracting hyperscalers with low electricity costs and proactive renewable-energy incentives. Solar arrays near Austin feed campus-scale facilities that lean on >4 TB SSDs to minimize rack counts and simplify airflow designs under hot-aisle-containment.
The Midwest is emerging as the next growth pole. Ample wind generation and cooler ambient temperatures lower PUE baselines, opening the door for AI-ready campuses in Iowa, Ohio, and Nebraska. Edge facilities cluster around Chicago and St. Louis to support content caching and fraud analytics. Southeast metros such as Atlanta and Charlotte benefit from robust fiber routes and hurricane-resilient infrastructure, drawing financial-services firms that demand FIPS-certified Gen5 drives. Federal incentives through the CHIPS Act further tilt investment inland by underwriting new NAND and controller fabs in Idaho and New York, strengthening supply-chain autonomy for the United States data center SSD market.
The data center ssd market is analyzed by Mordor Intelligence across multiple other geographies, with in-depth regional assessments available for Asia, Europe, and Latin America. This is complemented by country-specific insights for China, reflecting various localized market behavior and policy environments' coverage.
Competitive Landscape
Samsung, Western Digital, Micron, and Kioxia wield a collective 70% share, leveraging vertical integration across NAND, controller design, and firmware stacks. Samsung’s 10th-generation V-NAND surpasses 400 layers and delivers 5.6 GT/s I/O speeds, while Western Digital pairs vertically integrated NAND with RapidFlex Ethernet fabrics that enable JBOF disaggregation. Micron’s G9 QLC die boosts bytes per wafer and underpins many hyperscale deployments pursuing lowest dollars-per-terabyte metrics. Kioxia champions EDSFF and has released Gen5 CM9 drives that supply 14.8 GB/s reads in U.2 and E3.S profiles.
Second-tier players differentiate through niche use cases. Solidigm focuses on ultra-high-capacity QLC units optimized for AI streaming, whereas Seagate’s Nytro line targets SAS environments requiring dual-port redundancy. Start-ups such as NGD Systems and ScaleFlux embed ARM cores and FPGAs inside SSDs to process data in-situ, offloading CPUs and reducing east-west traffic. Partnerships shape roadmaps: Pure Storage collaborates with Micron to co-design energy-efficient arrays, and Facebook’s OCP consortium influences firmware features, telemetry schemas, and form-factor dimensions.
Supply-chain shocks favor large incumbents with captive NAND and controller lines. Smaller OEMs depend on merchant controllers and spot-market NAND, exposing them to price spikes. Certification backlogs around FIPS 140-3 and Common Criteria further advantage established vendors with dedicated compliance teams. Looking forward, competition will intensify around computational storage, Gen6 readiness, and sustainability scoring, but near-term market share movement should remain incremental given significant qualification frictions inside hyperscale fleets.
United States Data Center SSD Industry Leaders
Samsung Electronics
Western Digital
Micron Technology
Kioxia
Seagate Technology Holdings plc
- *Disclaimer: Major Players sorted in no particular order

Recent Industry Developments
- May 2025: Kioxia unveiled CM9 Series PCIe 5.0 NVMe SSDs delivering 14.8 GB/s reads and capacities up to 61.44 TB.
- March 2025: Samsung introduced 9100 PRO Series Gen5 SSDs featuring advanced thermal management for enterprise AI clusters.
- March 2025: Samsung revealed 10th-gen V-NAND with >400 layers and 5.6 GT/s interface speeds.
- February 2025: Pure Storage and Micron deepened collaboration around G9 QLC-based energy-efficient platforms.


United States Data Center SSD Market Report Scope
| 2.5-inch (U.2/U.3) |
| M.2 |
| PCIe Add-in Card |
| EDSFF (E1.S / E1.L / E3) |
| SATA | |
| SAS | |
| PCIe | PCIe/NVMe Gen3 |
| PCIe/NVMe Gen4 | |
| PCIe/NVMe Gen5 | |
| PCIe/NVMe Gen6 |
| SLC |
| MLC |
| TLC |
| QLC |
| Read-Intensive (1-DWPD) |
| Mixed-Use (3-DWPD) |
| Write-Intensive (10-DWPD) |
| ≤ 1 TB |
| 1 – 2 TB |
| 2 – 4 TB |
| ≥ 4 TB |
| Hyperscale Cloud Providers |
| Colocation / Carrier-Neutral Facilities |
| Enterprise and Financial Services Data Centers |
| By Form Factor | 2.5-inch (U.2/U.3) | |
| M.2 | ||
| PCIe Add-in Card | ||
| EDSFF (E1.S / E1.L / E3) | ||
| By Interface | SATA | |
| SAS | ||
| PCIe | PCIe/NVMe Gen3 | |
| PCIe/NVMe Gen4 | ||
| PCIe/NVMe Gen5 | ||
| PCIe/NVMe Gen6 | ||
| By NAND Technology | SLC | |
| MLC | ||
| TLC | ||
| QLC | ||
| By Drive Architecture | Read-Intensive (1-DWPD) | |
| Mixed-Use (3-DWPD) | ||
| Write-Intensive (10-DWPD) | ||
| By Capacity Range | ≤ 1 TB | |
| 1 – 2 TB | ||
| 2 – 4 TB | ||
| ≥ 4 TB | ||
| By End-User | Hyperscale Cloud Providers | |
| Colocation / Carrier-Neutral Facilities | ||
| Enterprise and Financial Services Data Centers | ||


Key Questions Answered in the Report
What is the current size of the United States data center SSD market?
The market is valued at USD 16.34 billion in 2025 and is forecast to reach USD 47.63 billion by 2031.
Which segment is growing the fastest by form factor?
EDSFF E3.S drives are expanding at 22.01% CAGR as hyperscalers adopt higher-power, thermally efficient sleds.
How big is the opportunity for PCIe Gen5 SSDs?
PCIe Gen5 units are projected to post a 22.40% CAGR thanks to AI workloads requiring 14 GB/s+ throughput and multi-million IOPS.
Why are ≥4 TB drives important?
High-capacity SSDs ≥4 TB will grow 22.81% CAGR because they boost rack density and cut power per terabyte by up to 40%.
Which end-user group buys the most SSDs?
Hyperscale cloud providers hold 58.7% of 2024 demand and continue to expand fleets rapidly to support AI services.
How will NAND price volatility affect procurement?
Recent 50% price swings force operators to secure long-term supply contracts or risk budget overruns during capacity expansions.
Page last updated on:


