China Data Center SSD Market Size and Share
Market Overview
| Study Period | 2019 - 2031 |
|---|---|
| Forecast Data Period | 2025 - 2031 |
| Historical Data Period | 2019 - 2023 |
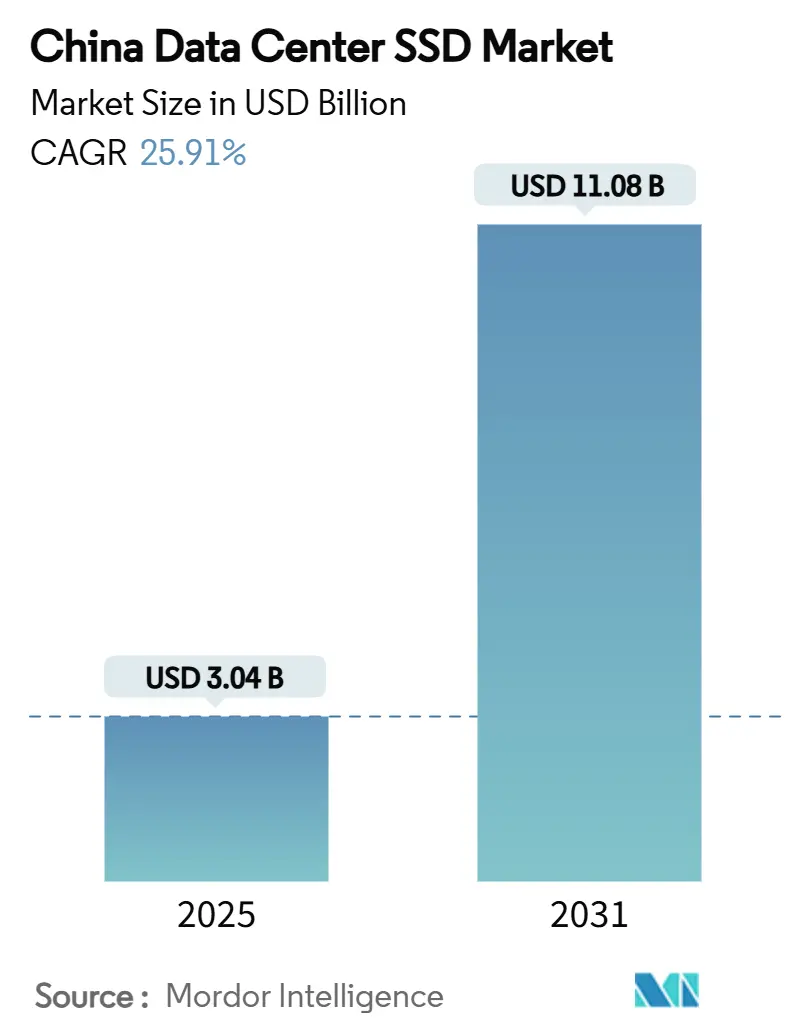
| Market Size (2025) | USD 3.04 Billion |
| Market Size (2031) | USD 11.08 Billion |
| Growth Rate (2025 - 2031) | 25.91% CAGR |
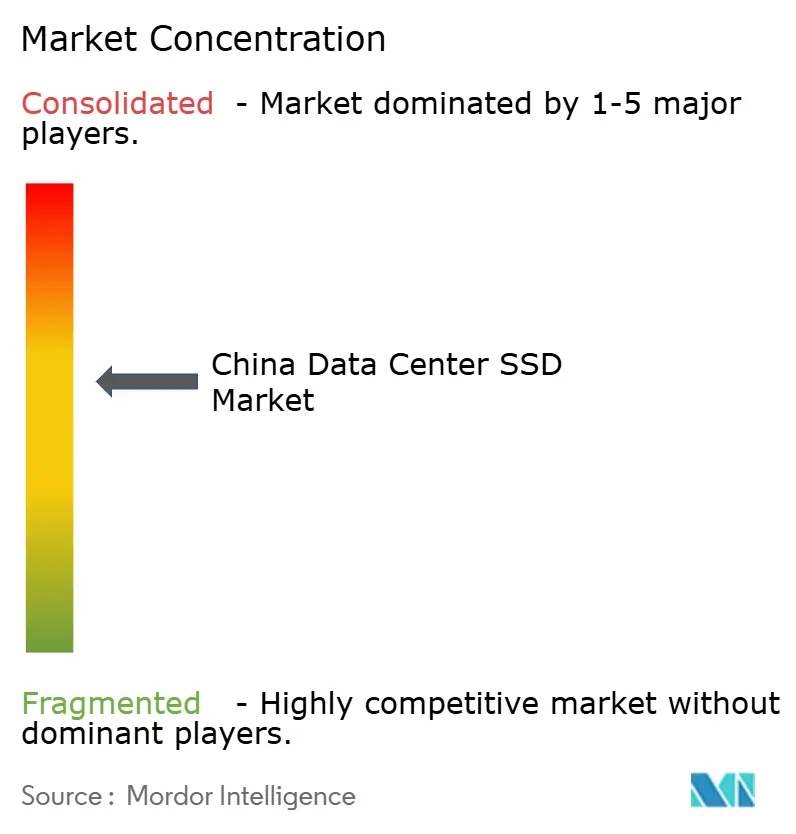
| Market Concentration | Medium |
Major Players *Disclaimer: Major Players sorted in no particular order Image © Mordor Intelligence. Reuse requires attribution under CC BY 4.0. | |
China Data Center SSD Market Analysis by Mordor Intelligence
The China data center SSD market size stands at USD 3.04 billion in 2025 and is forecast to reach USD 11.08 billion by 2031, translating into a robust 25.91% CAGR over 2025-2030. This momentum is anchored in large-scale AI deployments, accelerated cloud adoption, and government programs—most notably the “East Data, West Compute” initiative—that make solid-state technology a national digital infrastructure priority. Hyperscale cloud providers now deploy all-flash arrays to shrink training times for large language models, while stricter carbon-neutral mandates elevate SSDs over power-hungry hard disks. Policy incentives catalyze domestic NAND production, allowing local manufacturers to close the cost gap with HDDs. At the same time, controller innovation is keeping bandwidth gains on pace with compute upgrades, ensuring that interface transitions from PCIe 4.0 to 5.0 do not bottleneck GPU clusters. Collectively, these forces align capital, regulation, and technology toward sustained market expansion.
Key Report Takeaways
- By end-user, hyperscale cloud providers held 72% of the China data center SSD market share in 2024 and are projected to post the fastest 27.61% CAGR through 2030.
- By interface, PCIe/NVMe Gen4 led with 75.3% revenue share in 2024, whereas PCIe/NVMe Gen5 is poised for the highest 24.50% CAGR to 2030.
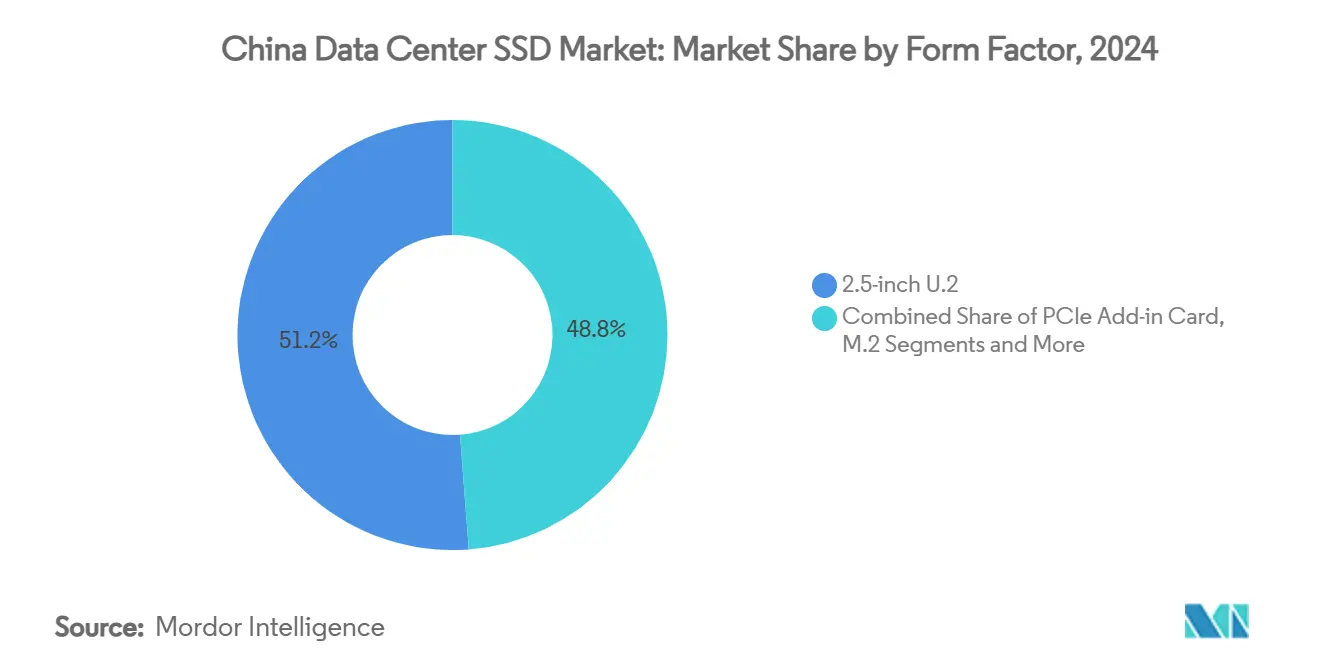
- By form factor, 2.5-inch U.2 retained 51.2% share in 2024, while EDSFF E1.L is forecast to advance at a 26.21% CAGR.
- By NAND technology, TLC commanded 78.1% share in 2024 and QLC is growing fastest at 24.70% CAGR.
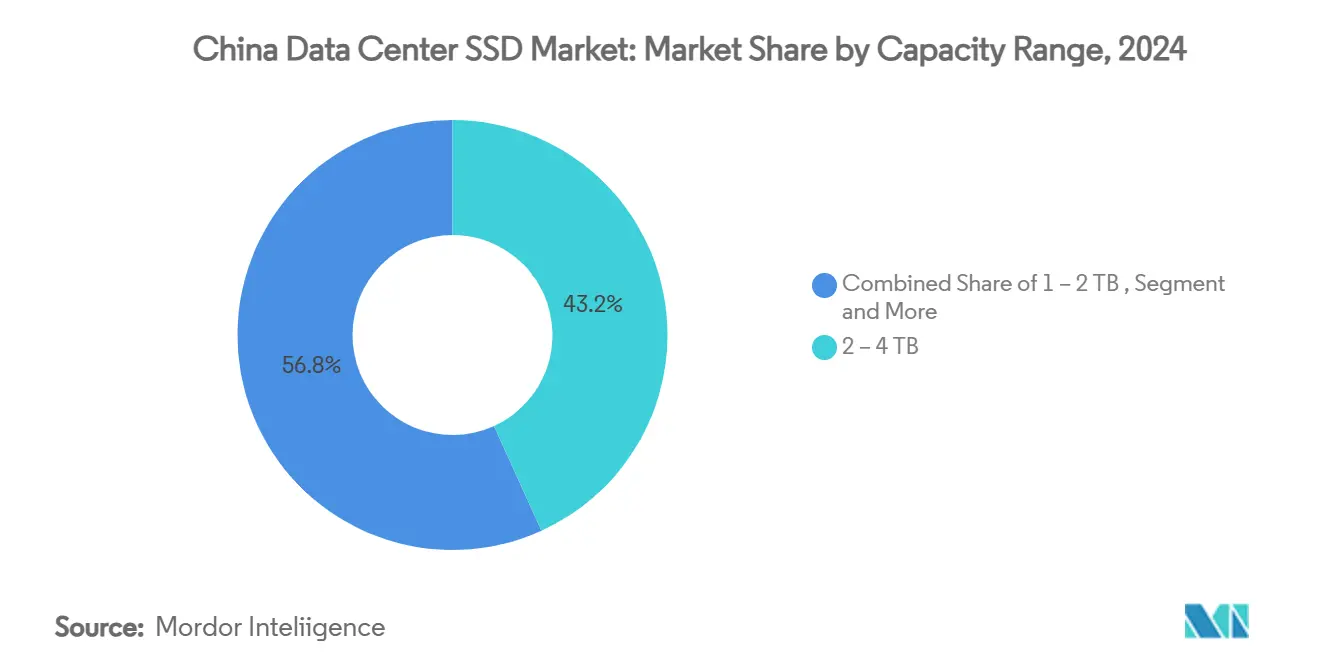
- By capacity range, 2-4 TB drives accounted for 43.2% of the China data center SSD market size in 2024; drives ≥4 TB are set to expand at a 26.81% CAGR.
- By drive architecture, read-intensive 1 DWPD products captured 60% share in 2024 and are projected to grow at 27.20% CAGR.
Proportional positioning is established by comparing country level and regional contributions against the global total, including that of China. The data center ssd market share in our global report expresses these relative weights.
China Data Center SSD Market Trends and Insights
Drivers Impact Analysis*
| DRIVER | (~) % IMPACT ON CAGR FORECAST | GEOGRAPHIC RELEVANCE | IMPACT TIMELINE |
|---|---|---|---|
| AI and HPC workloads accelerating NVMe adoption | +8.2% | Beijing, Shanghai, Shenzhen | Short term (≤ 2 years) |
| “East Data, West Compute” policy stimulating inter-regional build-outs | +6.1% | Western hubs—Gansu, Xinjiang, Inner Mongolia | Medium term (2-4 years) |
| Subsidized domestic NAND supply driving price parity with HDD | +4.8% | National; YMTC clusters in Wuhan and Nanjing | Medium term (2-4 years) |
| Carbon-neutral mandates favoring energy-efficient SSDs | +3.7% | National, strict enforcement in Tier-1 cities | Long term (≥ 4 years) |
| Cloud-vendor migration from hybrid to all-flash architectures | +2.9% | Led by Alibaba, Tencent, Huawei Cloud | Short term (≤ 2 years) |
| U.S. export controls catalyzing localization of controller ICs | +2.4% | R&D centers in Shenzhen and Beijing | Long term (≥ 4 years) |
| Source: Mordor Intelligence | |||
AI and HPC workloads accelerating NVMe adoption
China’s data-center architects are shifting decisively toward NVMe because AI model training now demands more than 45 exabytes of raw flash capacity procured in 2024. ByteDance earmarked USD 614 million for a Shanxi AI facility and USD 7 billion for GPU cloud services, underscoring the sheer storage footprint needed to feed transformer models.[1]ByteDance Ltd., “ByteDance to Build Shanxi AI Data Center,” bytedance.com Tencent’s Xingmai upgrade raised AI-training throughput by 20%, showing how faster storage translates directly into compute utilization gains. Gen 5.0 SSDs such as UNIS S5 already deliver 14.9 GB/s reads, and Memblaze PBlaze7 hits 14 GB/s for inference-centric workloads, ensuring that I/O keeps pace with PCIe GPU interconnects. Even experimental architectures—like the underwater data center processing 7,000 AI queries per second—rely on NVMe to mitigate latency from harsh environments. As a result, NVMe remains the default interface for next-generation compute clusters.
East Data, West Compute policy stimulating inter-regional all-flash build-outs
Eight national computing hubs and 10 designated clusters must together install 1.46 million racks, creating a wave of greenfield facilities in western China. The Yajiang-1 site in Tibet uses cold mountain air for natural cooling while still packing 2,000 PFLOPS—a design that mandates dense, low-latency flash over spinning media. Huawei’s computing-first network architecture further reduces inter-cluster latency, but only when storage arrays can read large datasets without mechanical seek delays. Government land grants in Gansu have already attracted 300 enterprises to 17,000 mu of industrial parks, translating into long-term demand for high-capacity, read-optimized SSDs.[2]Gansu Provincial Government, “Data Center Industrial Park Project Overview,” gansu.gov.cn Consequently, all-flash builds have become the de-facto standard for every new rack west of the Heihe-Tengchong line.
Subsidized domestic NAND supply driving price parity vs HDD
State backing for YMTC’s Xtacking 4.0 process delivered a 512-Gb TLC die at 160 active layers—moving domestic SSDs within striking distance of HDD price points. DapuStor’s TCO model shows QLC drives cut total ownership costs 41% over five years while using 30% less power, offering a compelling alternative even for cold-storage tiers. Because subsidies absorb tooling depreciation, local fabs can undercut international pricing and still invest in 200-plus-layer RandD. The resulting price-performance curve is unlocking broad SSD adoption in workloads that once defaulted to 15K-RPM disks.
Carbon-neutral mandates favoring energy-efficient SSD infrastructure
National standards now cap Power Usage Effectiveness at 1.3 by 2025, making energy-dense SSD arrays effectively mandatory for any new build in major metros. The East-West Computing Transmission Project alone could avert 2,125 Mt CO₂ through 2050 if data centers move to flash and renewables. Alibaba Cloud already runs 56% of its capacity on clean energy while holding PUE at 1.200, proving that performance and sustainability can coexist. Municipal rules in Shanghai deny permits to facilities above the 1.3 threshold, pushing operators toward flash-first designs with reduced cooling loads. This regulatory scaffolding transforms environmental compliance into a direct demand driver for SSD suppliers.
Restraints Impact Analysis*
| RESTRAINTS | (~) % IMPACT ON CAGR FORECAST | GEOGRAPHIC RELEVANCE | IMPACT TIMELINE |
|---|---|---|---|
| NAND-controller supply bottlenecks under export curbs | −4.3% | Shenzhen and Beijing fabs needing advanced ICs | Short term (≤ 2 years) |
| Aggressive price erosion squeezing vendor margins | −3.1% | National, acute for tier-2 manufacturers | Medium term (2-4 years) |
| Fragmented domestic standards limiting interoperability | −2.8% | National with province-level variations | Long term (≥ 4 years) |
| Volatile NAND flash pricing inflating procurement budgets | −2.6% | National, reflecting 10–15% wafer price spikes | Short term (≤ 2 years) |
| Source: Mordor Intelligence | |||
NAND-controller supply bottlenecks under tech-export restrictions
The BIS interim rules of December 2024 extended Foreign Direct Product controls to cutting-edge controller IP blocks, constraining imports of 12 nm and below logic. Phison forecasts that substrate shortages will escalate through late-2025, with spot NAND wafer prices already 10–15% higher after Q2 production cuts.[3]Phison Electronics Corp., “2025 Q2 Investor Presentation,” phison.com Domestic fabs are racing to substitute toolchains, but near-term hiccups ripple through integrators, raising BOM costs and lengthening qualification cycles for new drives. Until local controller ecosystems mature, supply tension will act as a drag on market volume.
Aggressive price erosion compressing vendor margins
Contract prices for enterprise SSDs have climbed 80% across three quarters, yet margins remain thin as local brands pursue share in a buyer’s market. YMTC overtook Samsung in Singles’ Day SSD sales by cutting ASPs, demonstrating how price competition can dominate product differentiation.Meanwhile, Solidigm exited consumer SSDs to preserve profitability, indicating that sustained under-pricing eventually forces portfolio rationalization. For smaller assemblers without scale or captive NAND, the race to the bottom jeopardizes RandD spending and long-term viability, tempering investment appetite across the supply chain.
*Our forecasts treat driver/restraint impacts as directional, not additive. The impact forecasts reflect baseline growth, mix effects, and variable interactions.
Segment Analysis
By Form Factor: EDSFF Drives Next-Generation Density
The China data center SSD market retains a 51.2% share for 2.5-inch U.2 drives, mainly because existing blade servers and storage arrays still anchor refresh cycles. Yet EDSFF E1.L shipments are compounding at 26.21% CAGR as hyperscalers standardize on sled-friendly footprints that facilitate hot-plug replacements in dense racks. ATP’s rugged N651Si E1.S attests to the segment’s thermal and vibration resilience, reading and writing at more than 6,000 MB/s across –40 °C to 85 °C operating envelopes. The migration path will therefore track new build-outs more than retrofits, but once server designs pivot, EDSFF becomes the form-factor of record.
In the second half of the decade, proprietary variants such as E2.L for petabyte-class siblings are expected to carve niche use cases in warm-tier repositories. 2.5-inch drives will still move in volume for edge gateways and tier-2 clouds, where component interchangeability outranks raw density. Consequently, integrators will support parallel supply lines: one catering to legacy U.2 hosts, another delivering EDSFF-optimized enclosures for AI mega-clusters.


By Interface: PCIe Gen5 Accelerates Performance Leadership
PCIe/NVMe Gen4 remains the workhorse, commanding 75.3% revenue thanks to broad host-platform support. The baton, however, is passing to PCIe Gen5, whose 24.50% CAGR is fueled by Chinese controller breakthroughs such as UNIS S5’s 14.9 GB/s reads. Memblaze’s PBlaze7 already doubles Gen 4 sequential bandwidth and is certified in GPU nodes across Alibaba and Tencent clouds, locking in a virtuous cycle of silicon adoption. Silicon Motion expects consumer-grade Gen 6 drives by 2030, but enterprise PCIe 6.0 prototypes like SM8466 have reached 28 GB/s and will likely debut first in AI training pods where cost tolerance is higher.
SATA and SAS linger in cost-sensitive or mission-critical legacy arrays, but growth has plateaued. Meanwhile, the NVMe 2.0 spec’s Flexible Data Placement extension will let cloud operators allocate physical NAND regions dynamically—further cementing NVMe as the only scalable protocol for heterogeneous AI datasets.
By NAND Technology: QLC Gains Enterprise Acceptance
Despite TLC’s 78.1% grip on 2024 revenue, QLC is the momentum story with 24.70% CAGR, aided by YMTC’s endurance leap that narrows the durability gap. DapuStor’s benchmarks show QLC SSDs can undercut HDD TCO by 41% across five-year depreciation cycles, a value argument strong enough to sway cold-data pools. TLC will still dominate for read-intensive AI inference clusters requiring consistent latency. SLC and MLC, although relegated to corner cases, will persist in write-heavy database logs and industrial controls, respectively.
By 2027, 1,000-layer road maps foresee 20 TB QLC devices at HDD-equivalent pricing, essentially removing the last barrier to flash ubiquity. Expect a bifurcated market: TLC satisfying performance tiers, QLC capturing capacity layers, both protected by domestic wafer supply that increasingly limits foreign vendor leverage.
By Drive Architecture: Read-Intensive Dominates AI Workloads
Read-intensive 1 DWPD products enjoy 60% share and the fastest 27.20% CAGR because inference out-scales training in deployed AI services. Starblaze’s STAR2000 controller, embedding a neural-network processor, exemplifies the optimization path: dedicate compute near data to minimize host latency. Mixed-use 3 DWPD drives will remain the default for transactional databases mixing OLTP with analytics, whereas write-intensive 10 DWPD SKUs shrink to niche training rigs or log-structured systems demanding heavy writes.
Over time, firmware-defined endurance may allow a single SKU to toggle between profiles, giving operators agility to re-deploy any drive across tiers as workload patterns evolve. Until then, capacity planners will over-provision read-intensive SKUs, accepting endurance trade-offs in exchange for higher density and lower power envelopes.
By Capacity Range: High-Capacity Drives Lead Growth
Mainstream 2-4 TB models still account for 43.2% of the China data center SSD market size, but drives ≥4 TB will sprint ahead at a 26.81% CAGR through 2030. Micron’s 60 TB ION E3.S achieves 67% more rack density while sipping only 20 W, showcasing the economics of scaling capacity instead of racks. KIOXIA’s 122.88 TB LC9 pushes the envelope further for AI-grade datasets.
Edge gateways and IoT backhauls will still buy ≤1 TB and 1-2 TB variants where form factor and price sensitivity matter. Yet as large language models evolve from billions to trillions of parameters, server designers are hard-coding bays for nothing smaller than 8 TB. Capacity sweet spots will therefore drift upward each refresh cycle, and drives under 2 TB will likely be soldered onto embedded boards rather than shipped as field-replaceable units.
By End-User: Hyperscale Providers Drive Market Transformation
Hyperscale cloud providers dominate the end-user landscape with 72% market share in 2024 while maintaining the fastest growth trajectory at 27.61% CAGR through 2030, driven by massive AI infrastructure investments and data center expansion programs. Alibaba Cloud exemplifies this segment's evolution, achieving 56% clean energy usage across its data centers while maintaining industry-leading Power Usage Effectiveness of 1.200. Tencent Cloud's Xingmai network upgrade demonstrates the segment's technical sophistication, improving AI training efficiency by 20% while supporting over 100,000 GPUs in single computing clusters. Colocation and carrier-neutral facilities serve as strategic intermediaries, providing infrastructure services to enterprises lacking dedicated data center capabilities. Enterprise and financial-services data centers maintain specialized requirements for compliance and security, driving demand for high-endurance SSDs with advanced encryption capabilities.
Geography Analysis
Eastern megacities—Beijing, Shanghai, and Shenzhen—accounted for roughly 65% of 2024 SSD spending because that is where hyperscale cloud regions, fintech hubs, and digital-content providers cluster. These locales demand ultra-low latency, so operators pay premiums for PCIe Gen5 and read-intensive TLC drives that guarantee sub-100 µs response windows. They also face the strictest energy-use caps, making flash indispensable for regulatory compliance.
Western provinces are the growth engine with a 28.5% CAGR through 2030, spring-boarded by low-cost renewable power and generous land grants. Gansu’s 17,000 mu data-center park illustrates the policy playbook: invite 300 enterprises, leverage surplus wind-solar capacity, and ship processing results back east over fiber backbones. Storage architects here choose high-capacity QLC to maximize watt-per-terabyte efficiency because latency tolerance is higher for batch-style analytics.
Northern regions—from Inner Mongolia to Heilongjiang—leverage ambient cooling to meet PUE limits without exotic HVAC. Facilities deploy hybrid racks mixing TLC and QLC, balancing energy savings against responsiveness for content-delivery workloads aimed at Korea and Japan. Southern provinces such as Guangdong and Fujian maintain strategic relevance thanks to port access and semiconductor fabs; local OEMs co-locate assembly lines to cut lead times, reinforcing regional demand for controller ICs. Central China functions as a relay node; its data hubs buffer traffic and require flexible caching SSDs rather than sheer capacity. Collectively, these patterns paint a diverse map where each area optimizes flash choices around energy, latency, or manufacturing advantage—yet every path converges on solid-state media as the de-facto backbone for national compute ambitions.
Mordor Intelligence examines the data center ssd market across diverse other regional markets as well, including Latin America, Middle East, and Africa, while also offering granular country-level perspectives for United States and more.
Competitive Landscape
The field is moderately fragmented but tilting toward domestic champions. YMTC, Western Digital, Samsung, and Solidigm still top volume charts, yet Chinese brands such as DapuStor, Memblaze, and Longsys are closing gaps by offering tuned firmware for AI inference clusters. YMTC’s Singles’ Day triumph over Samsung signaled a perception shift: quality parity plus patriotic procurement is a winning combination for e-commerce buyers. Cloud alliances intensify that trend; Kingsoft Cloud’s tie-up with Solidigm delivered KS3 Extreme Speed object storage boasting 1 Tbps per petabyte sustained throughput, raising the bar for platform-grade SSD validation.
Technology continues to separate leaders from followers. Starblaze integrates neural accelerators inside controllers, designing silicon expressly for tensor-heavy read patterns. Phison and Maxio supply turnkey platforms that let smaller brands leapfrog into Gen 5.0 class without massive RandD budgets. Still, cut-throat pricing is trimming profitability. Samsung uses vertical integration to weather ASP swings, whereas Western Digital leans on captive BiCS FLASH yields to keep cost curves in check. Fragmentation remains above global levels, but consolidation is visible as tier-2 makers struggle to scale controller design and firmware support—a pre-condition for enterprise qualification in China’s top five cloud providers.
China Data Center SSD Industry Leaders
Samsung Electronics
Kioxia
Western Digital
Solidigm (SK hynix)
Huawei
- *Disclaimer: Major Players sorted in no particular order

Recent Industry Developments
- July 2025: Phison Electronics posted record Q2 revenue on surging controller shipments, signaling tight supply relief for Chinese SSD vendors.
- June 2025: Silicon Motion unveiled the SM8466 PCIe 6.0 controller targeting 28 GB/s sequential transfers for 2026 AI platforms.
- May 2025: KIOXIA introduced CM9 Series PCIe 5.0 SSDs using 8th-gen BiCS TLC, gaining up to 95% sequential-write uplift over prior versions.
- March 2025: KIOXIA launched the 122.88 TB LC9 Series NVMe drive with dual-port redundancy for AI data lakes.


China Data Center SSD Market Report Scope
| 2.5-inch (U.2/U.3) |
| M.2 |
| PCIe Add-in Card |
| EDSFF (E1.S / E1.L / E3) |
| SATA | |
| SAS | |
| PCIe | PCIe/NVMe Gen3 |
| PCIe/NVMe Gen4 | |
| PCIe/NVMe Gen5 | |
| PCIe/NVMe Gen6 |
| SLC |
| MLC |
| TLC |
| QLC |
| Read-Intensive (1 DWPD) |
| Mixed-Use (3 DWPD) |
| Write-Intensive (10 DWPD) |
| ≤1 TB |
| 1 – 2 TB |
| 2 – 4 TB |
| ≥4 TB |
| Hyperscale Cloud Providers |
| Colocation / Carrier-Neutral Facilities |
| Enterprise and Financial-Services Data Centers |
| By Form Factor | 2.5-inch (U.2/U.3) | |
| M.2 | ||
| PCIe Add-in Card | ||
| EDSFF (E1.S / E1.L / E3) | ||
| By Interface | SATA | |
| SAS | ||
| PCIe | PCIe/NVMe Gen3 | |
| PCIe/NVMe Gen4 | ||
| PCIe/NVMe Gen5 | ||
| PCIe/NVMe Gen6 | ||
| By NAND Technology | SLC | |
| MLC | ||
| TLC | ||
| QLC | ||
| By Drive Architecture | Read-Intensive (1 DWPD) | |
| Mixed-Use (3 DWPD) | ||
| Write-Intensive (10 DWPD) | ||
| By Capacity Range | ≤1 TB | |
| 1 – 2 TB | ||
| 2 – 4 TB | ||
| ≥4 TB | ||
| By End-User | Hyperscale Cloud Providers | |
| Colocation / Carrier-Neutral Facilities | ||
| Enterprise and Financial-Services Data Centers | ||


Key Questions Answered in the Report
What is the current size of the China data center SSD market?
The market is valued at USD 3.05 billion in 2025 and is set to reach USD 11.09 billion by 2031, growing at a 25.91% CAGR.
Which end-user category leads demand?
Hyperscale cloud providers command 72% share and are also the fastest-growing at a 27.61% CAGR through 2030.
Why are PCIe Gen5 SSDs gaining traction now?
AI training clusters require more than 14 GB/s sequential read bandwidth, a level delivered cost-effectively only by PCIe Gen5 drives.
How do QLC SSDs compare with HDDs on cost?
Five-year analyses show QLC SSDs can cut total cost of ownership by 41% while consuming 30% less power.
What regional policy is shaping infrastructure build-outs?
The “East Data, West Compute” strategy is pushing all-flash data centers into western provinces where land and renewable power are abundant.
How will export controls affect supply?
Near-term controller shortages could shave roughly 4.3 percentage points off CAGR until domestic fabs ramp substitute ICs.
Page last updated on:


