
United States Multi-Tenant (Colocation) Data Center Market Size and Share
Market Overview
| Study Period | 2020 - 2031 |
|---|---|
| Forecast Data Period | 2026 - 2031 |
| Historical Data Period | 2020 - 2024 |
| Market Size (2026) | USD 13.85 Billion |
| Market Size (2031) | USD 23.09 Billion |
| Growth Rate (2026 - 2031) | 10.76 % |
| Market Concentration | Medium |
Major Players *Disclaimer: Major Players sorted in no particular order Image © Mordor Intelligence. Reuse requires attribution under CC BY 4.0. | |
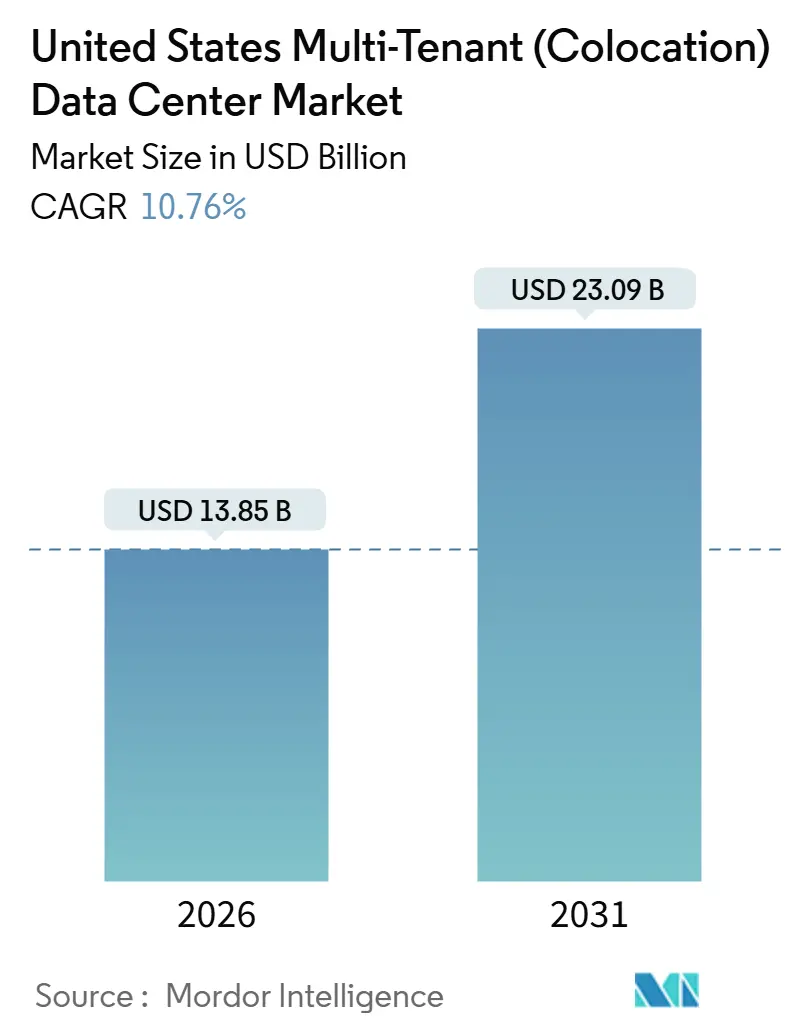
United States Multi-Tenant (Colocation) Data Center Market Analysis by Mordor Intelligence
The United States multi-tenant (colocation) data center market size is estimated at USD 13.85 billion in 2026, and is expected to reach USD 23.09 billion by 2031, at a CAGR of 10.76% during the forecast period 2026-2031. Current expansion is rooted in three converging forces: hyperscaler migration to wholesale colocation in Tier-2 metros, accelerated artificial intelligence training that demands liquid-cooled racks, and enterprise adoption of hybrid-cloud strategies that elevate interconnection revenue. A generous federal tax-credit regime, introduced under the Inflation Reduction Act, lowers the levelized cost of capacity and encourages groundbreakings in Dallas, Atlanta, and Chicago. Power purchase agreements tied to low-cost solar and wind generation now underwrite 15-year hedge contracts, improving cost visibility for operators while satisfying sustainability clauses embedded in 78% of Fortune 500 supplier questionnaires. Competitive intensity remains moderate because the five largest operators hold 48% of installed capacity, yet fragmentation persists beneath that tier as edge-focused specialists pursue latency-sensitive workloads from autonomous vehicles and real-time analytics.
Key Report Takeaways
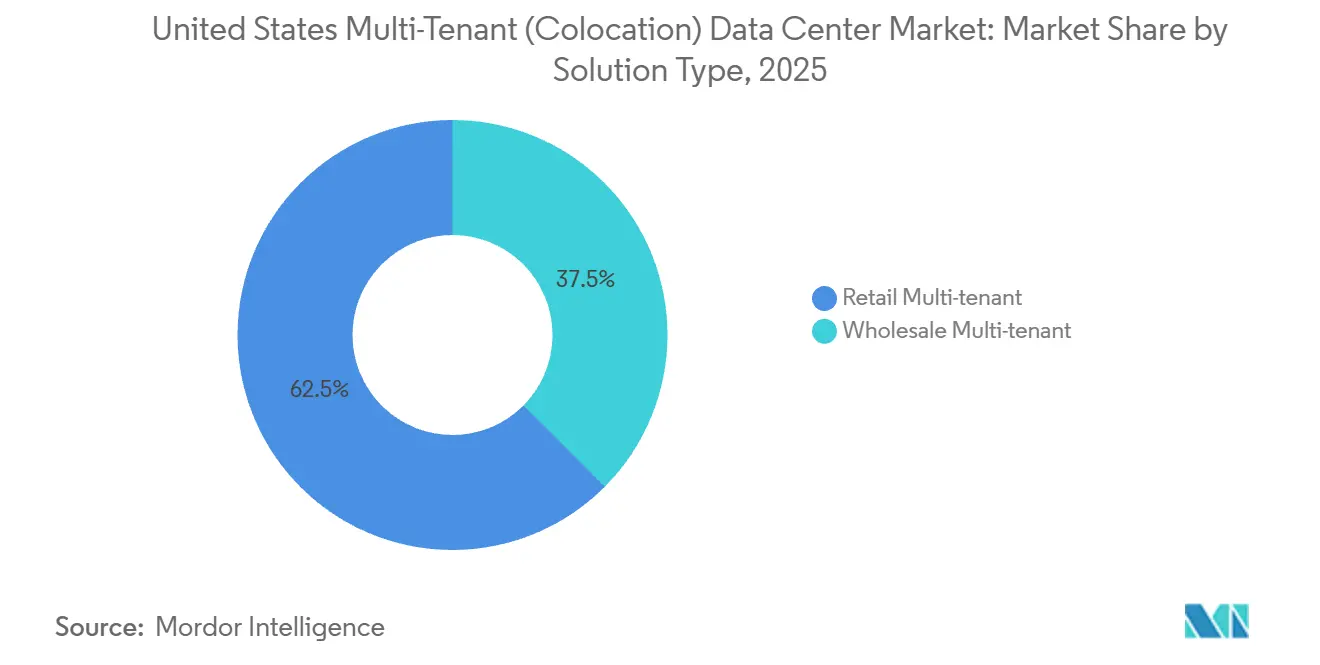
- By solution type, retail colocation led with 62.53% revenue share in 2025, while wholesale colocation is forecast to expand at an 11.32% CAGR through 2031.
- By tier classification, Tier 3 held 47.43% of the United States multi-tenant (colocation) data center market share in 2025, whereas Tier 4 deployments are projected to register an 11.66% CAGR through 2031.
- By facility size, large data centers captured 49.21% of the United States multi-tenant (colocation) data center market in 2025, but hyperscale campuses are advancing at an 11.75% CAGR through 2031.
Note: Market size and forecast figures in this report are generated using Mordor Intelligence’s proprietary estimation framework, updated with the latest available data and insights as of January 2026.
United States Multi-Tenant (Colocation) Data Center Market Trends and Insights
Drivers Impact Analysis*
| Driver | (~) % Impact on CAGR Forecast | Geographic Relevance | Impact Timeline |
|---|---|---|---|
| Rapid Proliferation of AI and ML Workloads | +2.8% | National, Northern Virginia, Silicon Valley, Dallas | Short term (≤ 2 years) |
| Accelerating Adoption of Hybrid Cloud and Edge Computing | +2.3% | National, Atlanta, Chicago, Phoenix | Medium term (2-4 years) |
| Hyperscaler Preference for Build-to-Suit Wholesale Colocation | +1.9% | Dallas, Atlanta, Chicago, Denver | Medium term (2-4 years) |
| Growing Availability of Renewable Energy Purchase Agreements | +1.5% | Texas, Southwest, Pacific Northwest | Long term (≥ 4 years) |
| Surging Demand for Interconnection Hubs | +1.3% | Ashburn, Los Angeles, Chicago, New York | Short term (≤ 2 years) |
| Federal and State Tax Incentives | +1.0% | National, Virginia, Texas, Ohio, Georgia | Medium term (2-4 years) |
| Source: Mordor Intelligence | |||
Rapid Proliferation of AI and ML Workloads Requiring High-Density Colocation
Nvidia H100 clusters that underpin large-language-model training routinely exceed 100 kW per cabinet, a density that only 18% of US colocation halls could support in December 2025.[1]Uptime Institute, “Data Center Tier Standards and Certifications,” uptimeinstitute.com Hyperscalers therefore reserve wholesale suites of 5-10 MW to secure liquid-cooling readiness before the next GPU allocation cycle. CyrusOne disclosed that AI customers represented 42% of all bookings during the first three quarters of 2025. Operators that invest in rear-door heat exchangers report 30-40% pricing premiums relative to legacy deployments, compressing payback periods to under four years. National Fire Protection Association is revising NFPA 75 to clarify lithium-ion battery suppression protocols for such high-density clusters.
Accelerating Adoption of Hybrid Cloud and Edge Computing Architectures
Flexential recorded a jump from 51% to 63% of enterprise customers running hybrid deployments between 2024 and 2025. Enterprises distribute workloads across on-premises racks, public-cloud regions, and colocation cages to satisfy latency and data-sovereignty mandates. EdgeConneX expanded to 42 edge locations by focusing on Omaha, Boise, and Raleigh, cities overlooked by national platforms. Analysts expect 800-1,000 MW of new edge colocation demand by 2028. Regulatory strictures such as HIPAA continue to favor hybrid cloud alliances with carrier-neutral operators.
Hyperscaler Preference for Build-to-Suit Wholesale Colocation in Tier-2 US Metros
Digital Realty’s xScale platform added 120 MW in Dallas and Atlanta during 2025, all pre-leased to cloud platforms that seek faster energization timelines than Northern Virginia can offer. Ohio extends a 75% sales-tax exemption on data-center equipment, and Georgia offers investment-tax credits up to 5% for qualifying builds.[2]State of Ohio Department of Development, “Data Center Tax Incentives,” development.ohio.gov Wholesale tenants value 18- to 24-month utility interconnection versus 36- to 48-month waits in primary hubs. Operators in Tier-1 metros now differentiate by cultivating dense peering fabrics that edge-only facilities cannot match.
Growing Availability of Renewable Energy Purchase Agreements in US Power Markets
Equinix reached 96% renewable coverage of its US footprint by December 2025. Solar PPAs in Texas clear below USD 30 per MWh, a price that undercuts fossil-fuel alternatives. Switch operates its Nevada campus on 100% renewable supply and markets carbon-free hosting at premium rates. The Inflation Reduction Act should deliver an incremental 15-20 GW of renewable capacity by 2028, deepening PPA liquidity.[3]U.S. Energy Information Administration, “Renewable Energy Market Data,” eia.gov
Restraints Impact Analysis*
| Restraint | (~) % Impact on CAGR Forecast | Geographic Relevance | Impact Timeline |
|---|---|---|---|
| Escalating Power Grid Constraints | -1.8% | Northern Virginia, Phoenix, Silicon Valley, Dallas | Short term (≤ 2 years) |
| Rising Land Acquisition and Construction Costs | -1.2% | Ashburn, Chandler, Santa Clara | Medium term (2-4 years) |
| Intensifying Sustainability Reporting Requirements | -0.6% | National | Long term (≥ 4 years) |
| Competition from Hyperscaler Self-Builds | -0.9% | Northern Virginia, Oregon, Iowa, South Carolina | Medium term (2-4 years) |
| Source: Mordor Intelligence | |||
Escalating Power Grid Constraints and Utility Lead Times
Pending interconnection requests in Northern Virginia exceed 4.2 GW, representing nearly three years of backlog. Dominion Energy froze new large-load hookups in portions of Loudoun County during 2025, compelling builders to self-fund substations or postpone energization. Arizona Public Service faces a similar strain in Phoenix, where data-center applications surpassed 1.8 GW in 2025. The Federal Energy Regulatory Commission may prioritize projects with firm site control and completed environmental reviews to clear queues faster. Operators have begun colocating adjacent to generation assets or installing on-site natural-gas peakers at an added USD 50-80 million per 50-MW hall.
Rising Land Acquisition and Construction Costs in Core Hubs
Land in Ashburn appreciated 28% between January 2024 and December 2025 as developers compete for utility-adjacent parcels. Construction outlays for hyperscale halls climbed to USD 12-15 million per MW in 2025, up from USD 9-11 million in 2023, driven by steel inflation and switchgear shortages. Builders respond by adopting modular electrical rooms that cut on-site labor 30-40% and compress schedules by up to six months. Smaller developers without balance-sheet resilience are exiting through asset sales to REITs and infrastructure funds.[4]CBRE, “Data Center Development Trends,” cbre.com
*Our forecasts treat driver/restraint impacts as directional, not additive. The impact forecasts reflect baseline growth, mix effects, and variable interactions.
Segment Analysis
By Solution Type: Wholesale Momentum Builds on Hyperscaler Reservations
Retail colocation held 62.53% share of the United States multi-tenant (colocation) data center market in 2025, reflecting the appeal of turnkey rack-level leasing to small and midsized enterprises that avoid capital expenditure. Operators bundle power, cooling, and physical security so customers can scale workloads a single rack at a time. Wholesale leases of 5 MW or more are growing faster, at an 11.32% CAGR, as hyperscalers reserve contiguous capacity to bypass uncertainty in utility queues. The wholesale segment benefits from AI and hybrid-cloud workloads that demand bespoke electrical topologies, liquid-cooling loops, and dedicated meet-me rooms.
CyrusOne’s Massively Modular builds allowed tenants to specify up to 30 kW per rack in 2025, capturing wholesale demand at premium rates. Digital Realty pre-leased 85% of its 240-MW 2025 pipeline before first power, signaling that supply still trails demand. Retail colocation will remain resilient because enterprises value geographic diversity and disaster-recovery options across multiple metros, yet wholesale’s faster expansion ensures it will capture the majority of incremental megawatts commissioned during the forecast window. As a result, the United States multi-tenant (colocation) data center market will see a gradual rebalancing toward wholesale without eroding the entrenched retail installed base.


By Tier Type: Tier 4 Certifications Gain Traction Under Insurance Scrutiny
Tier 3 sites commanded 47.43% of United States multi-tenant (colocation) data center market share in 2025 because concurrent maintainability satisfies most service-level agreements at an attractive cost point. Tier 4 halls, however, are growing at an 11.66% CAGR, powered by insurance carriers that now require fault-tolerant designs before underwriting cyber-risk policies above USD 50 million.
Uptime Institute logged a 14% rise in domestic Tier 4 certifications during 2025, with financial services absorbing 38% of new certificates and healthcare 22%. Capital overhead of Tier 4 construction has narrowed from 40% in 2023 to 25-30% in 2025 due to economies of scale in dual-fed switchgear and redundant chillers. Blockchain and real-time payments need zero downtime, further shifting demand to Tier 4. Conversely, Tier 1 and Tier 2 facilities continue to lose relevance as enterprises consolidate into higher-tier campuses to simplify compliance with frameworks such as FedRAMP and PCI-DSS. The United States multi-tenant (colocation) data center market size tied to Tier 4 will therefore accelerate, though Tier 3 will remain the dominant installed base through 2031 because its performance-to-cost ratio still aligns with mainstream enterprise workloads.
By Data Center Size: Hyperscale Campuses Lead Next-Generation Workloads
Large halls between 10 MW and 50 MW accounted for 49.21% of the United States multi-tenant (colocation) data center market share in 2025, a legacy of enterprise consolidation. Hyperscale campuses above 50 MW now post an 11.75% CAGR as generative AI and public-cloud capacity additions co-locate GPU clusters that demand contiguous power blocks.
Operators retrofitting legacy halls for liquid cooling often sacrifice rentable square footage, while purpose-built hyperscale shells integrate cold-plate or rear-door heat-exchanger loops from day one. Switch, for example, deploys direct-to-chip cooling across its Nevada and Michigan campuses, enabling 120 kW racks without breaching 1.2 PUE. Edge-oriented small facilities under 5 MW continue to thrive in secondary metros where 10-20 ms latency is mission-critical for autonomous vehicle telemetry. DataBank’s 65-site edge network illustrates how small-to-medium halls can capture regional analytics and content caching. Nevertheless, the United States multi-tenant (colocation) data center market size devoted to hyperscale will expand the fastest as the top 10 cloud and AI providers consolidate procurement, compelling operators to pour capital into mega-campuses that can scale beyond 200 MW.


Geography Analysis
Northern Virginia remains the single largest hub, hosting more than 2 GW of installed capacity; however, interconnection moratoria and escalating land prices restrain short-term supply. Silicon Valley encounters similar constraints because available transmission capacity has flatlined, while Phoenix faces rising transmission queue times that now exceed 30 months. These limitations redirect capital to Tier-2 metros where power availability and tax incentives are more favorable, thereby reshaping the geographic spread of new builds.
Dallas leads the Tier-2 surge, recording 280 MW of net absorption in 2025 thanks to deregulated power markets and abundant solar resources that support competitively priced PPAs. Atlanta follows closely; Georgia Power maintains reserve-margin headroom, and the state offers investment tax credits that reduce upfront capital outlays. Chicago benefits from a unique combination of low-carbon nuclear baseload and five transcontinental fiber corridors, making it a strategic site for latency-sensitive trading and media workloads. Denver and Salt Lake City are also capturing overflow demand, with developers citing 18- to 24-month interconnection timelines compared with 36-plus months in Northern Virginia.
Emerging metros such as Columbus, Kansas City, and Reno attract edge deployments that require sub-20 ms latency to reach Midwest and Mountain-West consumers. Operators choose these cities to hedge against power price volatility while securing water rights unavailable in coastal hubs. Exurban parcels remain plentiful, yet builders must invest in new fiber backhaul and water infrastructure, which can extend project schedules by up to 9 months. Over the forecast period, geographic diversification will temper land and power inflation in legacy hubs while sustaining aggregate growth across the broader United States multi-tenant (colocation) data center market.
Regulatory Landscape
The regulatory environment for US multi-tenant (colocation) data centers is tightening around grid-reliability, national-security screening, and cybersecurity controls that affect facility design and tenant qualification. In July 2026, the Federal Energy Regulatory Commission (FERC) directed the North American Electric Reliability Corporation (NERC) to develop mandatory reliability standards for computational loads, including AI data centers, with a filing deadline of December 31, 2026. This increases pressure on operators to formalize load forecasting, curtailment readiness, and utility coordination in constrained markets.
Cybersecurity and operational compliance requirements continue to converge on NIST guidance and federal energy-efficiency programs. NIST published SP 800-234 in May 2026 to tailor security controls for AI and high-performance computing environments, and finalized SP 800-18r2 in June 2026, expanding expectations for cybersecurity and supply-chain risk management that commonly flow through customer due diligence for carrier-neutral colocation sites. On the state side, legislation is getting more targeted: Florida SB 484 took effect July 1, restricting public-utility service to certain 50 MW-plus large-load facilities tied to foreign entities of concern, reinforcing the need for state-by-state compliance and ownership transparency alongside site selection and utility contracting.
Competitive Landscape
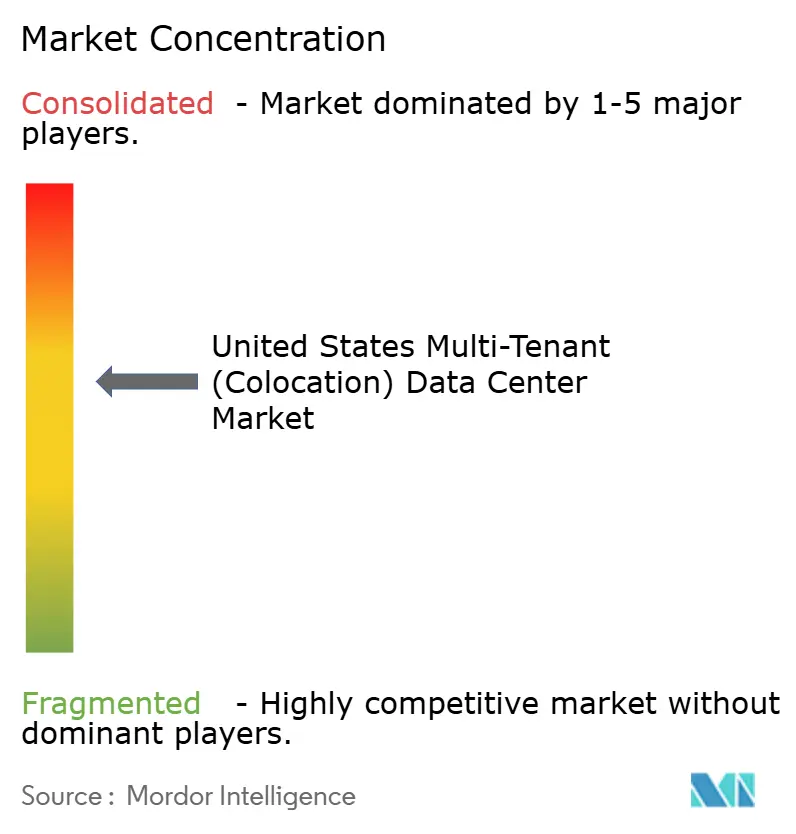
Market concentration is moderate, with Equinix, Digital Realty, CyrusOne, CoreSite, and Switch together holding 48% of installed capacity. Equinix monetizes dense interconnection fabrics, where cross-connect and on-ramp services deliver gross margins above 65% and represent 20% of group revenue. Digital Realty relies on PlatformDIGITAL to simplify hybrid-cloud orchestration, which deepens customer lock-in and reduces churn across 34 domestic campuses.
CyrusOne differentiates through Massively Modular builds that compress construction schedules by prefabricating electrical and mechanical rooms, enabling 20% quicker deliveries than stick-built halls. CoreSite focuses on software-defined interconnection via its Open Cloud Exchange, shrinking provisioning from weeks to minutes and capturing growing network-automation demand. Switch leverages 100% renewable supply and liquid-cooled designs to win AI-heavy tenants that prioritize carbon-neutral capacity paired with 120 kW rack densities.
Below the top tier, STACK Infrastructure, Compass Datacenters, EdgeConneX, and DataBank target Tier-2 and edge metros with build-to-suit or distributed footprints designed for latency-critical workloads. Schneider Electric’s EcoStruxure AI platform helps many operators cut unplanned downtime by 35% and reduce energy waste by up to 12%, making technology partnerships a competitive necessity. Patent filings for immersion-cooling modules and modular DC-in-a-box solutions rose 22% in 2025, signaling a race to meet next-generation density benchmarks while controlling total cost of ownership.
United States Multi-Tenant (Colocation) Data Center Industry Leaders
Digital Reality Trust, Inc.
Equinix, Inc.
CyrusOne LLC
Quality Technology Services (QTS Realty Trust)
CoreSite Realty Corporation (American Tower)
- *Disclaimer: Major Players sorted in no particular order

Market Opportunities and Future Outlook
Near-term whitespace is concentrated where power can be secured faster than in constrained Tier-1 hubs and where designs are already aligned to AI density and liquid-cooling requirements. Q1 2026 market indicators point to capacity tightness and stronger landlord leverage, with US colocation inventory at 29.0 GW and vacancy at 1.2% (including very low vacancy in Austin and Northern Virginia). This supports higher value for deliverable power, pre-qualified sites, and interconnection-rich campuses for both retail expansion and wholesale build-to-suit awards.
The opportunity set is also shaped by power-centric development models and large-scale AI campus activity, especially in Texas and the broader Sunbelt, where deregulated markets and PPA availability improve cost visibility over long project horizons. In 2026, Google began construction activity on two Texas data center projects (Vernon in March, and the Meitner Energy Center site in June), while Crusoe announced plans for a 1 GW AI data center campus in Childress, Texas, and Meta announced an expansion of its Hyperion campus in Richland Parish, Louisiana, to 5 GW tied to a large investment program. For colocation operators, these moves reinforce a pathway to capture demand through powered-land strategies, energy-supplier partnerships, and high-density-ready halls that can be delivered around GPU allocation cycles. They also add pull for carrier-neutral interconnection, hybrid-cloud on-ramps, and compliance-ready environments for regulated enterprise workloads.
Recent Industry Developments
- June 2026: Digital Realty agreed to purchase Blackstone's interest in three Northern Virginia data centers, totaling 288 MW of IT capacity, at a gross value of USD 7.8 billion. The transaction deepens Digital Realty's control of scarce, hyperscale-grade capacity in the largest US hub, where utility constraints and low vacancy elevate the premium for powered sites and deliverable expansion paths.
- February 2026: CyrusOne signed an agreement with Constellation and Calpine to support a new data center facility at the Freestone Energy Center in Texas, structured around 380 MW with an exclusive agreement for a second 380 MW phase. The deal underscores how energy-center anchored development and long-horizon power contracting are being used to de-risk time-to-power for multi-hundred-megawatt campuses serving AI and cloud tenants.
- December 2025: Equinix acquired three carrier-neutral sites in Chicago for USD 420 million, adding 18 MW of capacity to its Midwest interconnection footprint. The purchase strengthens Equinix's ability to monetize cross-connect density and cloud on-ramps in a market positioned for latency-sensitive enterprise, trading, and content workloads.


Research Methodology Framework and Report Scope
Market Definition and Coverage
This market covers revenues earned from multi-tenant colocation facilities in the United States, where customers lease space, power, cooling, and connectivity within shared data center buildings. The sizing reflects colocation services across retail and wholesale arrangements, expressed in USD.
Scope exclusions: We exclude single-tenant captive enterprise data centers and hyperscaler self-built facilities that are not operated as multi-tenant colocation sites.
Segmentation Overview
- By Solution Type
- Wholesale Multi-tenant
- Retail Multi-tenant
- By Tier Type
- Tier 1 and 2
- Tier 3
- Tier 4
- By Data Center Size
- Small Data Center
- Medium Data Center
- Large Data Center
- Hyperscale Data Center
Data Sources, Market Sizing, and Validation
Desk Research
Desk research started with public infrastructure and digital economy signals that anchor demand for racks, power draw, and interconnection needs. We referenced sources such as U.S. Energy Information Administration electricity price series, U.S. Census Bureau construction and economic indicators, Federal Communications Commission broadband and telecom reporting, and U.S. International Trade Commission trade data for relevant equipment flows.
To keep scope realistic for multi-tenant colocation, we also reviewed operator public filings and investor materials, utility and grid operator publications on load growth, and reputable press coverage on large lease announcements and campus expansions. Where helpful, paid subscriptions were used for company financials and intelligence, import and export shipment visibility, and patent databases to sanity-check cooling and power technology directions. These sources are illustrative rather than exhaustive, and we used other public references to collect, validate, and clarify the inputs.
Primary Interviews and Surveys
Primary work focused on validating how pricing and utilization move in practice across retail and wholesale colocation, and how customers decide between Tier levels and facility sizes. We spoke with operators, channel partners, and enterprise buyers, then pressure-tested assumptions on power density, contracted capacity take-up, and renewal behavior across the United States before finalizing the model.
Distribution of primary research fieldwork respondents
| Company type | Respondent position |
|---|---|
| Top tier: 39% | CXOs: 13% |
| Mid tier: 46% | Functional/Unit leaders: 40% |
| Smaller Players: 15% | Managers: 47% |
Market-Sizing & Forecasting
Sizing was built using a top-down approach where data center capacity signals are translated into a colocation demand pool, and then filtered into retail versus wholesale multi-tenant revenues for the United States. The model follows a clear chain of logic from space and power needs to monetization, and we corroborate totals with selective bottom-up checks such as sampled price-per-kW and price-per-cabinet benchmarks, utilization ranges, and rollups from a set of visible operators.
Key inputs that were used to shape the estimates included available IT load and commissioned power additions, typical rack power density trends, contracted capacity versus occupied capacity behavior, blended pricing progression by retail and wholesale contracts, and the mix shift across Tier 3 versus Tier 1 and 2 sites. Where a metric was not consistently available across the whole country, gaps were handled by using metro-level analogs and then scaling with demand indicators (cloud on-ramps, network-heavy workloads, and enterprise migration cadence), which were later validated through interviews.
For forecasting, scenario analysis was applied so the outlook stays grounded when power availability, construction timelines, and customer pre-leasing vary by year. The scenarios were tied to inputs that respondents could comment on directly, such as delivery pipeline confidence, likely pricing resets at renewals, and the pace of higher-density deployments that raise revenue per deployed kW.
Data Validation & Update Cycle
Validation was done through multi-step checks that compare the modeled output with independent signals, and then isolate swings that do not match observed capacity additions or pricing direction. When an anomaly showed up, we revisited the assumption, re-checked the desk inputs, and in some cases re-contacted interviewees to confirm whether it was a local effect or a broader shift.
Before sign-off, the work is reviewed by another analyst to ensure the math steps are consistent and the scope rules are applied the same way across years. The report is refreshed annually, and interim updates are triggered when material events occur, such as large campus announcements, sharp power price moves, or policy changes affecting build economics. Right before delivery, a final refresh pass is completed so clients receive the most current view available.
Mordor Intelligence's United States Colocation Data Center Market Size Compared Against Other Published Estimates
Published market values for US colocation often vary because the included facility types and revenue lines are not always treated the same, and the timing of pricing assumptions also differs. Differences are usually amplified when one estimate leans more on capacity news flow, while another leans more on service revenue reporting.
The main gap comes from whether single-tenant or hyperscaler self-built capacity is folded into the total. Mordor Intelligence counts only multi-tenant colocation revenues and keeps retail and wholesale tied to contracted and occupied capacity with year-specific pricing checks.
Benchmark comparison
| Source | Market Size | Gaps in Research Methodology |
|---|---|---|
| Mordor Intelligence | USD 13.85 B (2026) | |
| Industry Data Book A | USD 46.84 B (2026) | This figure appears to cover a broader US colocation universe that can include larger single-tenant or non-multi-tenant revenue pools, which inflates the total versus a strict multi-tenant-only definition. |
| Trade Journal B | USD 26.69 B (2025) | The estimate likely uses an expanded scope and a different base year, and it may apply faster pricing and capacity ramp assumptions without consistently separating retail and wholesale multi-tenant revenues. |
The spread in the table is explained mostly by scope and by how power capacity is converted into billable revenue. When the model is anchored to multi-tenant contracted demand, with pricing and utilization checked year by year, the resulting market size stays easier to reconcile with observable operating signals.


Key Questions Answered in the Report
How large is the US multi-tenant data center market in 2026?
The market stands at USD 13.85 billion and is projected to expand to USD 23.09 billion by 2031.
What is driving wholesale colocation growth?
Hyperscalers reserve multi-megawatt blocks to secure liquid-cooled halls and bypass utility queue delays, producing an 11.32% CAGR for wholesale space.
Why are Tier 4 facilities gaining share?
Cyber-insurance carriers and regulators now demand fault-tolerant designs, pushing Tier 4 deployments to an 11.66% CAGR through 2031.
Which metros attract new hyperscale builds?
Dallas, Atlanta, Chicago, and Denver draw investment because they combine faster utility interconnections with generous state tax incentives.
How are operators meeting sustainability mandates?
They lock in long-term renewable PPAs, deploy on-site solar and battery storage, and use AI-driven energy-management systems to cut waste by up to 12%.
What is the main constraint on new supply?
Power-grid congestion in primary hubs such as Northern Virginia and Phoenix extends substation lead times, delaying energization of additional capacity.
Page last updated on:
- Data Center Server Market Servers worldwide, split by tier, facility size and facility type.
- Artificial Intelligence (AI) Data Center Market AI facilities across the global market, covering facility type, component and tier.
- Data Center Security Market Security across the global market, covering security type, offering and facility type.
- United States Data Center Storage Market Storage demand across the US, covering storage technology, storage type and end user.
- North America Hyperscale Data Center Market Hyperscale sites in North America, split by facility type, component and tier.
- Europe Artificial Intelligence (AI) Data Center Market Europe AI facilities, split by facility type, component and tier.
- Israel Hyperscale Data Center Market Hyperscale sites demand across Israel, covering facility type, service type and end user.


 Your data is secure and never sold or shared.


