Market Overview
| Study Period | 2018 - 2031 |
|---|---|
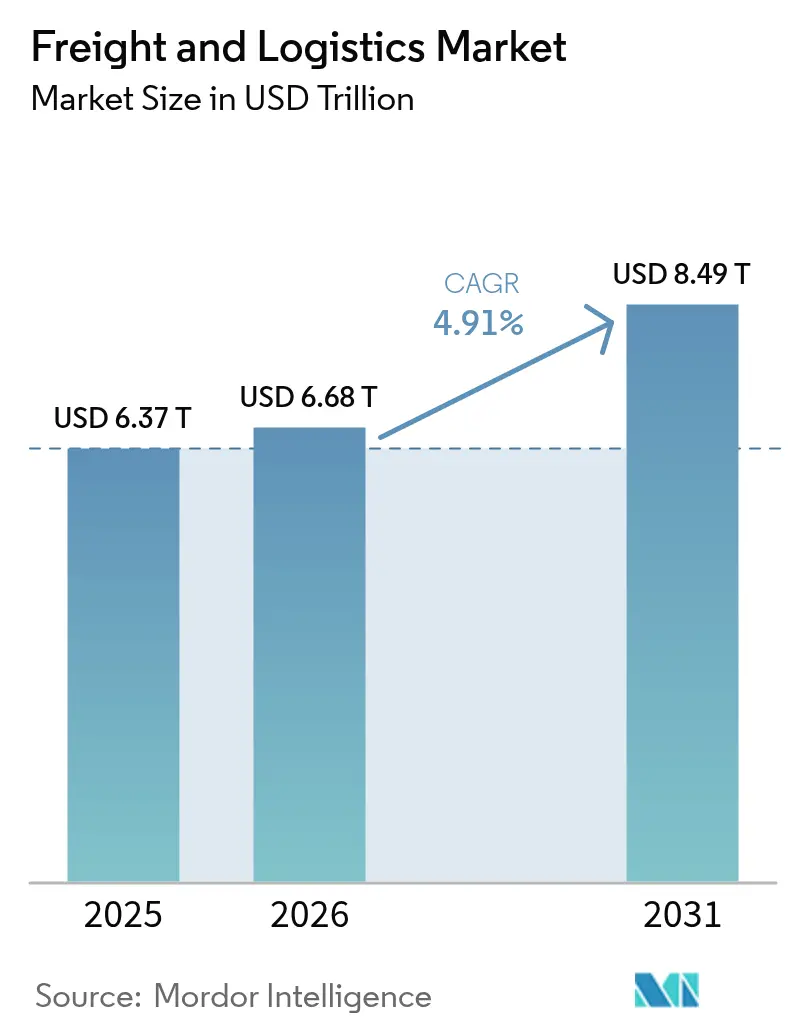
| Market Size (2026) | USD 6.68 Trillion |
| Market Size (2031) | USD 8.49 Trillion |
| Growth Rate (2026 - 2031) | 4.91% CAGR |
| Fastest Growing Market | Asia Pacific |
| Largest Market | Asia Pacific |
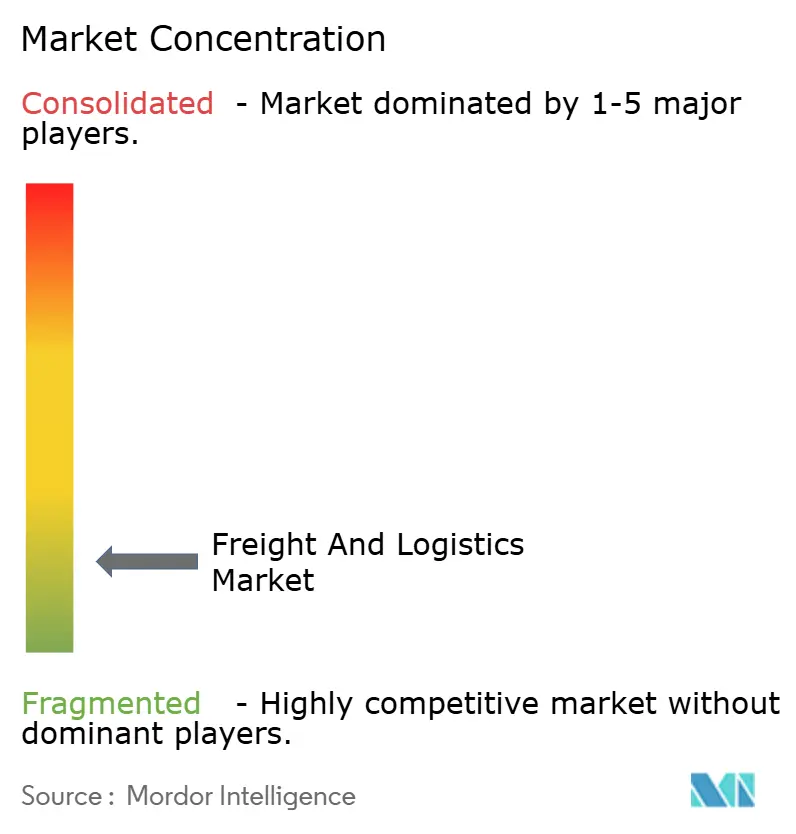
| Market Concentration | Low |
Major Players
*Disclaimer: Major Players sorted in no particular order Image © Mordor Intelligence. Reuse requires attribution under CC BY 4.0. |
|
Freight And Logistics Market Analysis by Mordor Intelligence
The Freight And Logistics Market size is expected to grow from USD 6.37 trillion in 2025 to USD 6.68 trillion in 2026 and is forecast to reach USD 8.49 trillion by 2031 at 4.91% CAGR over 2026-2031.
Robust e-commerce activity, infrastructure modernization, rising demand for cross-border courier, express, and parcel (CEP) services, and accelerating public-private partnerships keep the freight and logistics market on a steady growth path. Freight transport remains the backbone of global trade, yet segment diversification toward forwarding, warehousing, and last-mile fulfillment is increasing as shippers seek integrated solutions. Strong regional momentum in Asia-Pacific, regulatory pushes for Scope-3 emissions reporting, and technology investments in automation, visibility, and predictive optimization continue to reshape competitive strategies and cost structures. Consolidation, exemplified by DSV’s purchase of DB Schenker, underscores the sector’s focus on scale, network density, and technology leverage to offset capacity bottlenecks and driver shortages.
Key Report Takeaways
- By logistics function, freight transport held 61.45% of the freight and logistics market share in 2025; freight forwarding is projected to grow at a 5.18% CAGR between 2026-2031.
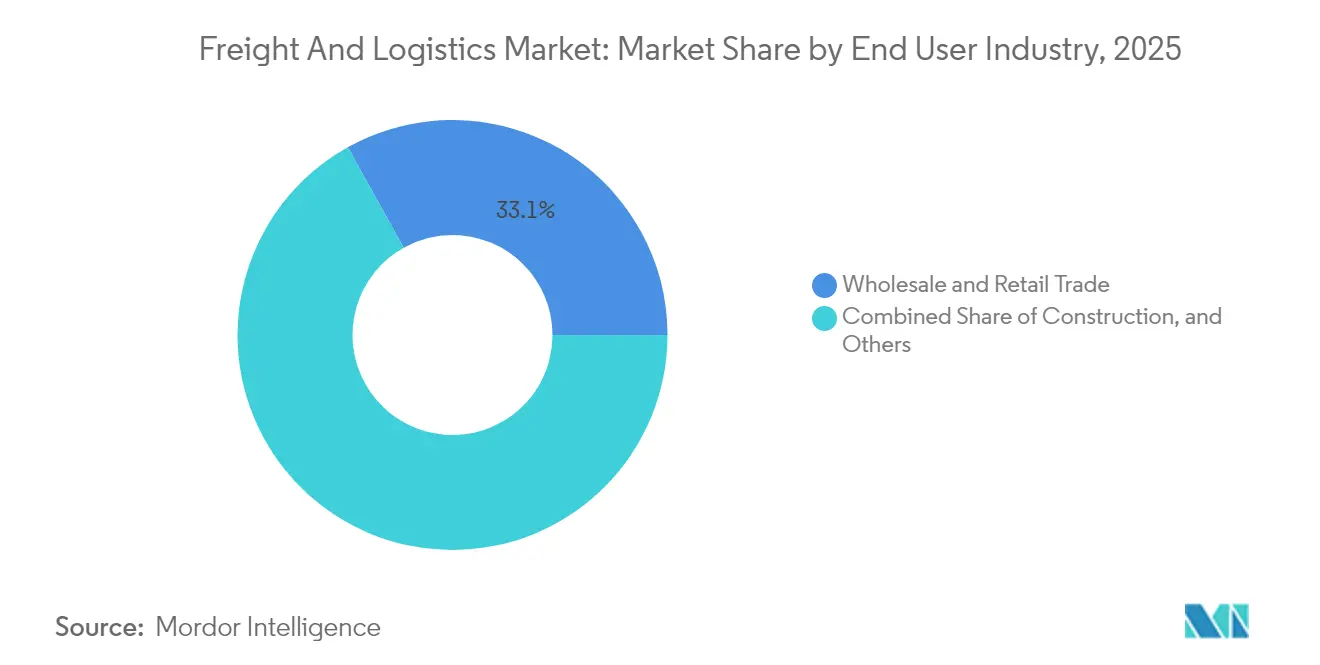
- By end user industry, wholesale and retail trade commanded 33.10% of the freight and logistics market size in 2025; manufacturing shows the highest 5.17% CAGR between 2026-2031.
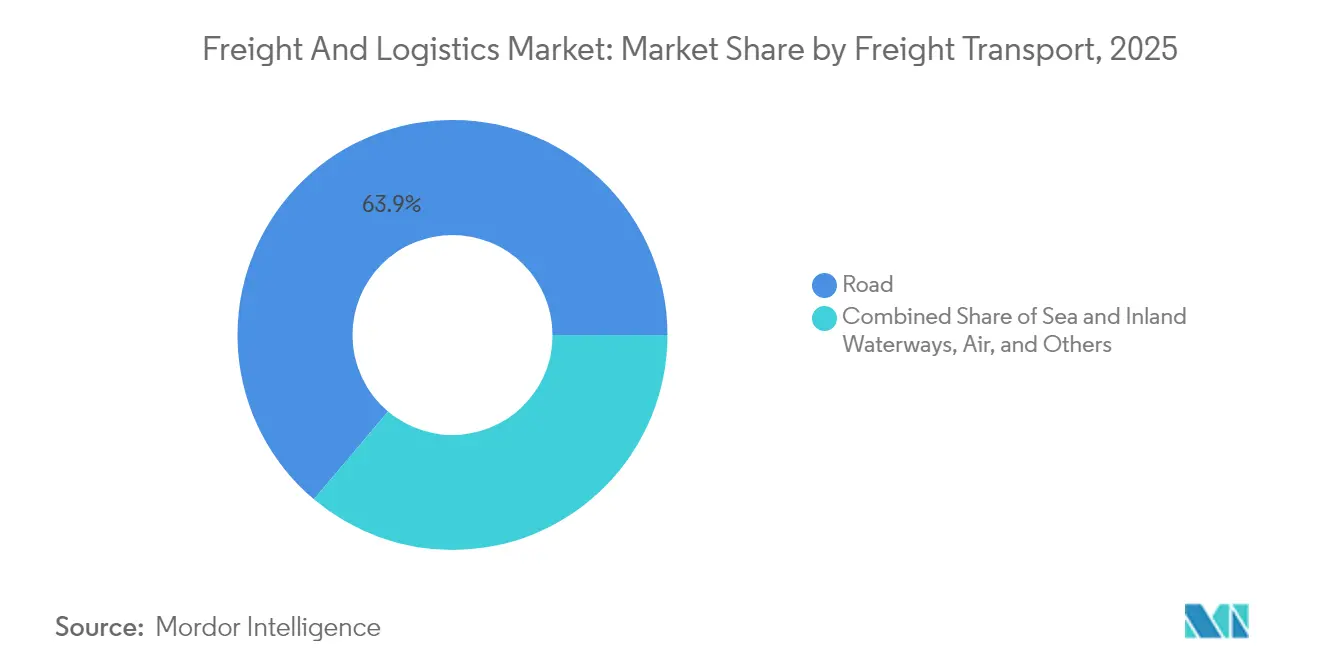
- By freight transport mode, road freight captured 63.85% of the revenue share in 2025; sea and inland waterways are advancing at a 5.37% CAGR between 2026-2031.
- By courier, express, and parcel type, domestic services accounted for 68.55% of the revenue share in 2025; international CEP leads growth at a 5.46% CAGR between 2026-2031.
- By freight forwarding transport, sea and inland waterways retained 61.98% of the revenue share in 2025; air freight forwarding records the fastest 4.84% CAGR between 2026-2031.
- By warehousing and storage type, non-temperature controlled facilities dominated with 91.10% of the revenue share in 2025; temperature-controlled warehousing is scaling at a 5.24% CAGR between 2026-2031.
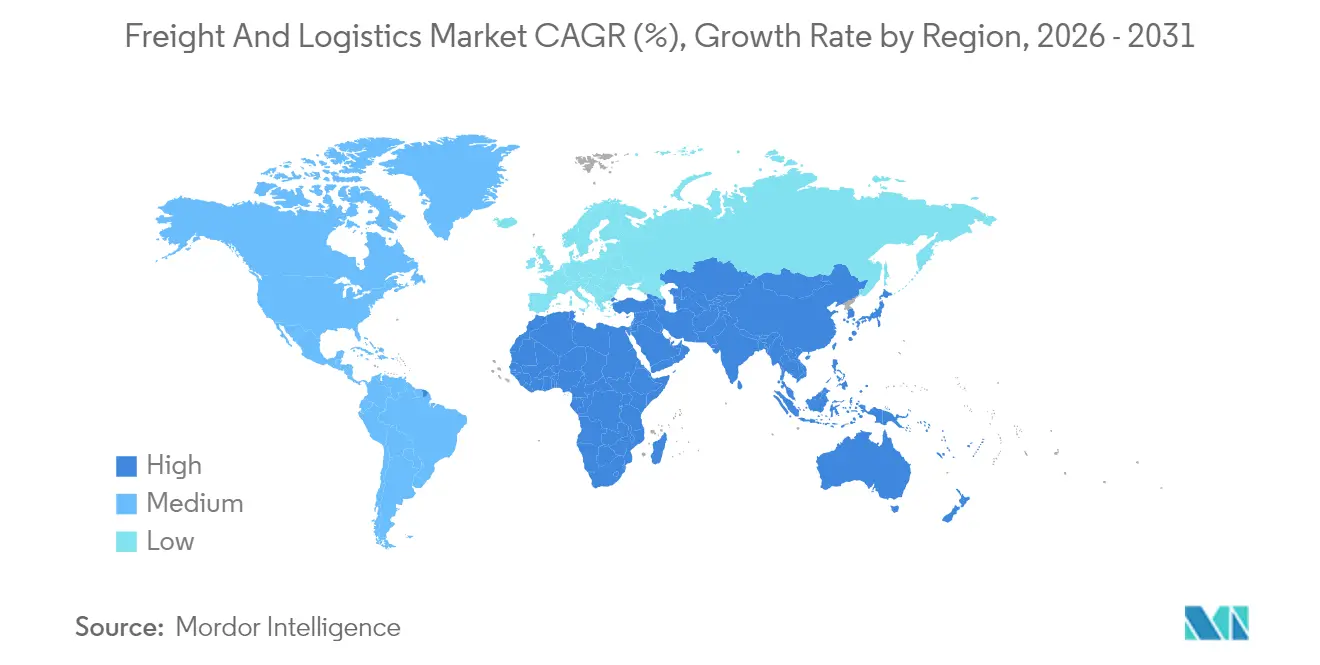
- By geography, Asia-Pacific secured 41.20% of the freight and logistics market share in 2025 and also posts the fastest 6.15% CAGR between 2026-2031.
Note: Market size and forecast figures in this report are generated using Mordor Intelligence’s proprietary estimation framework, updated with the latest available data and insights as of 2026.
Global Freight And Logistics Market Trends and Insights
Drivers Impact Analysis*
| Driver | (~) % Impact on CAGR Forecast | Geographic Relevance | Impact Timeline |
|---|---|---|---|
| E-commerce penetration in emerging markets | +1.2% | Asia-Pacific, Latin America | Medium term (2-4 years) |
| On-demand same-day delivery expectations | +0.8% | North America, Europe, developed Asia-Pacific | Short term (≤ 2 years) |
| Infrastructure upgrades and PPP logistics corridors | +1.1% | Asia-Pacific, Middle East and Africa, North America | Long term (≥ 4 years) |
| Reshoring and near-shoring of manufacturing | +0.9% | North America, Europe, Mexico, Eastern Europe | Medium term (2-4 years) |
| Mandatory Scope-3 emissions disclosure | +0.6% | Global (early EU, North America adoption) | Medium term (2-4 years) |
| Defense-sector stockpiling | +0.4% | North America, Europe, select Asia-Pacific | Short term (≤ 2 years) |
| Source: Mordor Intelligence | |||
E-Commerce Penetration in Emerging Markets
Rising smartphone use and digital payment adoption in Asia-Pacific and Latin America amplify demand for rapid order fulfillment, forcing logistics providers to build micro-fulfillment facilities near high-density urban clusters. This structural shift boosts international CEP volumes, which command premium margins and require robust customs-clearing capabilities, harmonized product classification, and data-driven shipment visibility. Providers invest in automated sortation, artificial-intelligence-guided route planning, and omnichannel inventory orchestration to meet elevated consumer delivery promises. Regionally fragmented regulatory frameworks add complexity, prompting collaborative initiatives among customs authorities to streamline cross-border e-commerce compliance. As these efforts mature, cross-border parcel flows further integrate small and medium-sized sellers into global trade networks, expanding the overall freight and logistics market[1]“2024 State of Logistics – Executive Summary,” Council of Supply Chain Management Professionals, cscmp.org.
On-Demand Same-Day Delivery Expectations
In mature consumer markets, more than one-third of shoppers now prefer same-day delivery on key purchases, prompting retailers to reset fulfillment blueprints. Brick-and-mortar stores increasingly double as hyperlocal distribution nodes, shrinking last-mile distances and reducing per-parcel costs. Automated storage and retrieval systems, collaborative robots, and predictive labor scheduling enhance throughput in urban micro-warehouses. Last-mile specialists leverage crowdsourced couriers, dynamic routing software, and application programming interface (API) integrations that feed real-time order data into fleet management tools, ensuring delivery windows under two hours. High service expectations intensify margin pressure for traditional parcel operators yet create expansion avenues for tech-enabled entrants targeting dense cities across North America, Europe, and advanced Asia-Pacific markets[2]“Driver Shortage Outlook 2025,” United States Department of Transportation, transportation.gov.
Infrastructure Upgrades and PPP Logistics Corridors
Governments and global terminal operators invest heavily to ease port congestion, extend intermodal corridors, and improve hinterland connectivity. The 950 km Saudi Landbridge, multi-billion-dollar port concessions in East Africa, and greenfield rail spurs linking industrial parks shortlist prominent examples. Such projects add capacity, shorten average lead times, and redirect cargo flows away from overstressed chokepoints, particularly those exposed to geopolitical disruptions in the Red Sea or Strait of Malacca. Public-private partnership structures de-risk capital deployment and unlock operating expertise, converting infrastructure into resilient, technology-enhanced assets. Over the long term, corridor upgrades lower transport costs for bulk commodities and containerized goods, widening the addressable freight and logistics market.
Reshoring and Near-Shoring of Manufacturing
Trade tensions, pandemic supply disruptions, and multi-month ocean lead times push manufacturers to redistribute production closer to demand centers. Automakers, electronics assemblers, and industrial equipment firms expand operations in Mexico, Eastern Europe, and Southeast Asia, catalyzing new intra-regional freight lanes. Cross-border truckload, less-than-truckload, and intermodal rail volumes between the United States and Mexico climb steadily, requiring bilingual compliance teams and cross-dock infrastructure at major border crossings. Inland ports emerge as consolidation hubs, enabling balanced round trips and reducing empty miles. Regional production footprints also spur specialized freight forwarding demand for out-of-gauge machinery and time-critical component deliveries, supporting growth momentum within the freight and logistics market.
Restraints Impact Analysis*
| Restraint | (~) % Impact on CAGR Forecast | Geographic Relevance | Impact Timeline |
|---|---|---|---|
| Driver shortage and ageing workforce | -1.1% | North America, Europe, Global | Long term (≥ 4 years) |
| Port congestion and inland bottlenecks | -0.8% | Global gateway hubs | Medium term (2-4 years) |
| Geopolitical sanctions on key trade lanes | -0.6% | Red Sea, Black Sea corridors | Short term (≤ 2 years) |
| High cybersecurity insurance premiums | -0.3% | Developed markets | Medium term (2-4 years) |
| Source: Mordor Intelligence | |||
Driver Shortage and Ageing Workforce
The median professional truck driver age in the United States and Western Europe exceeds 50 years, while pipeline talent lags due to lifestyle concerns and training backlogs. Rising wage bills elevate contract rates, inflate last-mile delivery costs, and limit surge capacity during peak seasons. To mitigate, carriers adopt telematics for optimized dispatching, deploy driver-assist technologies that cut fatigue, and pilot autonomous vehicle platoons on controlled corridors. Warehousing faces similar labor headwinds, encouraging investments in goods-to-person robotics and automated palletizing. Persistent personnel scarcity remains the single most pronounced brake on potential output gains within the freight and logistics market[3]“Global Port Congestion Study 2024,” International Association of Ports and Harbors, worldports.org.
Port Congestion and Inland Bottlenecks
Chronic yard dwell times and chassis shortages at major gateway ports hamper vessel productivity and ripple across inland transport networks. Capacity expansions often trail double-digit container throughput growth, especially in Africa and South Asia, where many terminals operate beyond design limits. Shortfalls in rail siding length, bridge clearances, and road connectivity compound delays, inflating demurrage bills for shippers. Digitization projects, from truck appointment systems to port community platforms, ease coordination friction but require multi-stakeholder alignment. Failure to comprehensively modernize landside infrastructure threatens to erode service reliability and cap upside for the freight and logistics market[4]"African ports struggle to embrace global trade boom." World Finance, worldfinance.com.
*Our forecasts treat driver/restraint impacts as directional, not additive. The impact forecasts reflect baseline growth, mix effects, and variable interactions.
Segment Analysis
By End User Industry: Wholesale Trade Anchors Volume While Manufacturing Leads Growth
Wholesale and retail trade accounted for 33.10% of the freight and logistics market size in 2025, driven by constant replenishment cycles, omnichannel fulfillment, and promotional seasonality. Inventory decentralization strategies require agile middle-mile transfers among regional distribution centers and store replenishment hubs. E-commerce surges magnify parcel density, challenging legacy hub-and-spoke topologies and stimulating investments in sortation automation and carrier diversification.
Manufacturing expands at the fastest 5.17% CAGR (2026-2031) as regionalization bolsters intra-continental raw material and component flows. Original equipment manufacturers mandate just-in-time sequencing, precise line-side deliveries, and real-time visibility to synchronize production across multi-plant footprints. Heavy-lift, project cargo, and temperature-controlled segments benefit from high-value machinery, electronics, and pharmaceutical demand, widening total addressable revenue within the freight and logistics market. Specialized logistics models, including vendor-managed inventory and supplier parks, gain traction, driving deeper integration between manufacturers and third-party logistics providers.


By Logistics Function: Freight Transport Sustains Scale While Forwarding Accelerates
Freight transport generated 61.45% of the freight and logistics market size in 2025, underpinned by vast road, rail, sea, and air networks that physically move global commerce. Its mature footprint yields moderate expansion, projected at 4.19% CAGR between 2026-2031, as macro trade growth offsets efficiency gains. Forwarding, representing a 5.18% CAGR (2026-2031), leverages digital booking platforms, shipment visibility dashboards, and customs-brokerage expertise to orchestrate multimodal routing. Small and medium-sized exporters increasingly outsource compliance and carrier selection to forwarders, driving wallet-share capture within the freight and logistics market.
Providers integrate tariff classification engines, synchronized document workflows, and predictive arrival algorithms to shrink clearance times at borders. As global supply chains fragment across multiple origins, end-to-end orchestration and exception management become core differentiators, enabling forwarders to win contracts from shippers prioritizing agility over pure cost. Consequently, forwarding’s share of the freight and logistics market steadily climbs, even as asset-heavy transport operations continue to dominate absolute revenue pools.
By Courier, Express and Parcel: International Services Capture Premium Yield
Domestic CEP networks processed 68.55% of the segmental revenue share in 2025, reflecting entrenched national post offices and regional integrators. Density increases from e-commerce raise delivery attempt success rates, yet fuel and labor costs limit margin scalability. International CEP, growing at a 5.46% CAGR (2026-2031), benefits from cross-border marketplace sales and direct-to-consumer brand expansions. Shippers seek transparent landed-cost calculators, harmonized duty pre-payment, and end-to-end tracking across multiple customs jurisdictions.
Operators roll out hybrid delivery models pairing postal clearance with private-sector last-mile execution to cut transit times and control handover quality. Autonomous ground vehicles, electric cargo bikes, and drones pilot in congested downtown cores to manage curbside congestion and meet environmental ordinances. Implementation of the Universal Postal Union’s reform on remuneration stimulates bilateral commercial agreements that help realign cost structures with service levels, expanding value capture within the freight and logistics market.
By Warehousing and Storage: Temperature-Controlled Facilities Secure Premium Growth
Non-temperature-controlled warehouses represented 91.10% revenue share in 2025, storing consumer goods, industrial supplies, and fast-moving essentials. Operators deploy warehouse execution systems, autonomous mobile robots, and real-time labor analytics to raise pallet moves per shift. Temperature-controlled warehousing scales at a 5.24% CAGR (2026-2031), propelled by stringent pharmaceutical good distribution practice (GDP) standards, expanding vaccine portfolios, and rising frozen food consumption. Energy-efficient refrigeration plants, phase-change material insulation, and IoT sensor networks maintain strict humidity and temperature thresholds, commanding premium rent multipliers.
Cold chain capacity expansions cluster near biopharmaceutical corridors, seafood processing zones, and urban grocery micro-fulfillment centers, enhancing geographic penetration of temperature-sensitive goods. Vertical cold storage towers augment cubic utilization where urban land prices soar. With global supply chains prioritizing resilience, multi-chamber facilities offering redundant power and rapid docking capabilities become critical, deepening overall engagement within the freight and logistics market.
By Freight Transport Mode: Road Holds Commanding Share Yet Maritime Grows Fastest
Road freight transport commanded 63.85% of freight transport revenue in 2025 due to its door-to-door flexibility and ubiquitous network in both developed and emerging economies. Investments in telematics, electronic logging devices, and alternative fuels sharpen competitiveness and compliance with evolving emissions limits. However, maritime and inland waterway transport posts the highest 5.37% CAGR between 2026-2031, buoyed by carrier alliances, fleet modernizations, and incremental port capacity that lower slot costs per TEU. Expanded Panama and Suez Canal toll incentives for eco-efficient vessels further attract cargo to waterborne routes, growing maritime’s share of the freight and logistics market.
Rail gains momentum from sustainability mandates and congestion mitigation initiatives. North American Class I railroads deploy precision scheduled railroading, advanced positive train control, and inland port partnerships that shorten dray lengths. Airfreight remains a niche at under 2% by volume yet commands premium yields for semiconductor, pharmaceutical, and fashion consignments. Pipeline transport stays specialized for liquid bulk commodities, with network expansions tied to energy transition demand for hydrogen, ammonia, and captured CO₂.
By Freight Forwarding: Sea Remains Dominant While Air Rises with High-Value Cargo
Sea and inland waterway freight forwarding generated 61.98% revenue in 2025, anchored by containerized trade, break-bulk commodities, and project cargo scale economies. Digital freight matching, electronic bills of lading, and predictive container dwell analytics enhance schedule integrity and lower administrative costs. Nevertheless, air forwarding records a 4.84% CAGR (2026-2031), spurred by pharmaceutical cold-chain corridors, high-tech electronics, and fashion sectors that prioritize speed-to-market. Temperature-controlled unit-load devices, active monitoring tags, and dedicated pharma lanes elevate compliance and expand the freight and logistics market size for specialized air forwarding.
Forwarders harness data-sharing protocols with airlines and airports to pre-clear shipments, reduce screening delays, and optimize ULD build-ups. Investment in cybersecurity safeguards sensitive shipper data and meets tightened aviation security frameworks. Consolidation pressures intensify as digital-native entrants build asset-light networks that undercut incumbent pricing; incumbents respond with end-to-end platform acquisitions and API-rich customer portals.
Geography Analysis
Asia-Pacific produced 41.20% of the freight and logistics market size in 2025 and posts the leading 6.15% CAGR between 2026-2031 as trade corridors diversify beyond China to Southeast Asia, India, and Oceania. Massive port expansions at Shanghai, Singapore, and Colombo, high-speed rail cargo lines on the China-Laos route, and digital single-window customs programs shrink transit times and lower compliance costs. Manufacturing shifts toward Vietnam, Indonesia, and the Philippines increase intra-Asian trucking, feeder vessel demand, and cross-border rail traffic.
Europe maintains a strong multimodal proposition, leveraging high-capacity rail freight corridors, short-sea shipping networks, and synchronized customs regimes inside the Schengen area. Sustainability leadership translates into early deployment of hydrogen trucks, electrified last-mile fleets, and modal shift incentives that reshape lane economics. Although geopolitical frictions with Russia complicate eastern overland routes, investments in Baltic and Mediterranean gateway ports foster alternative supply paths, preserving competitiveness within the freight and logistics market.
North America benefits from near-shoring to Mexico and Canada, driving cross-border tractor-trailer volumes and bilateral customs harmonization. The United States’ Infrastructure Investment and Jobs Act accelerates highway rehabilitation, inland port development, and port dredging. Class I railroads expand intermodal terminals to capture e-commerce surge, while Gulf Coast port upgrades attract Asian blue-water services via the expanded Panama Canal. Collectively, these initiatives sustain mid-single-digit growth for the region’s freight and logistics market.

Competitive Landscape
Fragmentation reshapes competitive hierarchies as mega-deals realign market share among the top integrators. DSV’s USD 15.78 billion acquisition of DB Schenker creates a combined network spanning 90 countries, pro forma revenue of USD 43.37 billion, and 147,000 employees, signaling a scale-driven response to capacity volatility and rising technological capex. The merger enhances gateway density in Europe and North America, boosting cross-selling opportunities across forwarding, contract logistics, and project cargo verticals.
Carriers pursue vertical integration to capture margin along the value chain. CMA CGM’s logistics arm supplements container shipping with warehousing, freight forwarding, and air cargo services, while Maersk deepens end-to-end ocean-to-inland solutions through its Gemini Cooperation with Hapag-Lloyd. Asset-heavy integrators embed artificial intelligence into route planning, deploy autonomous yard tractors, and install digital twin platforms in warehouses, augmenting service consistency and reducing unit costs within the freight and logistics market.
Smaller regional players carve niches in specialized transport, cold chain, and cross-border e-commerce fulfillment, leveraging local expertise and agile decision-making. Technology disruptors launch digital brokerage marketplaces, dynamic pricing engines, and predictive maintenance services for fleet owners. Sustainability credentials, including verified emissions dashboards and alternative-fuel fleets, increasingly influence contract awards, intensifying competition on environmental performance alongside traditional service metrics.
Freight And Logistics Industry Leaders
-
DSV A/S (including DB Schenker)
-
DHL Group
-
United Parcel Service of America, Inc. (UPS)
-
Kuehne + Nagel
-
A.P. Moller - Maersk
- *Disclaimer: Major Players sorted in no particular order

Recent Industry Developments
- August 2025: DSV broke ground on a 900,000 square-foot automated distribution center in Laredo, Texas, slated to go live in mid-2026 to support US-Mexico cross-border freight flows.
- April 2025: DSV completed the EUR 14.3 billion (USD 15.78 billion) acquisition of DB Schenker, forming one of the world’s largest integrated logistics groups with combined revenue of EUR 39.3 billion and plans to inject EUR 1 billion into German operations by 2028.
- March 2025: Maersk and Hapag-Lloyd launched the Gemini Cooperation, combining container shipping networks totaling 3.7 million TEU to improve schedule reliability and lower bunker consumption.
- May 2024: CMA CGM finalized its EUR 5 billion (USD 5.51 billion) takeover of Bollore Logistics, strengthening its inland contract logistics, air cargo, and African market presence.


Global Freight And Logistics Market Report Scope
End User Industry
| Agriculture, Fishing, and Forestry |
| Construction |
| Manufacturing |
| Oil and Gas, Mining and Quarrying |
| Wholesale and Retail Trade |
| Others |
Logistics Function
| Courier, Express, and Parcel (CEP) | By Destination Type | Domestic |
| International | ||
| Freight Forwarding | By Mode of Transport | Air |
| Sea and Inland Waterways | ||
| Others | ||
| Freight Transport | By Mode of Transport | Air |
| Pipelines | ||
| Rail | ||
| Road | ||
| Sea and Inland Waterways | ||
| Warehousing and Storage | By Temperature Control | Non-Temperature Controlled |
| Temperature Controlled | ||
| Other Services | ||
Region
| Asia-Pacific | By Country | Australia |
| China | ||
| India | ||
| Indonesia | ||
| Japan | ||
| Malaysia | ||
| Thailand | ||
| Vietnam | ||
| Rest of Asia-Pacific | ||
| Europe | By Country | Denmark |
| Finland | ||
| France | ||
| Germany | ||
| Iceland | ||
| Italy | ||
| Netherlands | ||
| Norway | ||
| Poland | ||
| Romania | ||
| Russia | ||
| Spain | ||
| Sweden | ||
| Turkey | ||
| United Kingdom | ||
| Rest of Europe | ||
| Middle East and Africa | By Country | Egypt |
| Nigeria | ||
| Qatar | ||
| Saudi Arabia | ||
| South Africa | ||
| United Arab Emirates | ||
| Rest of Middle East and Africa | ||
| North America | By Country | Canada |
| Mexico | ||
| United States | ||
| Rest of North America | ||
| South America | By Country | Argentina |
| Brazil | ||
| Chile | ||
| Colombia | ||
| Peru | ||
| Uruguay | ||
| Rest of South America | ||
| Rest of the World |
| End User Industry | Agriculture, Fishing, and Forestry | ||
| Construction | |||
| Manufacturing | |||
| Oil and Gas, Mining and Quarrying | |||
| Wholesale and Retail Trade | |||
| Others | |||
| Logistics Function | Courier, Express, and Parcel (CEP) | By Destination Type | Domestic |
| International | |||
| Freight Forwarding | By Mode of Transport | Air | |
| Sea and Inland Waterways | |||
| Others | |||
| Freight Transport | By Mode of Transport | Air | |
| Pipelines | |||
| Rail | |||
| Road | |||
| Sea and Inland Waterways | |||
| Warehousing and Storage | By Temperature Control | Non-Temperature Controlled | |
| Temperature Controlled | |||
| Other Services | |||
| Region | Asia-Pacific | By Country | Australia |
| China | |||
| India | |||
| Indonesia | |||
| Japan | |||
| Malaysia | |||
| Thailand | |||
| Vietnam | |||
| Rest of Asia-Pacific | |||
| Europe | By Country | Denmark | |
| Finland | |||
| France | |||
| Germany | |||
| Iceland | |||
| Italy | |||
| Netherlands | |||
| Norway | |||
| Poland | |||
| Romania | |||
| Russia | |||
| Spain | |||
| Sweden | |||
| Turkey | |||
| United Kingdom | |||
| Rest of Europe | |||
| Middle East and Africa | By Country | Egypt | |
| Nigeria | |||
| Qatar | |||
| Saudi Arabia | |||
| South Africa | |||
| United Arab Emirates | |||
| Rest of Middle East and Africa | |||
| North America | By Country | Canada | |
| Mexico | |||
| United States | |||
| Rest of North America | |||
| South America | By Country | Argentina | |
| Brazil | |||
| Chile | |||
| Colombia | |||
| Peru | |||
| Uruguay | |||
| Rest of South America | |||
| Rest of the World | |||


Market Definition
- Agriculture, Fishing, and Forestry (AFF) - This end user industry segment captures the external (outsourced) logistics expenditure incurred by the AFF industry players. The end user players considered are the establishments primarily engaged in growing crops, raising animals, harvesting timber, harvesting fish & other animals from their natural habitats and providing related support activities. Herein, Logistics Service Providers (LSPs) play a crucial role in acquisition, storage, handling, transportation, and distribution activities for the optimal & continuous flow of inputs (seeds, pesticides, fertilizers, equipment, and water) from manufacturers or suppliers to the producers and smooth flow of output (produce, agro-goods) to distributors/ consumers. This includes both termperature controlled and non-temperature controlled logistics, as and when required according to the shelf life of goods being transported or stored.
- Construction - This end user industry segment captures the external (outsourced) logistics expenditure incurred by the construction industry players. The end user players considered are the establishments primarily engaged in constructing, repairing and renovating residential & commercial buildings, infrastructure, engineering works, subdividing and developing land. Logistics Service Providers (LSPs) play a crucial role in increasing profitability of construction projects by maintaing the inventory of raw materials & equipment, time-critical supplies and by providing other value added services for effective project management.
- Courier, Express, and Parcel - The Courier, Express, and Parcel services, often called as CEP Market, refers to the logistics and postal service providers which specialize in moving small goods (parcels/packages). It captures the overall market size (USD) and market volume (number of parcels) of (1) the shipments/parcels/packages which are under 70kgs/ 154lbs weight, (2) Business Customer packages viz. Business-to-Business (B2B) & Business-to-Consumer (B2C) as well as private customer packages (C2C), (3) non-express parcel delivery services (Standard and Deferred) as well as express parcel delivery services (Day-Definite-Express and Time-Definite-Express), (4) domestic as well as international parcels.
- Demographics - To analyse total addressable market demand, population growth & forecasts have been studied and presented in this industry trend. It represents population distribution across categories like gender (male/female), development area (urban/rural), major cities among other key parameters like population density and final consumption expenditure (growth and share % of GDP). This data has been used for assessing the fluctations in demand & consumption expenditure, and the major hotspots (cities) of potential demand.
- Export Trends and Import Trends - Overall logistics performance of an economy is positively and significantly (statistically) correlated to its trade performance (exports and imports). Hence, in this industry trend, total value of trade, major commodities/ commodity groups and the major trade partners, for the studied geography (country or region as per the scope of report) have been analysed alongside the impact of major trade/logistics infrastructure investments & regulatory environment.
- Freight Forwarding - Freight forwarding which herein refers to the freight transportation arrangement (FTA) industry includes establishments primarily engaged in arranging & tracking transportation of freight between shippers and carriers. Logistics Service Providers (LSPs) considered are freight forwarders, NVOCCs, custom brokers and marine shipping agents. Others segment under Freight Forwarding captures the revenue earned through value added services of FTA like custom brokerage/clearance activities, preparation of freight related documentation, consolidation-deconsolidation of goods, cargo insurance & compliance, arrangement of warehousing & storage, liasing with shippers, and freight forwarding through other modes of transport viz. road and rail.
- Freight Pricing Trends - Freight pricing by mode of transport (USD/tonkm), over the review period, has been presented in this industry trend. The data has been used in assessing the inflationary environment, impact on trade, freight turnover (tonkm), freight and logistics market demand by mode of transport segments and hence the overall freight and logistics market size.
- Freight Tonnage Trends - Freight tonnage (weight of goods in tons) handled by mode of transport, over the review period, has been presented in this industry trend. The data has been used as one of the parameters apart from average distance per shipment (km), freight volume (tonkm), and freight pricing (USD/tonkm) to assess the freight transport market size.
- Freight Transport - Freight Transport refers to the hiring of a logistics service provider (outsourced logistics) for the transport of commodities (raw materials/final/intermediate/finished goods including both solids and fluids) from the origin to a destination within the country (domestic) or cross-border (international).
- Freight and Logistics - External expenditure on (or outsourced) facilitation of freight transport (freight transportation), arrangement of freight transport through an agent (freight forwarding), warehousing and storage (temperature controlled or non-temperature controlled), CEP (domestic or international courier, express and parcel) and other value-added logistics services involved in the transportation of commodities (raw materials or finished goods including both solids and fluids) from the origin to a destination within the country (domestic) or cross-border (international), through one or more modes of transportation viz. road, rail, sea, air and pipelines constitute freight and logistics market.
- Fuel Price - Fuel price spikes can cause delays and diruption for logistics service providers (LSPs), while drops in the same can result in higher short-term profitability and increased market rivalry to offer consumers with the best deals. Hence, the fuel price variations have been studied over the review period and presented along with the causes as well as market impacts.
- GDP Distribution by Economic Activity - Nominal Gross Domestic Product and distribution of the same, across major economic sectors in the geography studied (country or region as per scope of the report) have been studied and presented in this industry trend. As GDP is positively related to the profitability and growth of logistics industry, this data has been used in adjunction to the input-output tables/ supply-use tables for analyzing the potential major contributing sectors towards the logistics demand.
- GDP Growth by Economic Activity - Growth of Nominal Gross Domestic Product across major economic sectors, for the geography studied (country or region as per scope of the report) have been presented in this industry trend. This data has been utilized for assessing the growth of logistics demand from all the market end users (economic sectors considered here).
- Inflation - Variations in both Wholesale Price Inflation (YoY change in producer price index) and Consumer Price Inflation have been presented in this industry trend. This data has been used to assess the inflationary environment as it plays a vital role in smooth functioning of the supply chain, directly impacting the logistics operational cost components e.g., pricing of tyres, driver wages & benefits, energy/fuel prices, maintenace costs, toll charges, warehousing rents, custom brokerage, forwarding rates, courier rates etc. hence impacting the overall freight and logistics market.
- Infrastructure - As infrastructure plays a vital role in an economy's logistics performance, variables like length of roads, distribution of road length by surface category (paved v/s unpaved), distribution of road length by road classification (expressways v/s highways v/s other roads), rail length, volume of containers handled by major ports and tonnage handled by major airports have been analysed and presented in this industry trend.
- Key Industry Trends - The report section named "Key Industry Trends" include all the key variables/parameters studied to better analyze the market size estimates and forecasts. All the trends have been presented in the form of data points (time series or latest available data points) along with analysis of the paramter in the form of concise market relevant commentary, for the geography studied (country or region as per the scope of report).
- Key Strategic Moves - The action taken by a company to differentiate from its competitor or used as a general strategy is referred to as a key strategic move (KSM). This includes (1) Agreements (2) Expansions (3) Financial Restructuring (4) Mergers and Acquisitions (5) Partnerships, and (6) Product Innovations. Key players (Logistics Service Providers, LSPs) in the market have been shortlisted, their KSM have been studied and presented in this section.
- Liner Shipping Bilateral Connectivity Index - It indicates a country pair's integration level into global liner shipping networks and plays a crucial role in determining bilateral trade, which in turn potentially contributes toward the prosperity of a country and its surrounding region. Hence the major economies connected to the country/ region as per scope of the report, have been analyzed and presented in "Liner Shipping Connectivity" industry trend.
- Liner Shipping Connectivity - This industry trend analyses the state of connectivity to the global shipping networks based on the status of maritime transport sector. It includes the analysis of liner shipping connectivity, bilateral shipping connectivity, and port liner shipping connectivity indices for the geography (country/ region as per scope of the report) over the review period.
- Liner Shipping Connectivity Index - It indicates how well countries are connected to global shipping networks based on the status of their maritime transport sector. It is based on five components of the maritime transport sector: (1) The number of shipping lines servicing a country, (2) The size of the largest vessel used on these services (in TEUs), (3) The number of services connecting a country to the other countries, (4) The total number of vessels deployed in a country, (5) The total capacity of those vessels (in TEUs).
- Logistics Performance - Logistics Performance and Logistics Costs are the backbone of trade, and influences trade costs, making countries compete globally. Logistics performance is influenced by market wide adopted supply chain management strategies, government services, investments & policies, fuel/ energy costs, inflationary environment etc. Hence, in this industry trend, the logistics performance of the geography studied (country/ region as per the scope of report) has been analysed and presented over the review period.
- Major Truck Suppliers - Market share of truck brands is influenced by factors like geographical preferences, portfolio of truck types, truck prices, local production, truck repair & maintenance service peneteration, customer support, technological innovations (like electric vehicles, digitalization, autonomous trucks), fuel efficiency, financing options, annual maintenance costs, availability of substitutes, marketing startegies etc. Hence, the distribution (share % for base year of the study) of truck sales volume for leading truck brands and commentary on current market scenario & market anticipation over the forecast period have been presented in this industry trend.
- Manufacturing - This end user industry segment captures the external (outsourced) logistics expenditure incurred by the Manufacturing industry players. The end user players considered are the establishments primarily engaged in the chemical, mechanical or physical transformation of materials or substances into new products. Logistics Service Providers (LSPs) play a crucial role in maintaining a smooth flow of raw materials across the supply chain, enabling timely delivery of finished goods to distributors or end customers and storing & supplying the raw materials to clients for just-in-time manufacturing.
- Maritime Fleet Load Carrying Capacity - Maritime fleet load carrying capacity depicts the development state of an economy's maritime infrastructure & trade. It is influenced by factors like volume of production, international trade, major end user industries, maritime connectivity, environmental regulations, investments in port infrastructure development, port container cargo handling capacity etc. This industry trend represents the maritime fleet load carrying capacity by type of ship viz. container ships, oil tankers, bulk carriers, general cargo, among other types alongwith the influencing factors for the geography studied (country/ region as per scope of the report), over the review period.
- Modal Share - Freight Modal Share is influenced by factors like modal productivity, government regulations, containerization, distance of shipment, temperature control requirements, type of goods, international trade, terrain, speed of delivery, shipment weight, bulk shipments, etc. Also, modal share by tonnage (tons) and modal share by freight turnover (ton-km) differ as per average distance of shipments, weight of major commodity groups transported in the economy and number of trips. This industry trend represents the distribution of freight transported by mode of transport (tons as well as ton-km), for the study base year.
- Oil and Gas, Mining and Quarrying - This end user industry segment captures the external (outsourced) logistics expenditure incurred by the extraction industry players. The end user players considered are the establishments that extract naturally occurring mineral solids, such as coal and ores; liquid minerals, such as crude petroleum; and gases, such as natural gas. Logistics Service Providers (LSPs) covers entire phases from upstream to downstream and plays a crucial role in the transportation of machinery, drilling equipments, extracted minerals, crude oil & natural gas and refined/ processed products from one place to another.
- Other End Users - Other end user segment captures the external (outsourced) logistics expenditure incurred by the financial services (BFSI), real estate, educational services, healthcare, and professional services (administrative, waste management, legal, architectural, engineering, design, consulting, scientific R&D). Logistics Service Providers (LSPs) plays a crucial role in the reliable movement of supplies and documents to/from these industries such as transporting any equipment or resources required, shipping confidential documents and files, movement of medical goods & supplies (surgical supplies and instruments, including gloves, masks, syringes, equipment) to name a few.
- Other Services - Other Services segment captures revenue earned through (1) Value added services (VAS) for freight transportation by road, rail, air and sea & inland waterways, (2) VAS for marine cargo transportation (operation of terminal facilities such as harbours and piers, operation of waterway locks, navigation, pilotage and berthing activities, lighterage, salvage activities, lighthouse activities, among other miscellaneous support activities), (3) VAS for land freight transportation (operation of terminal facilities such as railway stations, stations for the handling of goods, operation of railroad infrastructure, switching and shunting, towing and road side assistance, liquefaction of gas for transportation purposes, among other miscellaneous support activities), (4) VAS for air cargo transportation (operation of terminal facilities such as airway terminals, airport and air-traffic-control activities, ground service activities on airfields, runway maintenance, inspection/ ferrying/ maintenance/ testing of aircrafts, aircraft fuelling services, among other miscellaneous support activities), (5) VAS for warehousing and storage service (operation of grain silos, general merchandise warehouses, refrigerated warehouses, storage tanks etc., storage of goods in foreign trade zones, blast freezing, crating goods for shipping, packing and preparing goods for shipping, labelling and/or imprinting the package, kit assembling and packaging services, among other miscellaneous support activities), and (6) VAS for courier, express and parcel service (pickup, sorting).
- Port Calls and Performance - The performance of ports is key to an economy's freight movement, trade, global connectivity, successful growth strategies, investment attractiveness for production & distribution systems, and thus affects GDP, employment, per capita income and industrial growth. Hence, the port perfomance parameters like median time spent by vessels in the ports; average age, size, cargo carrying capacity, container carrying capacity, of vessels entering the ports, port calls, and container port throughput have been analysed and presented in this industry trend.
- Port Liner Shipping Connectivity Index - It reflects a port's position in the global liner shipping network, wherein a higher value of index is associated with better connectivity. Efficient and well-connected ports (1) contribute towards minimizing transport costs, linking supply chains and supporting international trade, (2) pave the way for economies of scale and development of expertise by permitting producers to better exploit possibilities in domestic as well as foreign markets. Hence the major ports of strategic importance, in the country/ region as per scope of the report, have been analyzed and presented in "Liner Shipping Connectivity" industry trend.
- Port Throughput - It reflects the amount of cargo or number of vessels a port handles annually. It can be related to (1) cargo tonnage, (2) container TEU, and (3) vessel calls. Port throughput in terms of total containers handled (TEU's), has been presented in the "Port Calls and Performance" industry trend.
- Producer Price Inflation - It indicates inflation from viewpoint of the producers viz. the average selling price received for their output over a period of time. Annual change (YoY) of producer price index is reported as wholesale price inflation in the "Inflation" industry trend. As WPI captures dynamic price movements in most comprehensive way, it is widely used by governments, banks, industry, business circles and is deemed important in formulation of trade, fiscal and other economic policies. The data has been used in adjunction to consumer price inflation for better understanding the inflationary environment.
- Segmental Revenue - Segmental Revenue has been triangulated or computed and presented for all the major players in the market. It refers to the freight and logistics market specific revenue earned by the company, over the base year of study, in the geography studied (country or region as per the scope of report). It is computed through the study and analysis of major parameters like financials, service portfolio, employee strength, fleet size, investments, number of countries present in, major economies of concern, etc. that have been reported by the company in its annual reports, webpage. For companies having scarce financial disclosures, paid databases like D&B Hoovers, Dow Jones Factiva have been resorted to and verified through industry/expert interactions.
- Transport and Storage Sector GDP - Value and growth of Transport and Storage Sector GDP has a direct relation to the freight and logistics market size. Hence, this variable has been studied and presented over the review period, in value terms (USD) and as share % of total GDP, in this industry trend. The data has been supported by concise and relevant commentary around the investments, developments, and current market scenario.
- Trends in E-Commerce Industry - Enhanced internet connectivity and boom in smartphone penetration, coupled with increasing disposable incomes, has led to a phenomenal growth in the e-commerce market globally. Online shoppers require fast and efficient delivery of their orders leading to an increase in the demand for logistics services especially e-commerce fulfilment services. Hence, the Gross Merchandise Value (GMV), historial and projected growth, breakup of major commodity groups in e-commerce industry for the studied geography (country or region as per scope of the report) have been analysed and presented in this industry trend.
- Trends in Manufacturing Industry - Manufacturing industry involves the transformation of raw materials into finished products, while logistics industry ensures the efficient flow of raw materials to the factory, and the transport of manufactured products to the distributors & consumers. Demand-Supply of both industries are highly cross-linked and critical for a seamless supply chain. Hence, the Gross Value Added (GVA), breakup of GVA into major manufacturing sectors, and growth of manufacturing industry over the review period have been analysed and presented, in this industry trend.
- Trucking Fleet Size By Type - Market share of truck types is influenced by factors like geographical preferences, major end user industries, truck prices, local production, truck repair & maintenance service peneteration, customer support, technological disruptions (like electric vehicles, digitalization, autonomous trucks) etc. Hence, the distribution (share % for base year of study) of truck parc volume by type of truck, market disruptors, truck manufacturing investments, truck specifications, truck use & import regulations, and market anticipation over the forecast period have been presented in this industry trend.
- Trucking Operational Costs - The prime reasons for measuring/ benchmarking logistics performance of any trucking company are to reduce operational costs and increase profitability. On the other hand, measuring operational costs helps to identify whether and where to make operational changes to control expenses and identify areas for improved performance. Hence, in this industry trend, trucking operational costs and the variables involved viz. driver wages & benefits, fuel prices, repairs & maintenance costs, tyre costs etc. have been studied over the base year of study, and presented for the geography studied (country or region as per the scope of report).
- Warehousing and Storage - Warehousing and storage segment captures revenue earned through the operation of general merchandise, refrigerated and other types of warehousing & storage facilities. These establishments take responsibility for storing the goods and keeping them secure in lieu of charges. Value added services (VAS) they may provide are considered to be a part of the "other services" segment. Here VAS refer to a range of services, related to the distribution of a customer's goods and can include labelling, breaking bulk, inventory control & management, light assembly, order entry & fulfillment, packaging, pick & pack, price marking & ticketing and transportation arrangement.
- Wholesale and Retail Trade - This end user industry segment captures the external (outsourced) logistics expenditure incurred by the wholesalers and retailers. The end user players considered are the establishments primarily engaged in wholesaling or retailing merchandise, generally without transformation, and rendering services incidental to the sale of merchandise. Logistics Service Providers (LSPs) plays a crucial role in the reliable movement of supplies to and finished products from production houses to the distributors and finally to the end customer covering activites like material sourcing, transportation, order fulfillment, warehousing & storage, demand forecasting, inventory management etc.
| Keyword | Definition |
|---|---|
| Axle Load | The axle load of a wheeled vehicle is the total weight bearing on the roadway for all wheels connected to a given axle. |
| Back Haul | Backhaul is the return movement of a transport vehicle from its original destination to its original point of departure. |
| Bill of Lading | A bill of lading is a legal document issued by a carrier to a shipper that details the type, quantity, and destination of the goods being carried. |
| Bunkering | Bunkering is the process of supplying fuel and/or gasoil to be used to power the propulsion system of a ship (such fuel is referred to as bunker). It includes the logistics of loading and distributing the fuel among available shipboard tanks. A person dealing in trade of bunker (fuel) is called a bunker trader. |
| Bunkering Service | Bunkering service is the supply of a requested quality and quantity of bunkers to a ship. |
| C-commerce | C-commerce (Collaborative commerce) describes electronically enabled business interactions among an enterprise’s internal personnel, business partners and customers throughout a trading community. The trading community could be an industry, industry segment, supply chain or supply chain segment. |
| Cabotage | Transport by a vehicle registered in a country performed on the national territory of another country. |
| Cartage Agent | A ground transportation service that provides pickup and delivery of freight in locations not served directly by an air or ocean carrier. |
| Contract logistics | Contract logistics refers to the outsourcing of resource management tasks by one company to a third-party company specializing in logistical matters, such as transportation, warehousing, and order fulfillment. |
| Courier | A business that is used to send messages, packages, etc. Courier service refers to the fast or quick, door to door pickup and delivery service for goods or documents. It can be local or international. A company that provides such delivery services is called a courier company. A courier company hires people to provide their services. Such a person hired by the courier service company is called a courier. |
| Cross docking | Cross docking is a practice in logistics management that includes unloading incoming delivery vehicles and loading the materials directly into outbound delivery vehicles, omitting traditional warehouse logistical practices and saving time and money. |
| Cross Trade | International transport between two different countries performed by a vehicle registered in a third country. A third country is a country other than the country of loading/embarkation and than the country of unloading/disembarkation. |
| Customs Clearance | The procedures involved in getting cargo released by Customs through designated formalities such as presenting import license/permit, payment of import duties and other required documentations by the nature of the cargo such as FCC or FDA approval. |
| Customs seal | Customs seal means a seal, stamp or any other preventive means affixed by customs officials to ensure the inviolability of goods, commercial means of transport or warehouses. |
| Dangerous Goods | Dangerous goods (or hazardous materials or HAZMAT) include flammable liquids/solids, gases, compressed, liquified, dissolved under pressure, corrosives, oxidising substances, explosive substances and articles, substances, which on contact with water, emit flammable gasses, organic peroxides, toxic substances, infectious substances, radioactive materials, miscellaneous dangerous goods and articles. |
| Direct Shipment | Direct shipment is a method of delivering goods from the supplier or the product owner to the customer directly. In most cases, the customer orders the goods from the product owner. This delivery scheme reduces transportation and storage costs, but requires additional planning and administration. |
| Drayage | A drayage is a form of trucking service that connects the different modes of shipping (intermodal), such as ocean freight or air freight. It’s a short-haul trip that transports goods from one place to another, usually before or after its long-haul shipping process. Drayage trucks move cargo to and from various destinations, such as container ships, storage lots, order fulfillment warehouses, and rail yards. Typically, drayage only transports goods in short distances and operates only in one metropolitan area. It also requires only one trucker in a single shift. |
| Dry Docking | Dry docking is a term used for repairs or when a ship is taken to the service yard. During dry docking, the whole ship is brought to a dry land so that the submerged portions of the hull can be cleaned or inspected. |
| Dry van | A dry van is a type of semi-trailer that's fully enclosed to protect shipments from outside elements. Designed to carry palletized, boxed or loose freight, dry vans aren't temperature-controlled (unlike refrigerated “reefer” units) and can't carry oversized shipments (unlike flatbed trailers). |
| Feedering | Transport service whereby loaded or empty containers in a regional are transferred to a “mother ship” for a long-haul ocean voyage. |
| Final Demand | Final demand includes all types of commodities (goods as well as services) consumed as final use and might include personal consumption, or consumption by government, by businesses as capital investment, and as exports. includes all types of commodities (goods as well as services) consumed as final use and might include personal consumption, or consumption by government, by businesses as capital investment, and as exports. |
| First mile Delivery | First mile delivery refers to the first stage of the transportation. This is when the parcel leaves the seller’s warehouse and is taken by the courier pick up agent to process it or take it to the warehouse. Once the package reaches the post office or the courier’s hub, it is then sorted and transported further until it reaches the customer’s doorstep. |
| Fiscal storage services | It means a facility, clearly separated from other premises, where the excise goods are produced, processed, held, received or dispatched under a duty suspension arrangement by an authorized depositor, in the course of his business, under conditions laid down by the customs authorities. |
| Flat Bed | It has a back body that is flatly shaped for easy loading and unloading of goods. The flatbed truck is mostly used to transport heavy, oversized, wide and indelicate goods. |
| Flatbed Truck | A flatbed truck is a type of truck with rigid design. It has a back body that is flatly shaped for easy loading and unloading of goods. The flatbed truck is mostly used to transport heavy, oversized, wide and indelicate goods such as machinery, building supplies or equipment. Due to the truck open body, the goods transported with it must not be vulnerable to rain. By functionality, the flatbed truck is comparable to a flatbed trailer. |
| Freight Transit Time | Transit time is how long it takes for a shipment to be delivered to its final destination after being picked up from a designated pick up point. |
| Halal Logistics | It refers to the process of managing the logistics operations such as fleet management, storage/warehousing, and materials handling according to the principles of Shariah law in ensuring the integrity of the halal products at the point of consumption. |
| Haulage | The commercial transport of goods. |
| Inbound Logistics | Inbound logistics is the way materials and other goods are brought into a company. This process includes the steps to order, receive, store, transport and manage incoming supplies. Inbound logistics focuses on the supply part of the supply-demand equation. |
| Intermediate Demand | Intermediate demand includes goods, services, and maintenance and repair construction sold to businesses, excluding capital investment. |
| International Loaded | Place of loading of goods in reporting country (i.e., country in which the vehicle performing the transport is registered) and place of unloading in a different country. |
| International Unloaded | Place of unloading of goods in reporting country (i.e., country in which the vehicle performing the transport is registered) and place of loading in a different country. |
| Last Mile Delivery | Last mile delivery refers to the very last step of the delivery process when a parcel is moved from a transportation hub to its final destination—which, usually, is a personal residence or retail store. |
| Less than-Truck-Load (LTL) | Less-than-truckload, also known as less-than-load (LTL), is a shipping service for relatively small loads or quantities of freight. An LTL provider combines the loads and shipping requirements of several different companies on their trucks, using a hub-and-spoke system to get goods to their destinations. |
| Locomotives Haluage | The transport of coal, ore, workers, and materials underground by means of locomotive-hauled mine cars. The locomotive may be powered by battery, diesel, compressed air, trolley, or some combination such as battery-trolley or trolley-cable reel. |
| Milkrun | A Milk Run is a delivery method used to transport mixed loads from various suppliers to one customer. Instead of each supplier sending a truck every week to meet the needs of one customer, one truck (or vehicle) visits the suppliers to pick up the loads for that customer. This method of transport got its name from the dairy industry practice, where one tanker used to collect milk from several dairy farms for delivery to a milk processing company. |
| Multi country consolidation | Multi-Country Consolidation (MCC) is a cost-effective solution that consolidates ones cargo from different countries of origin to build Full Container Loads (FCL). MCC is most suitable for companies that import light volumes of goods from multiple countries but want to take advantage of the more economic FCL freight rates. |
| Multi-Modal Logistics | Multimodal transportation or multimodal shipping refers to logistics and freight processes that require multiple modes of transportation. |
| Omni Channel Logistics | Omnichannel distribution is a multichannel approach taken by companies to give customers a way to purchase and receive orders from several sales channels with one-touch seamless integration. Some of the ways include- 1. Buy online, then pick-up at the brick and mortar store; 2. Buy online, then have it delivered to the home or another location; 3.In store purchase, with the delivery either to the home or another location; 4. Drop ship from a warehouse or manufacturing center to store, home or other location; 5.Buy online, then return at store or online; 6. Buy online, then return online. |
| OOG cargo | Out of Gauge (OOG) cargo is any cargo that can not be loaded into six-sided shipping containers simply because it is too large. The term is a very loose classification of all cargo with dimensions beyond the maximum 40HC container dimensions. That is a length beyond 12.05 meters – a width beyond 2.33 meters – or a height beyond 2.59 meters. |
| Other ships | Other ships include: Liquefied petroleum gas carriers, liquefied natural gas carriers, parcel (chemical) tankers, specialized tankers, reefers, offshore supply vessels, tugboats, dredgers, cruise, ferries, other non-cargo ships |
| Other Specialised Cargo | Other specialised goods include pre-slung goods (Goods, one or more items, supplied with a sling or slings), mobile units (Mobile Self Propelled Units, Non Self Propelled Units, unrolled vehicles), oversized equipment load (light and heavy machinery that is often too big or too heavy), high value freight that needs extra protection like electronics, financial services road freight. |
| Outsourced Freight Transport | Transport for hire or reward; The carriage for remuneration of goods. |
| Pallets | Raised platform, intended to facilitate the lifting and stacking of goods. |
| Part load | A part load describes goods which only fills a truck partially. In essence, the quantity of the shipment is bigger than the Less Than Truckload (LTL) shipment. Also, the shipment cannot fully occupy a truck i.e. its capacity is much lower than a Full Truckload (FTL) shipment. |
| Paved Road | Road surfaced with crushed stone (macadam) with hydrocarbon binder or bituminized agents, with concrete or with cobblestone. |
| Q-commerce | Q-commerce, also referred to as quick commerce, is a type of e-commerce where emphasis is on quick deliveries, typically in less than an hour. |
| Quay | A stone or metal platform lying alongside or projecting into water for loading and unloading ships. |
| Recommerce | Recommerce is the selling of previously owned items through online marketplaces to buyers who reuse, recycle or resell them. |
| ReverseLogistics | Reverse logistics is a type of supply chain management that moves goods from customers back to the sellers or manufacturers. |
| Road Freight Transport Service | Hiring a trucking agency for transport of commodities (raw materials or manufactured goods including both solids and liquids) form the origin to a destination within the country (domestic) or cross-border (international) constitutes road freight transport market. The service might be Full-Truck-Load or Less than-Truck-Load, containerized or non-containerized, temperature controlled or non temperature controlled, short haul or long haul. |
| Roll-on/roll-off cargo | Roll-on/roll-off (RORO or ro-ro) ships are cargo ships designed to carry wheeled cargo, such as cars, motorcycles, trucks, semi-trailer trucks, buses, trailers, and railroad cars, that are driven on and off the ship on their own wheels or using a platform vehicle, such as a self-propelled modular transporter. |
| Swap bodies | A swap body, swop body, exchangeable container or interchangeable unit, is one of the types of standard freight containers for road and rail transport. |
| Tank Barge | A non-self-propelled vessel constructed or adapted primarily to carry liquid, solid or gaseous commodities or cargos in bulk in cargo spaces (or tanks) through rivers and inland waterways, and may occasionally carry commodities or cargos through oceans and seas when in transit from one inland waterway to another. The commodities or cargos transported are in direct contact with the tank interior. |
| Tautliner vehicle | Tautliner and curtainsider are used as generic names for curtain sided trucks/trailers. The curtains are permanently fixed to a runner at the top and detachable rails/poles at front and rear, allowing the curtains to be drawn open and forklifts used all along the sides for easy and efficient loading and unloading. When closed for travel, vertical load restraint straps are attached to a rope rail beneath the truck bed, connecting the truck bed and curtain along both sides. Winches at either end of the curtain tension it, hence the 'Tautliner' name. This stops the curtain from flapping or drumming in the wind and can also help retain light loads from slipping sideways. |
| Transloading | Transloading is a shipping term that refers to the transfer of goods from one mode of transportation to another en route to their ultimate destination. |
| Tsubo | A Japanese unit of area equal to 35.58 square feet. |
| Unpaved Road | Road with a stabilized base not surfaced with crushed stone, hydrocarbon binder or bituminized agents, concrete or cobblestone. |
| Vessel Husbandry Services | It includes ship maintenance, repairs, cleaning, upkeep of the hull and rigging and equipment. |


Research Methodology
Mordor Intelligence follows a four-step methodology in all our reports.
- Step-1: Identify Key Variables: In order to build a robust forecasting methodology, the variables and factors identified in Step-1 are tested against available historical market numbers. Through an iterative process, the variables required for market forecast are set and the model is built on the basis of these variables.
- Step-2: Build a Market Model: Market-size estimations for the forecast years are in nominal terms. Inflation is considered to be a part of the pricing, and the average selling price (ASP) is varying throughout the forecast period for each country.
- Step-3: Validate and Finalize: In this important step, all market numbers, variables and analyst calls are validated through an extensive network of primary research experts from the market studied. The respondents are selected across levels and functions to generate a holistic picture of the market studied.
- Step-4: Research Outputs: Syndicated Reports, Custom Consulting Assignments, Databases & Subscription Platforms


