Market Overview
| Study Period | 2020 - 2031 |
|---|---|
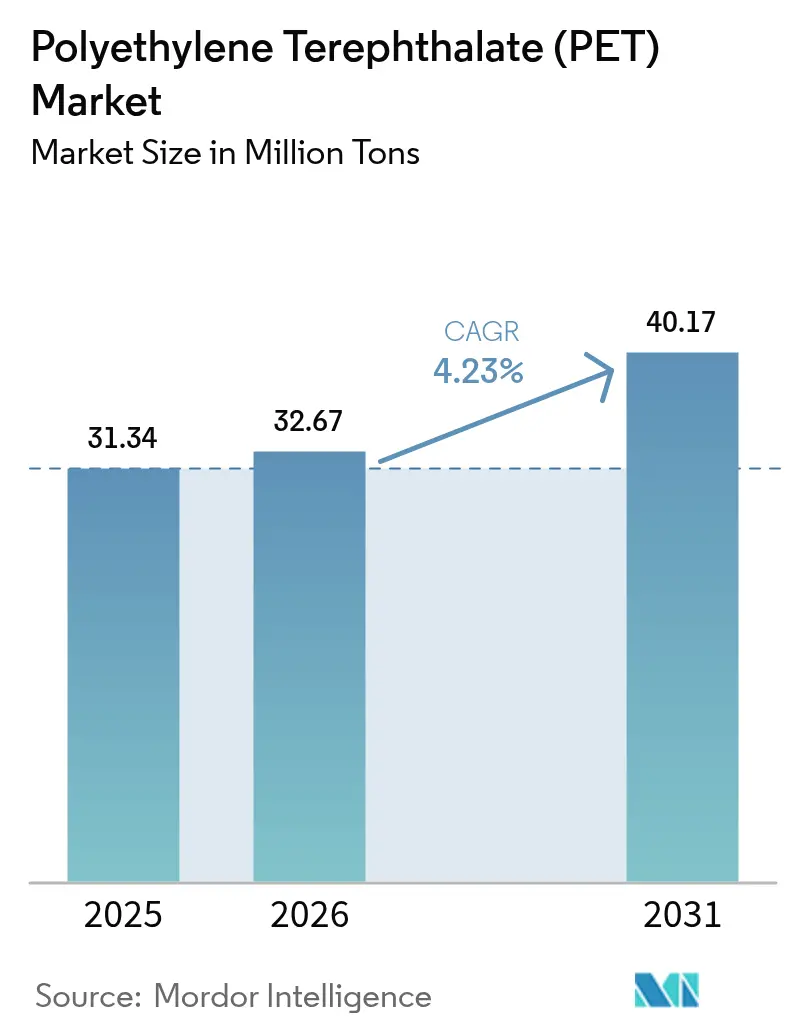
| Market Volume (2026) | 32.67 Million tons |
| Market Volume (2031) | 40.17 Million tons |
| Growth Rate (2026 - 2031) | 4.23% CAGR |
| Fastest Growing Market | Middle East and Africa |
| Largest Market | Asia-Pacific |
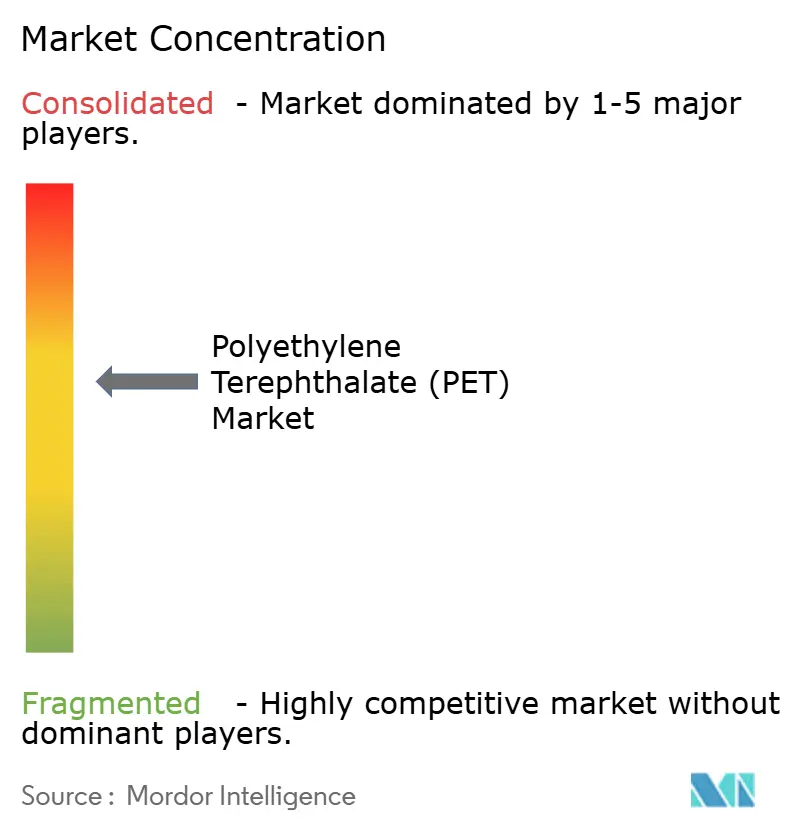
| Market Concentration | Medium |
Major Players *Disclaimer: Major Players sorted in no particular order Image © Mordor Intelligence. Reuse requires attribution under CC BY 4.0. | |
Polyethylene Terephthalate (PET) Market Analysis by Mordor Intelligence
Polyethylene Terephthalate Market size in 2026 is estimated at 32.67 Million tons, growing from 2025 value of 31.34 Million tons with 2031 projections showing 40.17 Million tons, growing at 4.23% CAGR over 2026-2031. Growth rests on the material’s balance of barrier performance, cost-competitiveness, and recyclability, reinforcing its role in beverage packaging even as electronics and technical textiles widen the application base. Robust demand in Asia-Pacific, expanding regulatory mandates for recycled content, and technology advances in chemical recycling underpin volume expansion. Brand-owner sustainability pledges create predictable offtake for rPET (Recycled Polyethylene Terephthalate), while cost-focused procurement in emerging markets sustains virgin resin demand. Feedstock volatility and substitution threats from PEF (polyethylene furanoate) or aluminum introduce headwinds; nonetheless, investment in closed-loop systems and specialty grades positions the PET (Polyethylene Terephthalate) market for diversified growth.
Key Report Takeaways
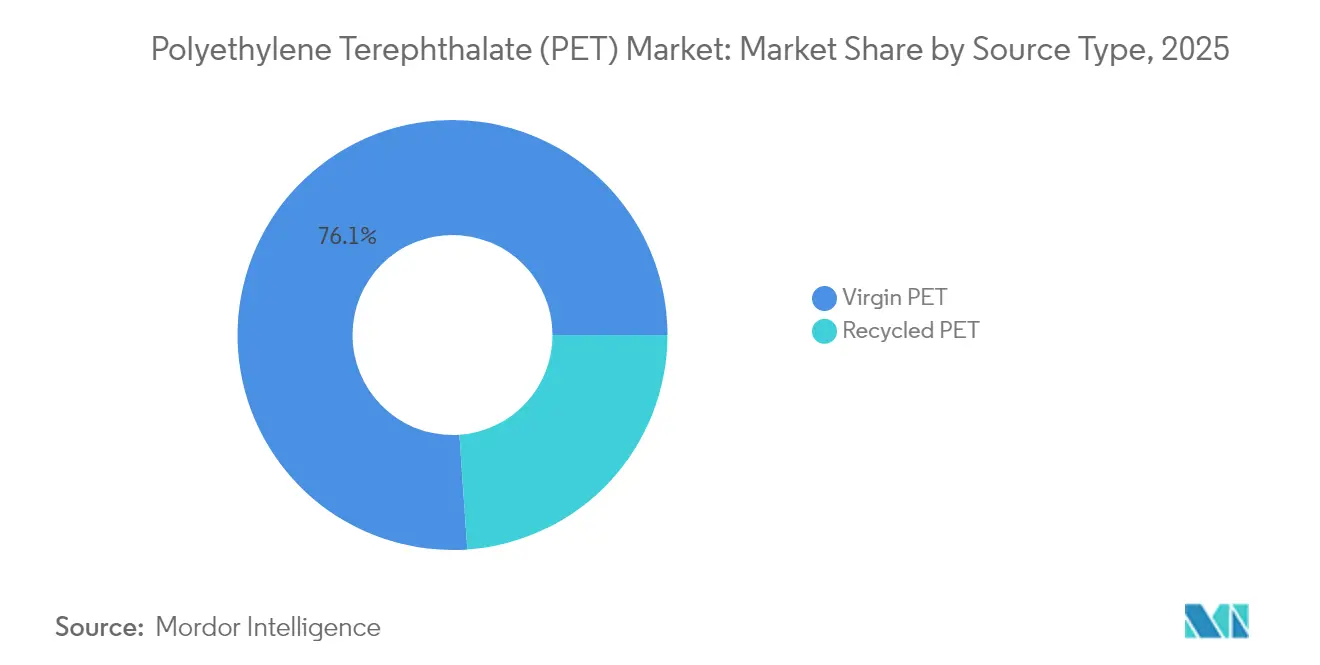
- By source type: virgin resin commanded 76.10% of the Polyethylene Terephthalate (PET) market size in 2025, whereas recycled Polyethylene Terephthalate (PET) is advancing at an 8.02% CAGR to 2031.
- By end-user sector: packaging captured 96.10% of demand in 2025; electrical and electronics is the fastest-growing segment at 5.55% CAGR up to 2031.
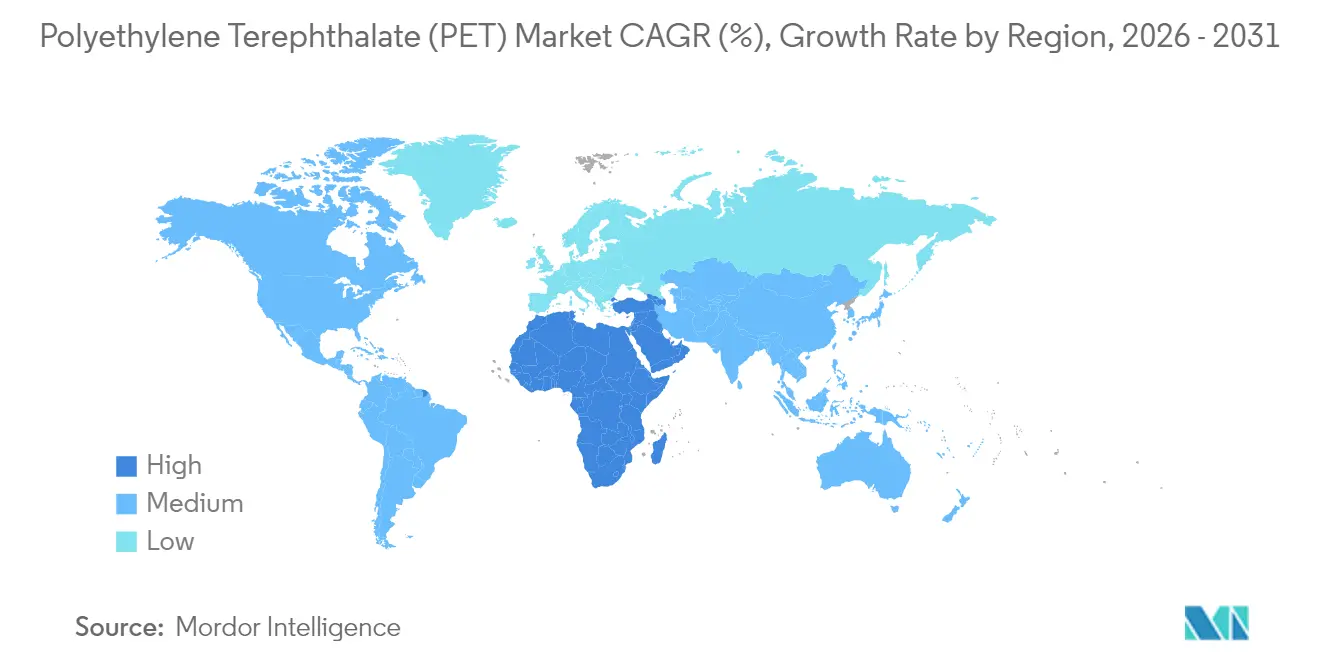
- By geography: Asia-Pacific represented 47.10% of 2025 volume; the Middle East and Africa region is forecast to expand at a 5.05% CAGR over 2026-2031.
Note: Market size and forecast figures in this report are generated using Mordor Intelligence’s proprietary estimation framework, updated with the latest available data and insights as of 2026.
Global Polyethylene Terephthalate (PET) Market Trends and Insights
Drivers Impact Analysis*
| Driver | (~) % Impact on CAGR Forecast | Geographic Relevance | Impact Timeline |
|---|---|---|---|
| Shift Toward Bottle-to-bottle Closed-loop Recycling | +1.2% | Global; strongest in EU and North America | Medium term (2-4 years) |
| Rapid Growth of Aseptic and Hot-fill PET Packaging in Emerging Markets | +0.9% | Asia-Pacific core; spill-over to Middle East & Africa | Short term (≤ 2 years) |
| Expansion of Filament-grade PET in Technical Textiles | +0.7% | Automotive hubs worldwide | Long term (≥ 4 years) |
| Brand-owner Pledges for 50 % rPET Content by 2030 | +0.8% | Primarily North America and EU | Medium term (2-4 years) |
| Government Mandates on Single-use Plastics Substitution | +0.5% | EU leading; adoption widening in Asia-Pacific | Long term (≥ 4 years) |
| Source: Mordor Intelligence | |||


Shift Toward Bottle-to-bottle Closed-loop Recycling
Collection rates of 75% for Polyethylene Terephthalate (PET) beverage bottles in Europe during 2024 pushed recycled content in new bottles to 24%, edging toward the 25% mandate effective end-2025.[1]Petcore Europe, “2024 PET Recycling Report,” petcore-europe.org High-quality flakes diverted from tray applications tightened regional supply and kept European rPET (Recycled Polyethylene Terephthalate) premiums near USD 750-800 per ton above virgin resin. Mechanical recycling limits spur investment in catalytic glycolysis and pyrolysis, yet scale-up costs and feedstock variability restrain immediate impact. Multinationals continue to co-finance infrastructure to secure feedstock, redefining long-term procurement strategies within the Polyethylene Terephthalate (PET) market.
Rapid Growth of Aseptic and Hot-fill PET Packaging in Emerging Markets
Emerging markets in Southeast Asia and Latin America accelerate the adoption of heat-set bottles as cold-chain gaps persist. Polyethylene Terephthalate (PET)’s thermal resistance enables ambient shelf life for juices and dairy drinks, reducing spoilage in areas with unreliable electricity.[2]Tekra Corporation, “Heat-Set PET in Aseptic Packaging,” tekra.com Premium pricing for heat-set grades favors incumbents with specialized equipment, while regulators increasingly cite aseptic packaging as a pillar of food-security policy. The trend widens the Polyethylene Terephthalate (PET) market beyond carbonated beverages and supports regional resin converters investing in stretch-blow molding upgrades.
Expansion of Filament-grade PET in Technical Textiles
Automotive safety regulations and electrification programs elevate demand for high-tenacity PET yarns in seat belts, airbags, and battery insulation. Filament-grade resin must maintain dimensional stability across temperature swings, requiring precise intrinsic-viscosity control and additive packages. Electronics manufacturers adopt film-based PET substrates for flexible printed circuits and foldable displays, boosting specialized resin offtake. These high-value outlets diversify revenue streams, enhancing resilience against cyclical beverage volumes in the wider PET market.
Brand-owner Pledges for 50 % rPET (Recycled Polyethylene Terephthalate) Content by 2030
Corporate goals shape resin mix decisions; however, Coca-Cola’s revision to a 30-35% global rPET target by 2035 underscores supply bottlenecks and cost pressures. PepsiCo’s goal of 100% rPET for its flagship United States brand by 2030 remains, exemplifying differing regional feasibility. Demand visibility encourages recyclers to finance washing and pelletizing expansions, though the gap between pledges and available supply keeps premiums elevated, especially in Europe and North America. Brands differentiate on sustainability claims, influencing consumer preferences within the PET market.
Restraints Impact Analysis*
| Restraint | (~) % Impact on CAGR Forecast | Geographic Relevance | Impact Timeline |
|---|---|---|---|
| Volatility in PX (Paraxylene) and MEG (Mono Ethylene Glycol) Feedstock Prices | -1.1% | Global; Asia-Pacific most exposed | Short term (≤ 2 years) |
| Bottle-to-fibre Down-cycling Oversupply Risk | -0.6% | Mature recycling regions | Medium term (2-4 years) |
| Substitution Threat from PEF and Aluminum | -0.4% | Premium segments in North America and EU | Long term (≥ 4 years) |
| Source: Mordor Intelligence | |||
Volatility in PX (Paraxylene) and MEG (Mono Ethylene Glycol) Feedstock Prices
Paraxylene (PX) and Mono Ethylene Glycol (MEG) account for roughly 85% of PET variable cost, tying margins to crude oil swings. Integrated Asian complexes enjoy logistic advantages, whereas European and North American makers absorb freight and energy premiums. Geopolitical disruptions and shipping constraints recently widened inter-regional price gaps, eroding export competitiveness for standalone plants. Hedging tools offer partial relief but increase contract complexity, particularly for small converters lacking balance-sheet strength.
Substitution Threat from PEF and Aluminum
Bio-based PEF delivers 10-15 times the oxygen barrier of PET, appealing to premium beverage brands pursuing differentiation, yet capacity remains below 50 kilotons globally, and prices sit 30% higher than PET. [3]Packaging Europe, “PEF vs. PET: Barrier Performance,” packagingeurope.com Aluminum cans gain favor in craft beverages due to mature recycling loops, despite energy-intensive production. Switching costs tied to molding lines and supply chains still anchor mainstream brands to the PET market, but continuous innovation in barrier coatings and low-carbon feedstocks is required to repel long-term displacement.
*Our forecasts treat driver/restraint impacts as directional, not additive. The impact forecasts reflect baseline growth, mix effects, and variable interactions.
Segment Analysis
By Source Type: Recycled Grades Outpace Virgin
Virgin resin accounted for 76.10% of global shipments in 2025—roughly 23.85 million tons—owing to cost efficiency and uniform quality. Recycled PET, at just under 7.5 million tons, posted the steepest 8.02% CAGR projection as mandates and brand targets raise demand. Europe led adoption, with 39% of locally produced rPET re-entering bottles in 2024, yet tight feedstock and separate-collection gaps sustained price premiums of USD 150-200 per ton over virgin in North America and up to USD 800 per ton in the EU (European Union).
Mechanical recycling limitations in color and contamination have accelerated interest in chemical depolymerization, though capital intensity impedes widespread roll-out before 2028. Investment in food-grade pelletizing lines expands usable rPET fraction, narrowing the cost differential. Virgin suppliers hedge with captive recycling units to secure bale access, reframing competition along the virgin-recycled continuum in the evolving PET market.


By End-User Industry: Electronics Gain Speed
Packaging applications constituted 96.10% of demand in 2025, reflecting PET’s optimization for beverage, food, and personal-care containers. Beverage growth in developing regions underpins baseline volume. Electrical and electronics, though small in tonnage, is forecast at a 5.55% CAGR to 2031 as flexible displays, printed circuits, and insulation films migrate to PET substrates requiring high dielectric strength and dimensional stability. Automakers specify PET yarns for seat belts and airbag fabrics, further nibbling at the packaging share in value terms.
Electronics expansion demands ultra-clean resin with a tight molecular-weight distribution, prompting resin makers to install dedicated production lines. Value capture per kilogram surpasses commodity packaging, enhancing margin mix. Industrial machinery and construction absorb specialty film and sheet for protective glazing and insulation, anchoring diversified outlets amidst evolving sustainability standards. These shifts progressively distribute revenue beyond packaging within the PET market.

Geography Analysis
Asia-Pacific dominated with 47.10% of the 2025 volume, nearly 14.8 million tons, due to integrated feedstock capacity and burgeoning consumer demand. China retains the largest production base, while India’s consumption accelerates through packaged food growth and recycling investments. Southeast Asian nations such as Indonesia and Thailand add capacity to serve regional beverage and textile hubs. Indorama Ventures strengthened its local footprint via a joint venture with Varun Beverages, illustrating the strategy of coupling scale with local market access.
Europe and North America contribute smaller shares but lead in regulatory frameworks that stimulate rPET uptake. The EU recorded a PET bottle recycling rate of 75% in 2024, driving domestic rPET demand above global norms. High energy and labor costs pressure local producers, but proximity to brand owners seeking low-carbon packaging supports high-value specialty production. North America benefits from shale-based feedstock economics; however, import pressure from Asia tempers margin gains, pushing producers toward technical and recycled grades to remain competitive in the PET market.
The Middle East and Africa region exhibited the fastest 5.05% CAGR outlook. Gulf producers exploit advantaged feedstocks, and companies such as Borouge plan capacity beyond 6.6 million tons per year by 2028, targeting exports to Asia and Africa. Domestic demand rises with urbanization and infrastructure spending, particularly for bottled water and dairy beverages. Political instability and water scarcity pose challenges, yet feedstock economics and geographic location between Europe and Asia provide strategic shipping routes.

Competitive Landscape
The Global Polyethylene Terephthalate (PET) market is moderately concentrated. European and North American firms pivot toward specialty films, medical grades, and chemical-recycling technologies to defend margins against low-priced Asian exports. SABIC and Borouge add Middle Eastern capacity with an export orientation, leveraging advantaged ethylene glycol and paraxylene. Strategic moves include capacity debottlenecking, joint ventures for bottle-flake sourcing, and licensing of glycolysis technologies. Companies enhancing barrier coating or bio-based feedstock capability position for premium segments, resilient to commodity cycles within the PET market. The race to secure post-consumer feedstock intensifies competition at the collection stage, influencing bale pricing and regional availability.
Polyethylene Terephthalate (PET) Industry Leaders
Indorama Ventures Public Co. Ltd.
Sinopec (China Petrochemical Corporation)
Alpek S.A.B. de C.V.
Far Eastern New Century Corporation
SABIC
- *Disclaimer: Major Players sorted in no particular order

Recent Industry Developments
- November 2024: Polyplex, a United States-based producer of polyester films, unveiled plans to expand its production facility in Decatur, Alabama, with operations set to commence in 2025. The facility has introduced a new biaxially oriented polyethylene terephthalate (BOPET) line boasting an annual capacity of 50,000 tonnes.
- October 2024: Suntory Group, a prominent Japanese brewer and distiller, unveiled plans to roll out polyethylene terephthalate (PET) bottles. These innovative bottles, crafted from paraxylene sourced from used cooking oil (UCO), will be featured in select products. This initiative will produce around 45 million PET bottles utilizing the UCO-derived material.


Global Polyethylene Terephthalate (PET) Market Report Scope
Automotive, Building and Construction, Electrical and Electronics, Industrial and Machinery, Packaging are covered as segments by End User Industry. Africa, Asia-Pacific, Europe, Middle East, North America, South America are covered as segments by Region.By Source Type
| Virgin PET |
| Recycled PET (rPET) |
By End User Industry
| Automotive |
| Building and Construction |
| Electrical and Electronics |
| Industrial and Machinery |
| Packaging |
| Other End-user Industries |
By Geography
| Asia-Pacific | China |
| India | |
| Japan | |
| South Korea | |
| Australia | |
| Malaysia | |
| Rest of Asia-Pacific | |
| North America | United States |
| Canada | |
| Mexico | |
| Europe | Germany |
| France | |
| United Kingdom | |
| Italy | |
| Russia | |
| Rest of Europe | |
| South America | Brazil |
| Argentina | |
| Rest of South America | |
| Middle East and Africa | Saudi Arabia |
| United Arab Emirates | |
| South Africa | |
| Nigeria | |
| Rest of Middle East and Africa |
| By Source Type | Virgin PET | |
| Recycled PET (rPET) | ||
| By End User Industry | Automotive | |
| Building and Construction | ||
| Electrical and Electronics | ||
| Industrial and Machinery | ||
| Packaging | ||
| Other End-user Industries | ||
| By Geography | Asia-Pacific | China |
| India | ||
| Japan | ||
| South Korea | ||
| Australia | ||
| Malaysia | ||
| Rest of Asia-Pacific | ||
| North America | United States | |
| Canada | ||
| Mexico | ||
| Europe | Germany | |
| France | ||
| United Kingdom | ||
| Italy | ||
| Russia | ||
| Rest of Europe | ||
| South America | Brazil | |
| Argentina | ||
| Rest of South America | ||
| Middle East and Africa | Saudi Arabia | |
| United Arab Emirates | ||
| South Africa | ||
| Nigeria | ||
| Rest of Middle East and Africa | ||


Market Definition
- End-user Industry - Building & Construction, Packaging, Automotive, Industrial Machinery, Electrical & Electronics, and Others are the end-user industries considered under the polyethylene terephthalate market.
- Resin - Under the scope of the study, virgin polyethylene terephthalate resin in primary forms such as liquid, powder, pellet, etc. are considered.
| Keyword | Definition |
|---|---|
| Acetal | This is a rigid material that has a slippery surface. It can easily withstand wear and tear in abusive work environments. This polymer is used for building applications such as gears, bearings, valve components, etc. |
| Acrylic | This synthetic resin is a derivative of acrylic acid. It forms a smooth surface and is mainly used for various indoor applications. The material can also be used for outdoor applications with a special formulation. |
| Cast film | A cast film is made by depositing a layer of plastic onto a surface then solidifying and removing the film from that surface. The plastic layer can be in molten form, in a solution, or in dispersion. |
| Colorants & Pigments | Colorants & Pigments are additives used to change the color of the plastic. They can be a powder or a resin/color premix. |
| Composite material | A composite material is a material that is produced from two or more constituent materials. These constituent materials have dissimilar chemical or physical properties and are merged to create a material with properties unlike the individual elements. |
| Degree of Polymerization (DP) | The number of monomeric units in a macromolecule, polymer, or oligomer molecule is referred to as the degree of polymerization or DP. Plastics with useful physical properties often have DPs in the thousands. |
| Dispersion | To create a suspension or solution of material in another substance, fine, agglomerated solid particles of one substance are dispersed in a liquid or another substance to form a dispersion. |
| Fiberglass | Fiberglass-reinforced plastic is a material made up of glass fibers embedded in a resin matrix. These materials have high tensile and impact strength. Handrails and platforms are two examples of lightweight structural applications that use standard fiberglass. |
| Fiber-reinforced polymer (FRP) | Fiber-reinforced polymer is a composite material made of a polymer matrix reinforced with fibers. The fibers are usually glass, carbon, aramid, or basalt. |
| Flake | This is a dry, peeled-off piece, usually with an uneven surface, and is the base of cellulosic plastics. |
| Fluoropolymers | This is a fluorocarbon-based polymer with multiple carbon-fluorine bonds. It is characterized by high resistance to solvents, acids, and bases. These materials are tough yet easy to machine. Some of the popular fluoropolymers are PTFE, ETFE, PVDF, PVF, etc. |
| Kevlar | Kevlar is the commonly referred name for aramid fiber, which was initially a Dupont brand for aramid fiber. Any group of lightweight, heat-resistant, solid, synthetic, aromatic polyamide materials that are fashioned into fibers, filaments, or sheets is called aramid fiber. They are classified into Para-aramid and Meta-aramid. |
| Laminate | A structure or surface composed of sequential layers of material bonded under pressure and heat to build up to the desired shape and width. |
| Nylon | They are synthetic fiber-forming polyamides formed into yarns and monofilaments. These fibers possess excellent tensile strength, durability, and elasticity. They have high melting points and can resist chemicals and various liquids. |
| PET preform | A preform is an intermediate product that is subsequently blown into a polyethylene terephthalate (PET) bottle or a container. |
| Plastic compounding | Compounding consists of preparing plastic formulations by mixing and/or blending polymers and additives in a molten state to achieve the desired characteristics. These blends are automatically dosed with fixed setpoints usually through feeders/hoppers. |
| Plastic pellets | Plastic pellets, also known as pre-production pellets or nurdles, are the building blocks for nearly every product made of plastic. |
| Polymerization | It is a chemical reaction of several monomer molecules to form polymer chains that form stable covalent bonds. |
| Styrene Copolymers | A copolymer is a polymer derived from more than one species of monomer, and a styrene copolymer is a chain of polymers consisting of styrene and acrylate. |
| Thermoplastics | Thermoplastics are defined as polymers that become soft material when it is heated and becomes hard when it is cooled. Thermoplastics have wide-ranging properties and can be remolded and recycled without affecting their physical properties. |
| Virgin Plastic | It is a basic form of plastic that has never been used, processed, or developed. It may be considered more valuable than recycled or already used materials. |


Research Methodology
Mordor Intelligence follows a four-step methodology in all our reports.
- Step-1: Identify Key Variables: The quantifiable key variables (industry and extraneous) pertaining to the specific product segment and country are selected from a group of relevant variables & factors based on desk research & literature review; along with primary expert inputs. These variables are further confirmed through regression modeling (wherever required).
- Step-2: Build a Market Model: In order to build a robust forecasting methodology, the variables and factors identified in Step-1 are tested against available historical market numbers. Through an iterative process, the variables required for market forecast are set and the model is built on the basis of these variables.
- Step-3: Validate and Finalize: In this important step, all market numbers, variables and analyst calls are validated through an extensive network of primary research experts from the market studied. The respondents are selected across levels and functions to generate a holistic picture of the market studied.
- Step-4: Research Outputs: Syndicated Reports, Custom Consulting Assignments, Databases & Subscription Platforms


