Australia Container Glass Market Size and Share
Market Overview
| Study Period | 2020 - 2031 |
|---|---|
| Forecast Data Period | 2026 - 2031 |
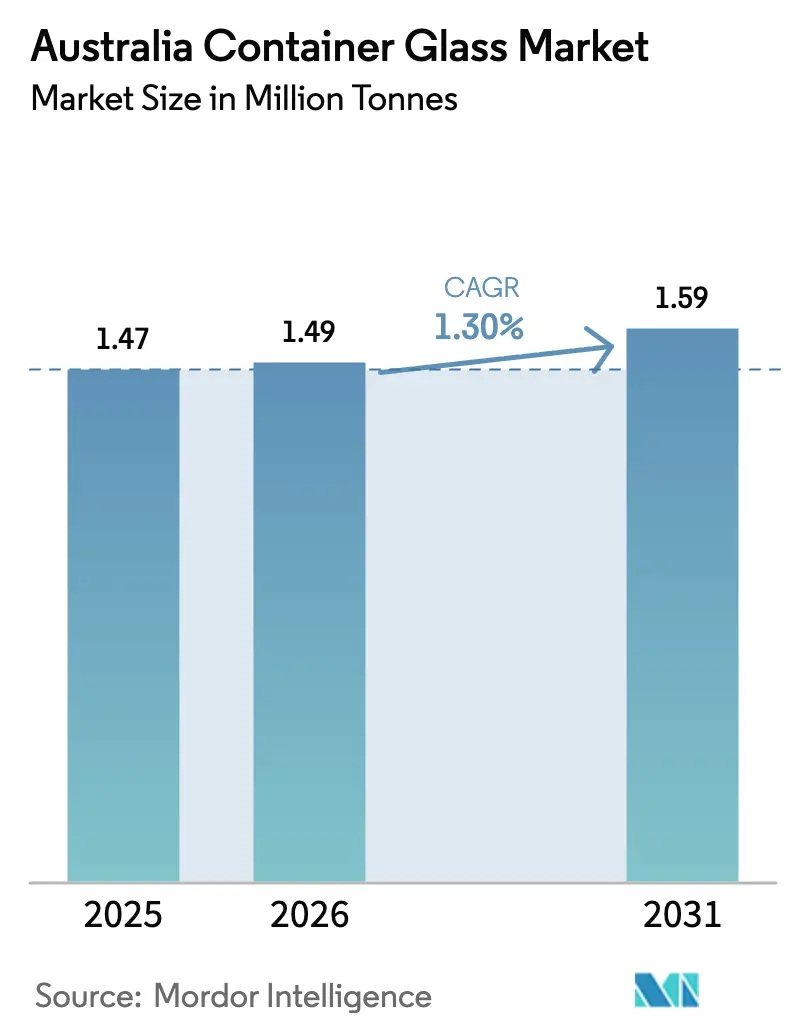
| Base Year Market Size (2025) | 1.47 Million tonnes |
| Market Volume (2026) | 1.49 Million tonnes |
| Market Volume (2031) | 1.59 Million tonnes |
| Growth Rate (2026 - 2031) | 1.30% CAGR |
| Market Concentration | High |
Major Players *Disclaimer: Major Players sorted in no particular order Image © Mordor Intelligence. Reuse requires attribution under CC BY 4.0. | |
Australia Container Glass Market Analysis by Mordor Intelligence
Australia Container Glass Market size in 2026 is estimated at 1.49 million tonnes, growing from 2025 value of 1.47 million tonnes with 2031 projections showing 1.59 million tonnes, growing at 1.30% CAGR over 2026-2031. This steady trajectory reflects a mature demand base in beverages, cosmetics, and pharmaceuticals, balanced against competitive pressure from alternative materials and macro-economic uncertainty. Robust container-deposit programs, state-level circular-economy mandates, and brand-led premiumization sustain volume demand even as aluminum and PET gain share in certain convenience-oriented segments. Investments such as Visy Industries’ USD 150 million furnace in Penrith demonstrate confidence in long-term need for domestically supplied flint and amber bottles. Accelerating recycled-content mandates and extended-producer-responsibility (EPR) frameworks further favor glass because the material can be infinitely re-melted without quality loss.
Key Report Takeaways
- By end-user, beverages captured 69.02% of the Australia container glass market share in 2025.
- By color, the Australia container glass market for amber glass is projected to grow at a 2.45% CAGR between 2026-2031.
Note: Market size and forecast figures in this report are generated using Mordor Intelligence’s proprietary estimation framework, updated with the latest available data and insights as of 2026.
Australia Container Glass Market Trends and Insights
Drivers Impact Analysis*
| Driver | (~) % Impact on CAGR Forecast | Geographic Relevance | Impact Timeline |
|---|---|---|---|
| Rising demand for recyclable packaging | +0.4% | National, strongest in urban centers | Medium term (2-4 years) |
| Growth in beverage consumption | +0.3% | National, major metro areas | Short term (≤ 2 years) |
| Preference for BPA-free inert containers | +0.2% | National, health-conscious demographics | Medium term (2-4 years) |
| Support for circular-economy and EPR | +0.2% | National, state variations | Long term (≥ 4 years) |
| Premium Branding Appeal | +0.1% | National, concentrated in premium retail channels | Medium term (2-4 years) |
| Recycled Glass Integration | +0.1% | National, focused on manufacturing regions | Long term (≥ 4 years) |
| Source: Mordor Intelligence | |||
Rising demand for recyclable and eco-friendly packaging
Container-deposit schemes illustrate the sustainability pull: NSW Return and Earn recycled 168,461 tonnes of glass in 2022-23 and achieved a 76% redemption rate, with 100% of recovered glass re-melted domestically.[1]NSW Parliament, “Return and Earn Annual Statutory Report 2022-23,” parliament.nsw.gov.au Expansion of these schemes to wine and spirits could redirect an additional 233 million bottles annually into the recycling stream, bolstering cullet supply and lowering furnace energy use. Manufacturers are trialing low-carbon furnaces and hydrogen-assisted combustion to cut bottle footprints by up to 20%, aligning with national net-zero ambitions. Brands leverage “made with 70% recycled glass” labels to appeal to environmentally conscious shoppers, further reinforcing demand for cullet-rich flint and amber packaging. Together, these factors lift the long-term attractiveness of the Australian container glass market for both converters and brand owners.
Growth in beverage consumption
Domestic spirits generate AUD 11.6 billion (USD 7.8 billion) in value and sustain 52,900 jobs, while 80% of spirits consumed are produced locally. Premium wine exports above AUD 10 per liter surged 19% to AUD 574 million in 2024, with a preference for heavier flint and bespoke bottle shapes. Coca-Cola Europacific Partners’ AUD 105.5 million (USD 71.3 million) warm-fill line coming online in 2026 underscores the bottler's confidence in glass for high-acid juices and premium non-alcoholic variants. These consumption and capex signals collectively sustain the Australian container glass market even as cans and PET capture convenience occasions.
Preference for BPA-free, inert packaging
The Therapeutic Goods Administration guidance mandates rigorous extractables and leachables controls for medicines, steering pharmaceutical fillers toward Type I or Type II glass vials. Organic food brands mirror this health positioning, marketing “glass-only” packaging to avoid suspected endocrine disruptors tied to certain plastic liners. The inert narrative supports price premiums in kombucha, cold-pressed juice, and dermacosmetic serums, enlarging the value pool within the Australian container glass industry.
Support for circular-economy and EPR schemes
The Australian Packaging Covenant Organisation requires firms above AUD 5 million turnover to document reduction, reuse, and recycling pathways. State governments have co-funded USD 4.8 million in new beneficiation plants to raise cullet quality, and the proposed national mandatory recycling targets would phase in modulated EPR fees favoring designs with >50% recycled glass. These rules institutionalize demand for furnace-ready cullet and effectively hedge the Australia container glass market against commodity-price swings.
Restraints Impact Analysis*
| Restraint | (~) % Impact on CAGR Forecast | Geographic Relevance | Impact Timeline |
|---|---|---|---|
| Competition from PET and aluminum | -0.3% | National, strongest in beverages | Short term (≤ 2 years) |
| Economic uncertainty and investment cycles | -0.1% | National, manufacturing hubs | Medium term (2-4 years) |
| Fragility and Logistics Costs | -0.2% | National, amplified by long transport distances | Short term (≤ 2 years) |
| Limited Domestic Manufacturing Capacity | -0.1% | Concentrated in NSW and Victoria manufacturing regions | Medium term (2-4 years) |
| Source: Mordor Intelligence | |||
Competition from PET and aluminum
Return-and-earn data show that aluminum cans outperform glass in consumer return rates, reaching 80% in 2024, compared to 76% for glass. PET’s lighter weight lowers freight emissions and breakage risk, making it attractive for water and RTD tea. As brand owners set carbon budgets, light-weighting and mono-material flexibles threaten baseline glass volume. Nonetheless, glass retains primacy in premium wines and dark spirits, mitigating the overall drag on the Australian container glass market CAGR.
Economic uncertainty affects investment cycles
The Reserve Bank of Australia observed softer household spending in its May 2025 outlook, projecting subdued GDP recovery and elevated financing costs. Food manufacturers facing higher energy bills have shifted toward imported jars, trimming near-term furnace utilization. Although the USD 15 billion National Reconstruction Fund offers concessional loans, board-level capital allocation reviews have delayed two planned glass lines, tempering incremental capacity growth.
*Our forecasts treat driver/restraint impacts as directional, not additive. The impact forecasts reflect baseline growth, mix effects, and variable interactions.
Segment Analysis
By End-user: Beverages Drive Market Foundation
Beverages commanded 69.02% of the Australian container glass market share in 2025, equivalent to an estimated 1,015 kilotons, and are projected to grow at a modest 1.03% CAGR through 2031. This dominance stems from an entrenched consumer association between glass and product authenticity in beer, craft spirits, and premium mixers. Domestic distillers, buoyed by the AUD 11.6 billion spirits economy, increasingly commission bespoke bottle molds to reinforce provenance messaging. Parallel trends emerge in non-alcoholic premium sodas, where warm-fill lines facilitate preservative-free recipes. Manufacturers offset the weight penalty through lightweighting programs that have reduced the average grammage of beer bottles by 14% since 2015.
Cosmetics and personal care, which account for only 3.95% of the 2025 volume, show the fastest expansion at a 2.18% CAGR, translating to a 2031 forecast of 66 kilotons. Niche skincare brands often utilize glass droppers and airless pumps to convey purity, particularly in formulations that contain high concentrations of volatile essential oils. Regulatory scrutiny of microplastics and PFAS in packaging amplifies the case for small-format flint and amber bottles. Pharmacies prefer glass vials for compounded treatments, and the growth of dermal-filler clinics further increases demand for medical-grade vials.


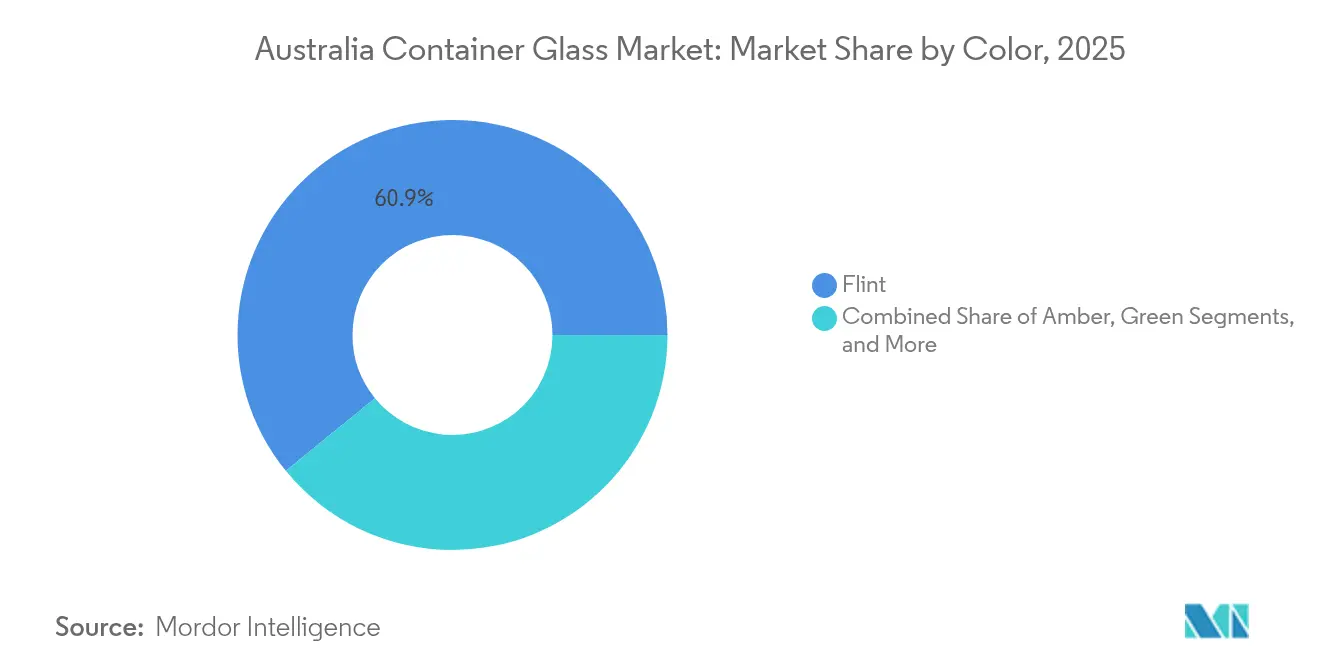
By Color: Flint Dominance with Amber Growth
Flint represented 60.88% of the Australia container glass market size in 2025, supplying mainstream beer, RTD coffee, and dairy-based drinks. High clarity supports brand storytelling and ingredient visibility, with Orora’s 700 mL cork-mouth spirit designs weighing 785 g yet achieving 35% recycled content.
Amber glass, projected at a 2.45% CAGR, safeguards UV-sensitive spirits and pharmaceuticals. The Therapeutic Goods Administration’s leachable guidelines drive drug-product fillers to amber Type III vials for photostability. Green maintains relevance in still wine but loses share to custom black and antique hues, which are leveraged for limited-edition releases. Specialty colors, including cobalt and frosted finishes, enable premium differentiation in perfumery but remain <2% of total tonnes.
Geography Analysis
Eastern Australia accounts for an estimated 82.64% of 2025 output, anchored by New South Wales and Victoria. O-I Glass’s Penrith plant, Australia’s largest, casts 4 million units daily, supplying Tooheys, Carlton United Breweries, and Bundaberg. Visy’s new furnace, also located in Penrith, increases Eastern seaboard capacity by 25% and incorporates high-oxygen firing, which reduces specific energy use by 15%. Concentration offers economies of scale but exposes the Australian container glass market to transport cost volatility when shipping to Western Australia or the Northern Territory.
Queensland supplies high-purity silica sand from Cape Flattery, shipping 3 million tonnes annually and feeding NSW and Victorian furnaces via bulk carriers. South Australia contributes additional feedstock from Glenshera, ensuring redundancy if cyclones disrupt east-coast quarries. Victoria hosts ancillary beneficiation and color-sorting operations, improving cullet purity to <20 ppm ceramic contamination. The cross-state raw-material matrix emphasizes the logistics dimension of finished-glass competitiveness.
Growth pockets are emerging in Western Australia, driven by population growth and increasing craft-beer penetration. TricorBraun’s Perth distribution hub, opened in 2024, shortens lead times for micro-distillers previously reliant on east-coast supply. State-specific container-deposit targets may catalyze new beneficiation capacity west of the Nullarbor, further diffusing the Australian container glass market production.
Competitive Landscape
The top three producers, O-I Glass, Visy Industries, and Orora, collectively controlled about 68% of 2024 volume, reflecting a moderately concentrated supplier base. Orora’s beneficiation upgrade increased the availability of recycled content for its Gawler wine-bottle line, enhancing the sustainability propositions for Barossa and McLaren Vale vintners. Visy’s Penrith rebuild, completed in July 2024, exemplifies the sustainability race: the furnace can achieve 70% cullet usage and co-firing with biogas, targeting a 15% reduction in CO₂ emissions.
Strategic focus centers on lightweighting, cullet sourcing, and footprint optimization. O-I is piloting MAGMA modular melters that enable 300 tons per day campaigns tailored to peak craft-beer season.[3]O-I Glass Inc., “Form 10-K 2023,” sec.gov Orora, meanwhile, leverages glass-and-closure bundles to lock in multi-year supply agreements with beverage brand owners seeking single-source accountability. Imported premium bottles from Ardagh and Verallia fill niche perfumery and extra-flint requirements, although shipping costs shield local players from large-scale incursion.
Sustainability positioning now influences tender outcomes more than unit price. Brands request life-cycle-analysis dashboards and guarantee of origin for cullet. This dynamic encourages vertical collaborations such as Penrith City Council’s “Glass-to-Glass” precinct vision linking municipal MRFs to Visy and O-I furnaces.
Australia Container Glass Industry Leaders
SCHOTT Australia Pty. Ltd.
Orora Limited
Ardagh Group S.A
COSPAK Pty Ltd
Visy Industries Australia Pty Ltd
- *Disclaimer: Major Players sorted in no particular order


Recent Industry Developments
- August 2024: Coca-Cola Europacific Partners announced an AUD 105.5 million warm-fill glass line at Moorabbin, set to go online.
- July 2024: Visy completed a USD 150 million sustainable furnace in Penrith, boosting capacity and integrating low-NOₓ burners.
- July 2024: Saint-Gobain finalized the acquisition of CSR Limited, expanding its footprint in Asia-Pacific construction materials.
- July 2024: The Department of Climate Change, Energy, Environment and Water released a three-option EPR framework for all packaging, opening consultation on modulated fees.


Australia Container Glass Market Report Scope
Container glass is designed for crafting glass containers, including bottles, jars, drinkware, and bowls. Its key attributes include chemical inertness, sterility, and non-permeability, rendering it especially sought after in the beverage, food, pharmaceutical, and cosmetic sectors. The research also examines underlying growth influencers and significant industry vendors, all of which help to support market estimates and growth rates throughout the anticipated period. The market estimates and projections are based on the base year factors and arrived at top-down and bottom-up approaches.
Australia container glass market is segmented by end-user vertical (beverages [alcoholic beverages (beer, wine, spirits, and other alcoholic beverages {cider and other fermented drinks}), non-alcoholic beverages (juices, carbonated drinks (CSDs), dairy product-based drinks, other non-alcoholic beverages)], food [jam, jelly, marmalades, honey, sausages and condiments, oil, pickles], cosmetics and personal care, pharmaceuticals (excluding vials and ampoules), and perfumery, by color (green, amber, flint and other colors). The report offers market forecasts and size in volume (kilotons) for all the above segments.
| Beverages | Alcoholic | Beer |
| Wine | ||
| Spirits | ||
| Other Alcoholic Beverages (Cider and Other Fermented Drinks) | ||
| Non-Alcoholic | Juices | |
| Carbonated Drinks (CSDs) | ||
| Dairy Product Based Drinks | ||
| Other Non-Alcoholic Beverages | ||
| Food (Jam, Jelly, Marmalades, Honey, Sausages and Condiments, Oil, Pickles) | ||
| Cosmetics and Personal Care | ||
| Pharmaceuticals (excluding Vials and Ampoules) | ||
| Perfumery | ||
| Green |
| Amber |
| Flint |
| Other Colors |
| By End-user | Beverages | Alcoholic | Beer |
| Wine | |||
| Spirits | |||
| Other Alcoholic Beverages (Cider and Other Fermented Drinks) | |||
| Non-Alcoholic | Juices | ||
| Carbonated Drinks (CSDs) | |||
| Dairy Product Based Drinks | |||
| Other Non-Alcoholic Beverages | |||
| Food (Jam, Jelly, Marmalades, Honey, Sausages and Condiments, Oil, Pickles) | |||
| Cosmetics and Personal Care | |||
| Pharmaceuticals (excluding Vials and Ampoules) | |||
| Perfumery | |||
| By Color | Green | ||
| Amber | |||
| Flint | |||
| Other Colors | |||


Key Questions Answered in the Report
What is the current volume of the Australia container glass market in 2026?
The market reaches 1.49 million tonnes in 2026.
How fast is cosmetics and personal care glass packaging growing?
It registers a 2.18% CAGR through 2031, the fastest among tracked segments.
Which color segment is expanding quickest?
Amber glass leads color growth with a 2.45% CAGR.
Where are most container glass furnaces located?
New South Wales and Victoria host the largest facilities, led by Penrith plants.
What drives recent capacity investments?
Sustainability upgrades, higher recycled-glass mandates, and demand for premium bottles motivate furnace rebuilds and expansions.
Page last updated on:


