Market Overview
| Study Period | 2020 - 2031 |
|---|---|
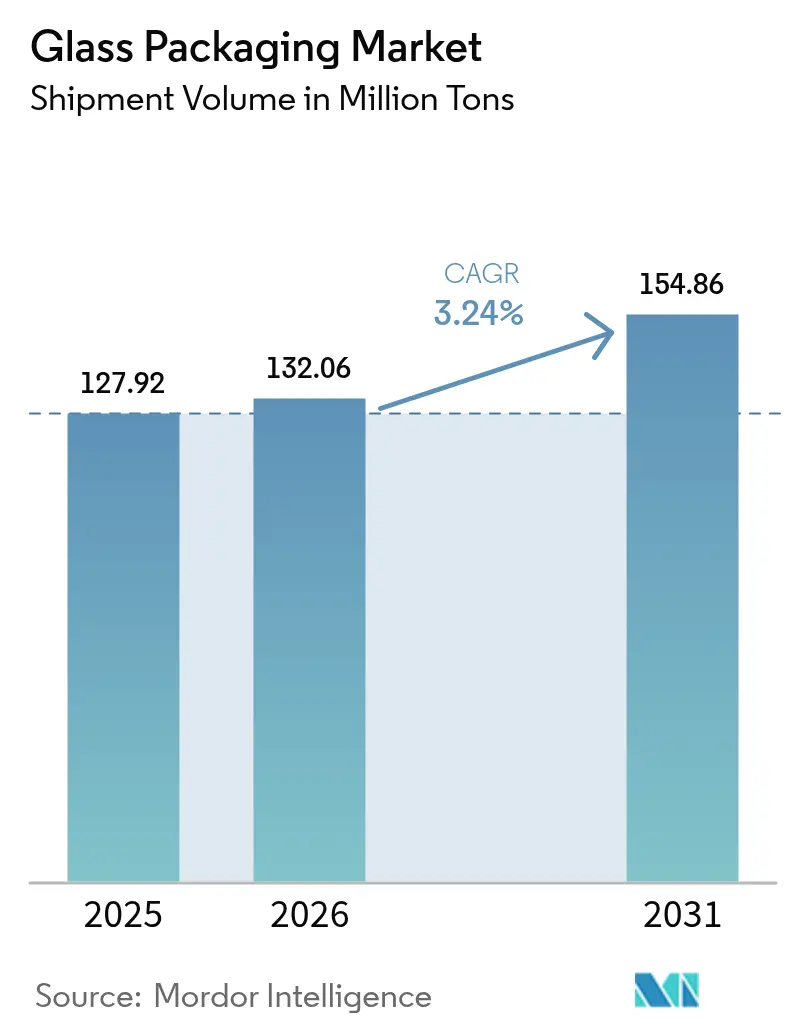
| Market Volume (2026) | 132.06 Million tons |
| Market Volume (2031) | 154.86 Million tons |
| Growth Rate (2026 - 2031) | 3.24% CAGR |
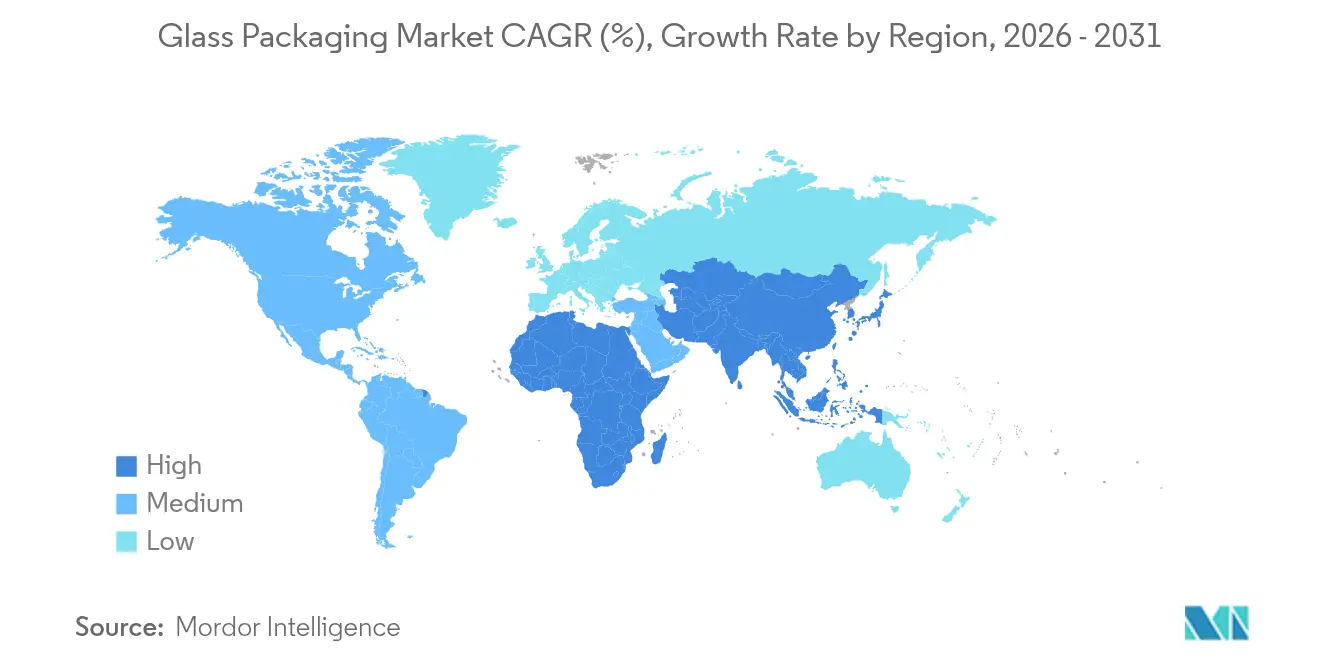
| Fastest Growing Market | Middle East and Africa |
| Largest Market | Europe |
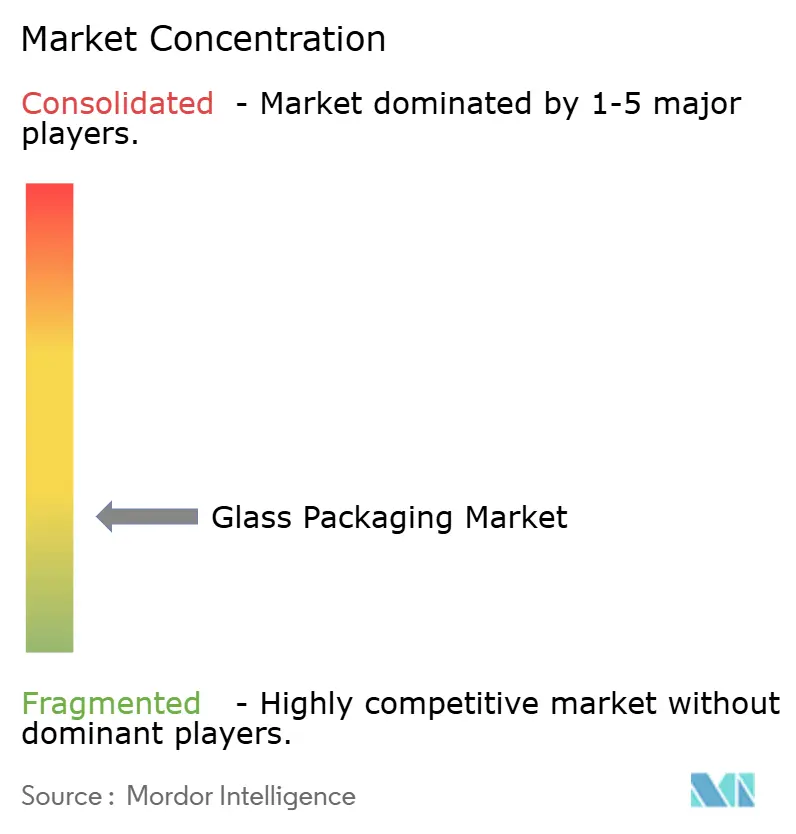
| Market Concentration | Low |
Major Players.webp)
*Disclaimer: Major Players sorted in no particular order Image © Mordor Intelligence. Reuse requires attribution under CC BY 4.0. |
|
Glass Packaging Market Analysis by Mordor Intelligence
The glass packaging market size was valued at 127.92 million tons in 2025 and estimated to grow from 132.06 million tons in 2026 to reach 154.86 million tons by 2031, at a CAGR of 3.24% during the forecast period (2026-2031). This steady, volume-driven growth reflects the industry’s shift toward sustainable materials, the rapid scale-up of vial production for new biologics, and continuing premiumization in beverages. Glass maintains relevance because it offers infinite recyclability, strong barrier properties, and a premium look that supports brand differentiation. Manufacturers are investing in electric furnaces, higher cullet content, and lightweight bottle designs to cut emissions and reduce total material use. At the same time, mid-size containers between 500 ml and 1 l are winning share thanks to the rise of family packs and bulk purchasing through e-commerce channels.
Key Report Takeaways
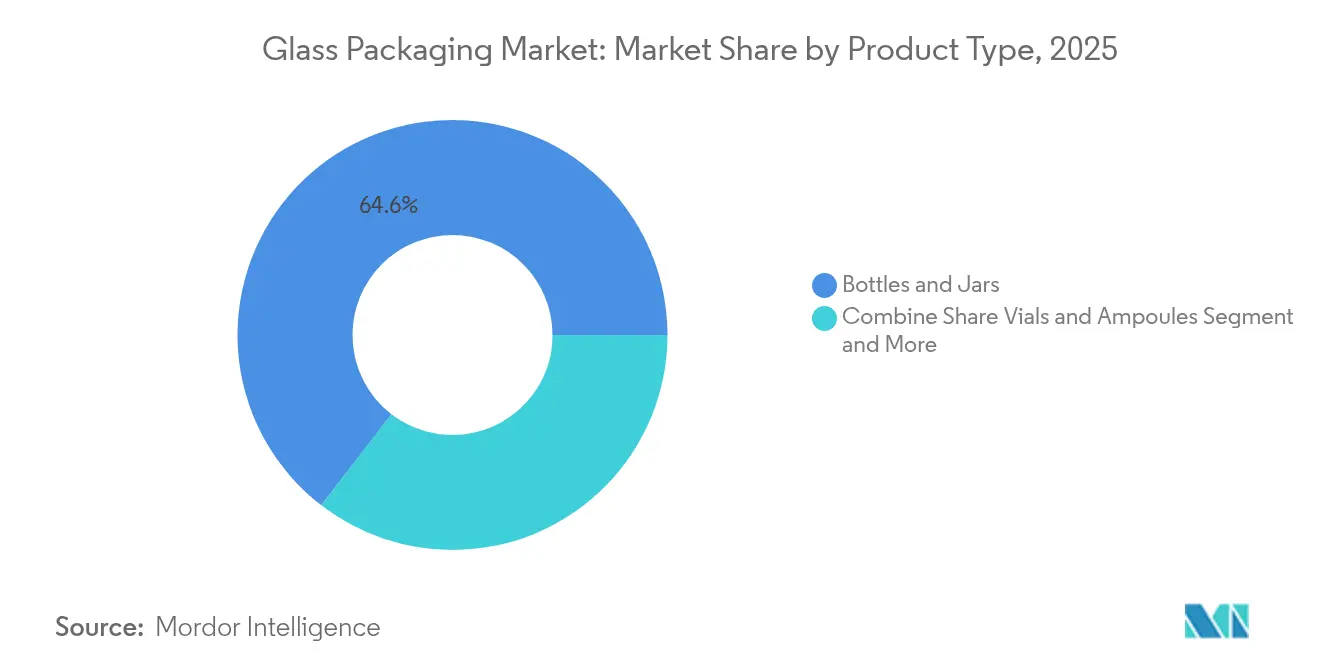
- By product type, bottles and jars led with 64.55% revenue share in 2025, while vials and ampoules are projected to expand at a 6.28% CAGR through 2031.
- By end-use industry, beverages held 54.10% of glass packaging market share in 2025; pharmaceuticals record the highest projected CAGR at 7.11% through 2031.
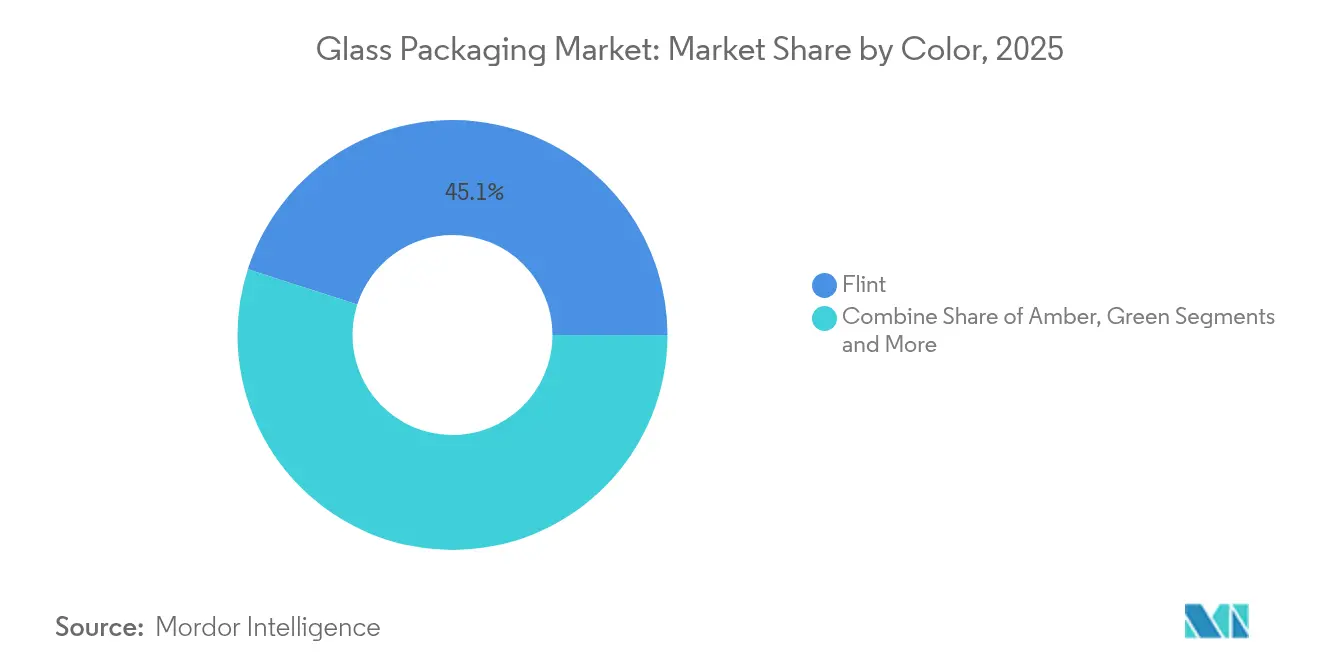
- By color, flint led with 45.05% revenue share in 2025, while green is projected to expand at a 5.26% CAGR through 2031.
- By capacity, the 500-1000 ml range captured 36.10% share of the glass packaging market size in 2025 and is advancing at a 6.52% CAGR through 2031.
- By geography, Europe accounted for 37.75% of global volume in 2025, while the Middle East and Africa region is forecast to post the fastest growth at 7.67% CAGR to 2031.
Note: Market size and forecast figures in this report are generated using Mordor Intelligence’s proprietary estimation framework, updated with the latest available data and insights as of 2026.
Market Trends and Insights
Drivers Impact Analysis of Glass Packaging Market*
| Driver | (~) % Impact on CAGR Forecast | Geographic Relevance | Impact Timeline |
|---|---|---|---|
| Craft beer and premium spirits surge | +0.8% | North America, Europe | Medium term (2-4 years) |
| mRNA and vector-vaccine rollout boosting pharma glass vials | +1.2% | North America, Europe, Asia-Pacific | Long term (≥ 4 years) |
| Increasing demand from cosmetics industry for premium packaging | +0.6% | Europe, North America | Medium term (2-4 years) |
| RTD coffee and functional drinks uptake in Asia | +0.7% | Asia-Pacific, Middle East & Africa | Short term (≤ 2 years) |
| Multifaceted advantages of container glass | +0.5% | Global | Long term (≥ 4 years) |
| Source: Mordor Intelligence | |||


Craft Beer and Premium Spirits Surge Fueling Glass Bottle Demand
Rising craft breweries and new distilleries are fueling incremental glass bottle orders. Ardagh Group broadened its premium spirits portfolio in 2024 to meet this appetite. [1]Ardagh Group, “Ardagh Expands Premium Spirits Portfolio,” ardaghgroup.com The UK spirits market reached GBP 16.8 billion in 2024 with more than 50 additional distilleries, demonstrating how premium positioning drives glass uptake. Ready-to-drink cocktails are projected to grow 16.2% per year to 2030, favouring glass because it safeguards flavour and signals authenticity. The hyperlocal trend in spirits production also benefits small-batch glass bottle runs that showcase craft heritage. Brand owners value the material’s clarity, rigidity, and inertness when presenting super-premium liquids.
mRNA and Vector-Vaccine Rollout Boosting Pharmaceutical Glass Vials
Scaling production of new biologics drives sustained demand for Type I vials. SCHOTT Pharma committed USD 371 million to a North Carolina plant that will supply glass syringes for GLP-1 drugs and refillable polymer systems for mRNA medicines. The FDA issued updated guidance on container-closure changes in 2024, underscoring regulatory focus on vial quality. [2]FDA, “Container Closure System and Component Changes,” fda.govCorning’s Valor formulation removes boron to prevent delamination, addressing drug safety while enabling automated filling lines. These moves confirm the long-term growth runway for pharma glass packaging market solutions.
Increasing Demand from Cosmetics Industry for Premium Packaging
Beauty brands view glass as both eco-friendly and prestige enhancing. APackaging Group reported growing adoption of glass flacons among sustainable-focused labels. Verescence leverages customizable shapes and high cullet content to satisfy luxury houses. Market research shows the global fragrance sector expanded 10.2% in 2024, creating fresh opportunities for decorative glass that preserves volatile oils. Lumson’s launch of 1,500 fragrance pack combinations in its anniversary collection illustrates how design innovation keeps glass central to premium beauty strategies.
RTD Coffee and Functional Drinks Uptake in Asia Spurring Lightweight Glass Bottles
Asia-Pacific’s ready-to-drink (RTD) tea and coffee segment could reach USD 172.28 billion by 2030 at a 7.02% CAGR. Producers prefer lightweight glass bottles that combine an upscale look with full recyclability. Westrock Coffee installed advanced retort lines in Arkansas to preserve flavour in single-serve glass, highlighting quality control priorities. Young consumers in China and Southeast Asia link clear glass with natural ingredients, which in turn drives premium pricing and brand loyalty.
Restraints Impact Analysis of Glass Packaging Market*
| Restraint | (~) % Impact on CAGR Forecast | Geographic Relevance | Impact Timeline |
|---|---|---|---|
| Availability of alternative solutions | -0.9% | Global | Medium term (2-4 years) |
| Shortage of pharma-grade borosilicate tubing | -0.6% | Pharma hubs worldwide | Short term (≤ 2 years) |
| Higher carbon footprint in glass manufacturing | -0.7% | Europe, North America | Long term (≥ 4 years) |
| Source: Mordor Intelligence | |||
Availability of Alternative Solutions
Lightweight aluminum and emerging bio-based plastics are eating into the addressable volume of the glass packaging market, particularly in cost-sensitive beverage segments. Kopu Water highlights the superior residual value of aluminum, which supports near-100% capture rates in closed-loop channels. BlueTriton adopted aluminum bottles for Poland Spring to improve recycling economics. European policy that targets petrochemical reduction accelerates innovation in PLA and PEF, raising competitive intensity for glass.
Shortage of Pharma-Grade Borosilicate Tubing Limits Vial Supply
High-precision tubing is concentrated among a few suppliers, creating bottlenecks as biologics demand surges. SGD Pharma expanded siliconised vial capacity in 2024 to mitigate shortages. [3]Medical Plastics News, “SGD Pharma Expands Siliconised Vial Capacity,” medicalplasticsnews.com Corning and SGD Pharma established a joint venture in India for Velocity Vials, yet tight supply is expected to persist in the near term. Maintaining dimensional uniformity and meeting stringent endotoxin limits require capital-intensive processes that slow ramp-ups.
*Our forecasts treat driver/restraint impacts as directional, not additive. The impact forecasts reflect baseline growth, mix effects, and variable interactions.
Glass Packaging Market Segment Analysis
By Product Type:
Pharmaceutical Vials Drive InnovationBottles and jars held 64.55% of 2025 volumes as they span food, beverage, and beauty sectors. Vials and ampoules posted the fastest trajectory, growing at 6.28% CAGR on the back of new cell-and-gene therapies that require inert packaging. SCHOTT Pharma generated USD 1.034 billion revenue in 2024 from syringe and vial solutions. Corning’s Valor glass eliminates delamination, improving durability in automated fill lines. The glass packaging market size for vials is projected to climb steadily as biologic pipelines mature.
Broader specialty items such as laboratory containers remain niche but stable. Automation has replaced hand-blown production, ensuring uniform wall thickness and dimensional accuracy. Gerresheimer’s acquisition of Bormioli Pharma adds the EZ-fill Smart platform to streamline ready-to-fill processing. Competitive differentiation now centres on surface coatings and smart caps that monitor adherence.


By End-Use Industry:
Beverages Lead While Pharmaceuticals AccelerateBeverages commanded 54.10% share in 2025 thanks to entrenched glass preferences in beer, wine, and spirits. Craft labels choose flint bottles to showcase colour and carbonation. Non-alcoholic drinks such as premium juices and dairy blends also lean on glass for flavour integrity. The glass packaging market share held by beverages is expected to persist as premium SKUs outgrow mass brands.
Pharmaceuticals represent the fastest-growing vertical at 7.11% CAGR. Production of mRNA vaccines and GLP-1 injectables will push the glass packaging market size for pharma to new highs by 2031. Cosmetics, fragrances, and personal care lines turn to glass to communicate luxury while meeting recyclability goals. Food applications maintain baseline demand, particularly for sauces and gourmet condiments that benefit from product visibility.
By Color:
Flint Glass Dominates Across ApplicationsFlint glass accounted for 45.05% of shipments in 2025, capitalizing on transparency that lets consumers inspect fill level and purity. Amber remains standard for light-sensitive drugs and beer, whereas green is the fastest-growing colour segment at 5.26% CAGR because wineries and craft brewers link it with eco credentials. Colored cullet content supports energy savings during melting.
Blue and other custom tints satisfy luxury fragrance and gin markets where differentiation is critical. Higher recycled content does not compromise aesthetics, boosting acceptance among premium brands. Colour segmentation demonstrates how visual cues intertwine with sustainability to shape buying decisions.
By Capacity:
Mid-Size Containers Lead MarketContainers between 500 ml and 1 l captured 36.10% of volumes in 2025 and will grow at 6.52% CAGR as families favour fewer shopping trips and larger formats. E-commerce amplifies this preference because consumers can handle heavier packs without store visits. Brands use lightweighting to keep freight costs manageable while retaining glass’s premium feel.
Small formats under 200 ml thrive in high-value perfumes, travel-size cosmetics, and injectable vials. Medium formats of 200-500 ml fit craft beer and functional drinks, meeting portion-control needs. Containers over 1 l cater to food-service sauces and institutional buyers, where glass’s inertness confers shelf-life advantages.
Geography Analysis
Europe Glass Packaging Market
Europe controlled 37.75% of 2025 volume owing to a mature manufacturing base, stringent recycling targets, and entrenched wine and spirits culture. Verallia switched on the first fully electric furnace in Cognac, trimming CO₂ by 60% and demonstrating the region’s decarbonization leadership AGC Glass Europe recycled 700,000 tons of cullet during 2023, reinforcing circular-economy momentum. Stringent producer-responsibility directives tilt the regulatory field toward glass over certain plastics. Demand pulled back slightly in 2024 on softer beer volumes, yet innovation and premiumization keep value stable.
North America Glass Packaging Market
North America remains a pivotal market supported by craft beverages and biotech hubs. O-I Glass, the region’s largest producer, is reviewing a 7% capacity cut by mid-2025 to align supply with demand shifts. Investments in electrification at Veauche and Alloa plants highlight the group’s commitment to emission reductions. Regulatory incentives for recycled content and advanced manufacturing tax credits could accelerate modernization.
APAC Glass Packaging Market
Asia-Pacific shows resilient growth despite temporary inventory overhangs in China. BG Container Glass posted USD 432 million revenue in 2023 and expects 4.7% CAGR through 2030. China’s flat glass makers are pivoting toward photovoltaic and automotive markets, freeing capacity for container glass once demand rebounds. Rapid urbanization, new middle-class consumers, and the RTD boom all support long-term expansion of the glass packaging market.
MEA Glass Packaging Market
The Middle East and Africa is set to record the strongest 7.67% CAGR through 2031, driven by infrastructure build-out and rising packaged-goods demand. Vitro plans USD 400 million of glass investments in Egypt to meet regional growth. HORN fired up a new furnace for Frigoglass in Nigeria, proving local capability gains. Government policies encouraging domestic manufacturing reduce import reliance and build supply-chain resilience.
South America Glass Packaging Market
South America delivers steady gains from beverage staples and improving recycling systems. Producers are exploring lightweight bottles to cut logistics costs across vast geographies. Altogether, geographic dynamics highlight how sustainability frameworks, energy prices, and consumer preferences create diverse regional trajectories.

Regulatory Landscape
The regulatory environment for glass packaging continues to be shaped by both EU and US frameworks. In the European Union, Regulation (EU) 2025/40 on packaging and packaging waste (PPWR) entered into force on 11 February 2025 and applies from 12 August 2026, creating a harmonized framework for material choices, design-for-recycling, and labeling across member states. In the United States, the FDA continues to reference USP General Chapter <660> Containers Glass for pharma applications, with updated guidance issued in 2024 reinforcing robust change-control for vials, ampoules and related components, while the December 2025 ICH Assembly endorsement of the Q3E draft on extractables and leachables adds momentum to risk-based packaging safety.
Competitive Landscape
The glass packaging industry shows moderate fragmentation. O-I Glass, Ardagh Group, and Gerresheimer dominate high-volume production yet face rising regional challengers. O-I’s “Fit to Win” review underlines how large players must continuously optimize capacity in mature segments. Scale remains important, but customers increasingly evaluate suppliers on carbon footprint, design flexibility, and service responsiveness rather than tonnage alone.
Strategic mergers and partnerships are reshaping the field. Gerresheimer bought Bormioli Pharma to broaden containment solutions and introduce digital monitoring closures. SGD Pharma collaborates with Corning on Velocity Vials, integrating next-generation glass technology with global supply reach. Sustainability branding also drives differentiation: Verallia’s ECOVA lightweight range contains 51% cullet and appeals to beverage giants like Heineken.
Technology investments focus on decarbonization and digitalization. Ardagh Group joined CAP Glass in 2025 to boost cullet recovery, lowering furnace energy use. Saint-Gobain launched a hybrid furnace targeting a 75% emission cut, signalling how innovation is central to competitiveness. The FDA’s updated closure guidance tightens technical requirements, raising entry barriers and favouring incumbents with quality systems in place.
Glass Packaging Industry Leaders
-
Piramal Glass Private Limited
-
Owens-Illinois Inc.
-
Gerresheimer AG
-
Ardagh Group
-
SGD S.A. (SGD Pharma)
- *Disclaimer: Major Players sorted in no particular order
Glass Packaging Market Companies Covered in this Report
- O-I Glass Inc. (Owens-Illinois)
- Ardagh Group
- Gerresheimer AG
- Wiegand-Glas GmbH
- Piramal Glass Pvt. Ltd.
- Hindustan National Glass & Industries Ltd.
- Verallia Deutschland AG
- SGD Pharma
- WestPack LLC
- Berlin Packaging LLC
- SGD Kipfenberg GmbH
- HEINZ-GLAS GmbH & Co. KGaA
- BA Glass Germany GmbH
- AGI glaspac
- Glashütte Freital GmbH
- KP Glas GmbH & Co. KG
- San Miguel Yamamura Packaging Corporation
- Hung Phu Glass Joint Stock Company (HuphuMeglass)
- Vietnam Nashley Technology Joint Stock Company
- Feemio Group Co., Ltd.
- Pavico Packaging Company Limited
- SCHOTT Pharma (SCHOTT Group)
- Pharma-Q Holdings (Pty) Ltd.
- Nurrin Pharmalab
- Stevanato Group Spa
- Corning Incorporated
- Kapoor Glass India Pvt. Ltd.
- Neelam Global Pvt. Ltd
- Khemka Glass
- Amputech Industry
- Stevanato Group
- Hindustan Glass Works

Market Opportunities and Future Outlook
The PPWR applies from 12 August 2026, which drives standardization of labeling and packaging weight and pushes redesign, molding and compliant pack formats as brand owners and converters address sustainability and safety requirements. Evidence of market momentum includes Verallia's hybrid furnace in Zaragoza inaugurated in April 2026, aimed at lowering carbon emissions, illustrating the move from pilots to operating low-carbon melting pathways. Capacity expansion and localization investments underpin additional opportunities: in January 2026, Ciner Glass secured EUR 504 million financing for its Lommel, Belgium container-glass project intended for 1,300 tonnes per day across two furnaces; Vidrala announced a EUR 180 million modernization at its Caudete site in Spain in March 2026, including furnace refurbishment and a 10% output increase; and in North America, Coca-Cola Consolidated announced a USD 35 million investment to add a new glass bottle production line at its Indianapolis facility, with construction starting in late 2026, signaling continued pull for domestic glass packaging supply and line integration.
Recent Industry Developments in Glass Packaging Market
- June 2026: SGD Pharma announced the acquisition of Alphial, an Italian tubular glass manufacturer, expanding its European footprint in tubular glass used for pharmaceutical vials and related primary packaging. The move strengthens regional supply options for pharma-grade components amid ongoing attention on quality, consistency, and lead times in biologics and injectable packaging.
- May 2025: Ardagh Group partnered with CAP Glass to strengthen recycling infrastructure and improve cullet recovery for container glass production. Higher cullet availability supports furnace energy reduction and helps glass producers and brand owners advance circularity and carbon-reduction initiatives tied to packaging procurement.
- February 2024: The US FDA issued updated guidance on container-closure system and component changes, reinforcing expectations for change control and validation for primary packaging used with drug products. This raises the compliance bar for vial, ampoule, and closure suppliers and increases the value of documented quality systems and material-compatibility testing across pharma glass supply chains.


Glass Packaging Market Report Scope and Research Methodology
Market Definition and Coverage
This market covers glass containers used to pack and distribute products, mainly bottles, jars, and similar rigid formats supplied to end users like beverages, food, pharmaceuticals, and personal care.
Scope exclusions: We exclude bulk industrial glass items that are not used as packaging, such as architectural flat glass and automotive glazing.
Segments Covered in This Report
-
By Product Type
- Bottles and Jars
- Vials and Ampoules
- Others Product Types
-
By Color
- Flint
- Amber
- Green
- Other Colors
-
By Capacity
- Less than 200 ml
- 200-500 ml
- 500-1000 ml
- More than 1000 ml
-
By End-Use Industry
- Food
-
Beverage
-
Alcoholic Beverage
- Beer
- Wine
- Spirits
- Other Alcoholic Beverages (Cider and Other Fermented Drinks)
-
Non-Alcoholic Beverage
- Carbonated Soft Drinks
- Juices
- Dairy Product Based Drinks
- Other Non-Alcoholic Beverages
-
Alcoholic Beverage
- Pharmaceuticals
- Cosmetics and Personal Care
- Other End-Use Indusry
-
By Geography
-
North America
- United States
- Canada
- Mexico
-
Europe
- Germany
- United Kingdom
- France
- Italy
- Spain
- Russia
- Rest of Europe
-
Asia-Pacific
- China
- India
- Japan
- South Korea
- Australia and New Zealand
- Rest of Asia-Pacific
-
Middle East and Africa
-
Middle East
- United Arab Emirates
- Saudi Arabia
- Turkey
- Rest of Middle East
-
Africa
- South Africa
- Nigeria
- Egypt
- Rest of Africa
-
Middle East
-
South America
- Brazil
- Argentina
- Rest of South America
-
North America
Data Sources, Market Sizing, and Validation
Desk Research
To set the market boundaries and build the initial demand picture, we start with public, checkable data that shows glass container production and use by end market. Common references include UN Comtrade for trade flows, the World Bank for macro indicators, and statistics portals from agencies like the US Census Bureau and Eurostat for manufacturing and packaging-linked series.
We then layer in industry context from sources such as container and packaging associations, food and beverage bodies, peer-reviewed journals on packaging materials and recycling, and company annual reports and investor presentations for capacity, utilization commentary, and product mix. When needed, a paid subscription for company financials and a separate patent database are used to improve coverage of smaller entities and to validate technology shifts, for example lightweighting and returnable systems. These examples are not exhaustive, and many other public and paid sources were also checked to collect data, validate assumptions, and clarify open questions.
Primary Interviews and Surveys
Primary work focuses on conversations and surveys with glass container producers, packaging converters and distributors, and procurement or packaging leaders in beverage, food, and pharma brands. We also use these inputs to confirm how volumes split by bottle versus jar demand, what typical container weights look like, and how recycling targets and deposit rules are influencing adoption across APAC, EMEA, and the Americas.
Distribution of primary research fieldwork respondents
| Company type | Respondent position | Region |
|---|---|---|
| Top tier: 35% | CXOs: 16% | APAC: 53% |
| Mid tier: 44% | Functional/Unit leaders: 39% | EMEA: 29% |
| Smaller Players: 21% | Managers: 45% | Americas: 18% |
Market-Sizing & Forecasting
Sizing is built using a top-down, volume-led construct, where production, trade, and apparent consumption signals are used to reconstruct the demand pool for glass containers by region and end-use, and then converted into a consistent annual total. To keep it grounded, we corroborate totals with selective bottom-up approximations such as sampled supplier shipment patterns, channel checks with distributors, and an ASP proxy built from typical container weights and mix, which we then use to test whether the implied volumes look realistic.
Key inputs that materially shape the model include beverage fill volumes and mix (beer, spirits, non-alcoholic), food categories that commonly use jars, pharma container demand for vials and bottles, average container weight trends tied to lightweighting, cullet availability and recycling rates, and energy cost direction that influences production output and capacity utilization. Where a bottom-up view is incomplete for smaller markets, gaps are handled by applying validated per-capita consumption ranges and import dependence ratios, and then rechecked with interview feedback.
For forecasting, we rely on scenario analysis supported by regression-based sensitivities to end-market output, trade, and recycling policy adoption, since these variables tend to shift demand with observable lags. Assumptions are adjusted when primary respondents flag changes in refillable programs, premiumization in spirits, or pharma packaging shifts that can alter the volume mix even when total consumption is steady.
Data Validation & Update Cycle
Validation is done by comparing model outputs against independent signals such as regional container production trends, trade balances, and implied per-capita glass container use, then checking for sudden step changes that do not match known events. If a variance is material, we recheck source tables, revisit conversion factors like container weights, and re-contact relevant interviewees to confirm whether the change is structural or temporary.
Before sign-off, the model is reviewed in multiple steps so calculation logic, units, and regional totals tie out cleanly. Reports are refreshed on an annual cycle, and interim updates are triggered when major events occur, such as capacity additions, regulatory changes on deposit return schemes, or sharp energy price moves. Right before delivery, a final sweep is performed so the published view reflects the latest available data.
Mordor Intelligence's Glass Packaging Market Size Compared With Other Published Estimates
Published market values for glass packaging can look far apart because some sources measure value in USD while others report physical volumes, and because the line between packaging glass and other glass categories is not drawn the same way across publishers. Differences also come from how each publisher treats refillable loops, imports, and whether the figure is anchored to producer shipments or to end-use consumption.
In this study, the estimate is kept in volume terms and stays aligned to container demand checks like production plus net trade and end-market fill patterns, which reduces the need for broad price assumptions, a choice applied by Mordor Intelligence.
Benchmark comparison
| Source | Market Size | Gaps in Research Methodology |
|---|---|---|
| Mordor Intelligence | USD 132.06 M (2026) | |
| Global Consultancy A | USD 78.48 B (2024) | This figure is revenue-based and mixes pricing assumptions with volume, so changes in energy costs and price pass-through can shift the USD total even if tonnage is steady. |
| Industry Publisher B | USD 62.80 B (2025) | This estimate uses a value scope and longer-horizon forecasting, and it can include a wider set of glass types and application definitions, which changes what gets counted as packaging demand. |
The table shows that most of the spread is explained by unit choice and scope lines, where value-led studies move with pricing and mix, while a volume-led approach stays closer to physical consumption reality. By keeping the steps traceable to production, trade, and end-market demand indicators, the sizing remains repeatable and easier to reconcile when clients pressure-test assumptions.


Key Questions Answered in the Report
What is the current size of the glass packaging market?
The global market stands at 132.06 million tons in 2026 and is projected to reach 154.86 million tons by 2031.
Which end-use industry is growing fastest for glass containers?
Pharmaceuticals lead with a 7.11% CAGR to 2031, driven by biologics and mRNA vaccine production.
Why is the 500-1000 ml segment so important?
This capacity holds 36.10% of 2025 volume and grows at 6.52% CAGR because consumers prefer family-size packs for bulk buys.
How are glass makers reducing carbon emissions?
Key initiatives include electric or hybrid furnaces, higher recycled cullet use, and lightweight bottle designs that cut energy per unit.
Which region shows the highest growth potential?
The Middle East & Africa region is forecast to expand at 7.67% CAGR through 2031 thanks to infrastructure development and rising packaged-goods consumption.
What alternative materials pose the biggest threat to glass?
Lightweight aluminum bottles and bio-based polymers such as PLA and PEF are gaining traction, especially in cost-sensitive beverage categories.
Page last updated on:


