Israel Container Glass Market Size and Share
Market Overview
| Study Period | 2020 - 2031 |
|---|---|
| Base Year For Estimation | 2025 |
| Forecast Data Period | 2026 - 2031 |
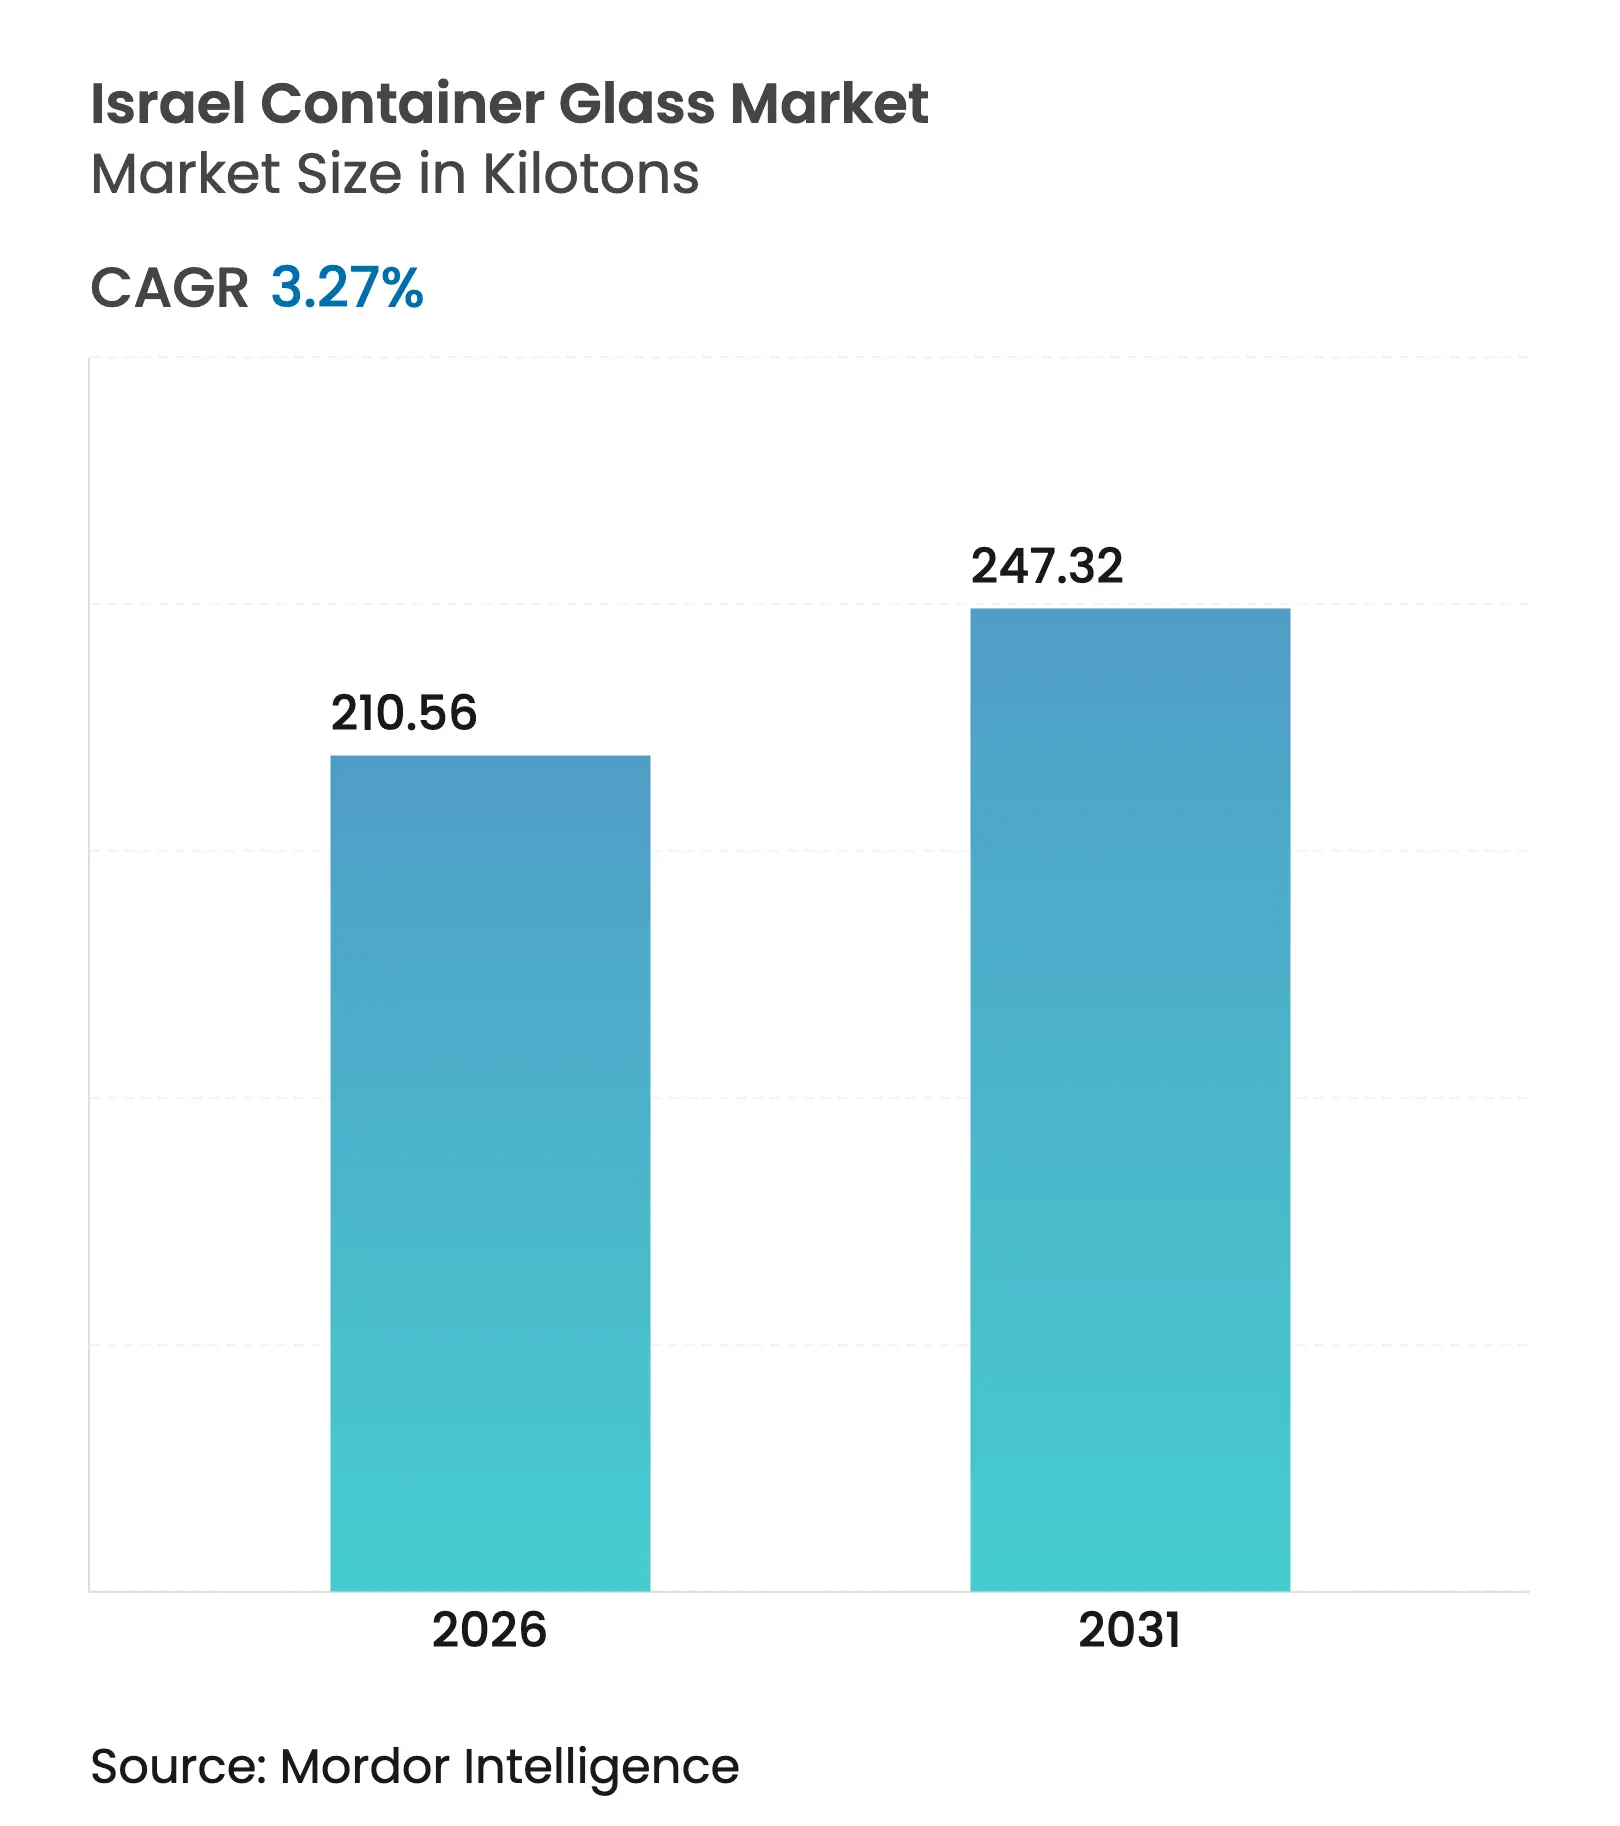
| Market Volume (2026) | 210.56 kilotons |
| Market Volume (2031) | 247.32 kilotons |
| CAGR | 3.27 % |
| Market Concentration | High |
Major Players *Disclaimer: Major Players sorted in no particular order. Image © Mordor Intelligence. Reuse requires attribution under CC BY 4.0. |
Israel Container Glass Market Analysis by Mordor Intelligence
The Israel container glass market size was valued at 203.89 kilotons in 2025 and estimated to grow from 210.56 kilotons in 2026 to reach 247.32 kilotons by 2031, at a CAGR of 3.27% during the forecast period (2026-2031). Robust recycling infrastructure, deposit-refund incentives, and premiumization across alcoholic beverages keep demand resilient even as PET substitution pressures low-margin categories.[1]T.M.I.R, “Annual Recycling Report 2024,” tmir.org.il Competitive positioning centers on circular-economy credentials, with Phoenicia Glass Works piloting carbon-capture soda-ash production and brand owners pushing for low-carbon containers to support net-zero roadmaps. Regulatory enforcement of 60% packaging recycling, combined with a 77% beverage container return rate, stabilizes the cullet supply and mitigates fluctuations in raw material costs. Meanwhile, energy-price volatility and water-scarcity constraints raise operating risks, prompting investments in hybrid furnaces, process electrification, and closed-loop cooling. Strategic opportunities, therefore, lie in specialty formats for medical cannabis, cosmetics, and craft spirits that can justify higher price points and valorize sustainability attributes within the Israel container glass market.
Key Report Takeaways
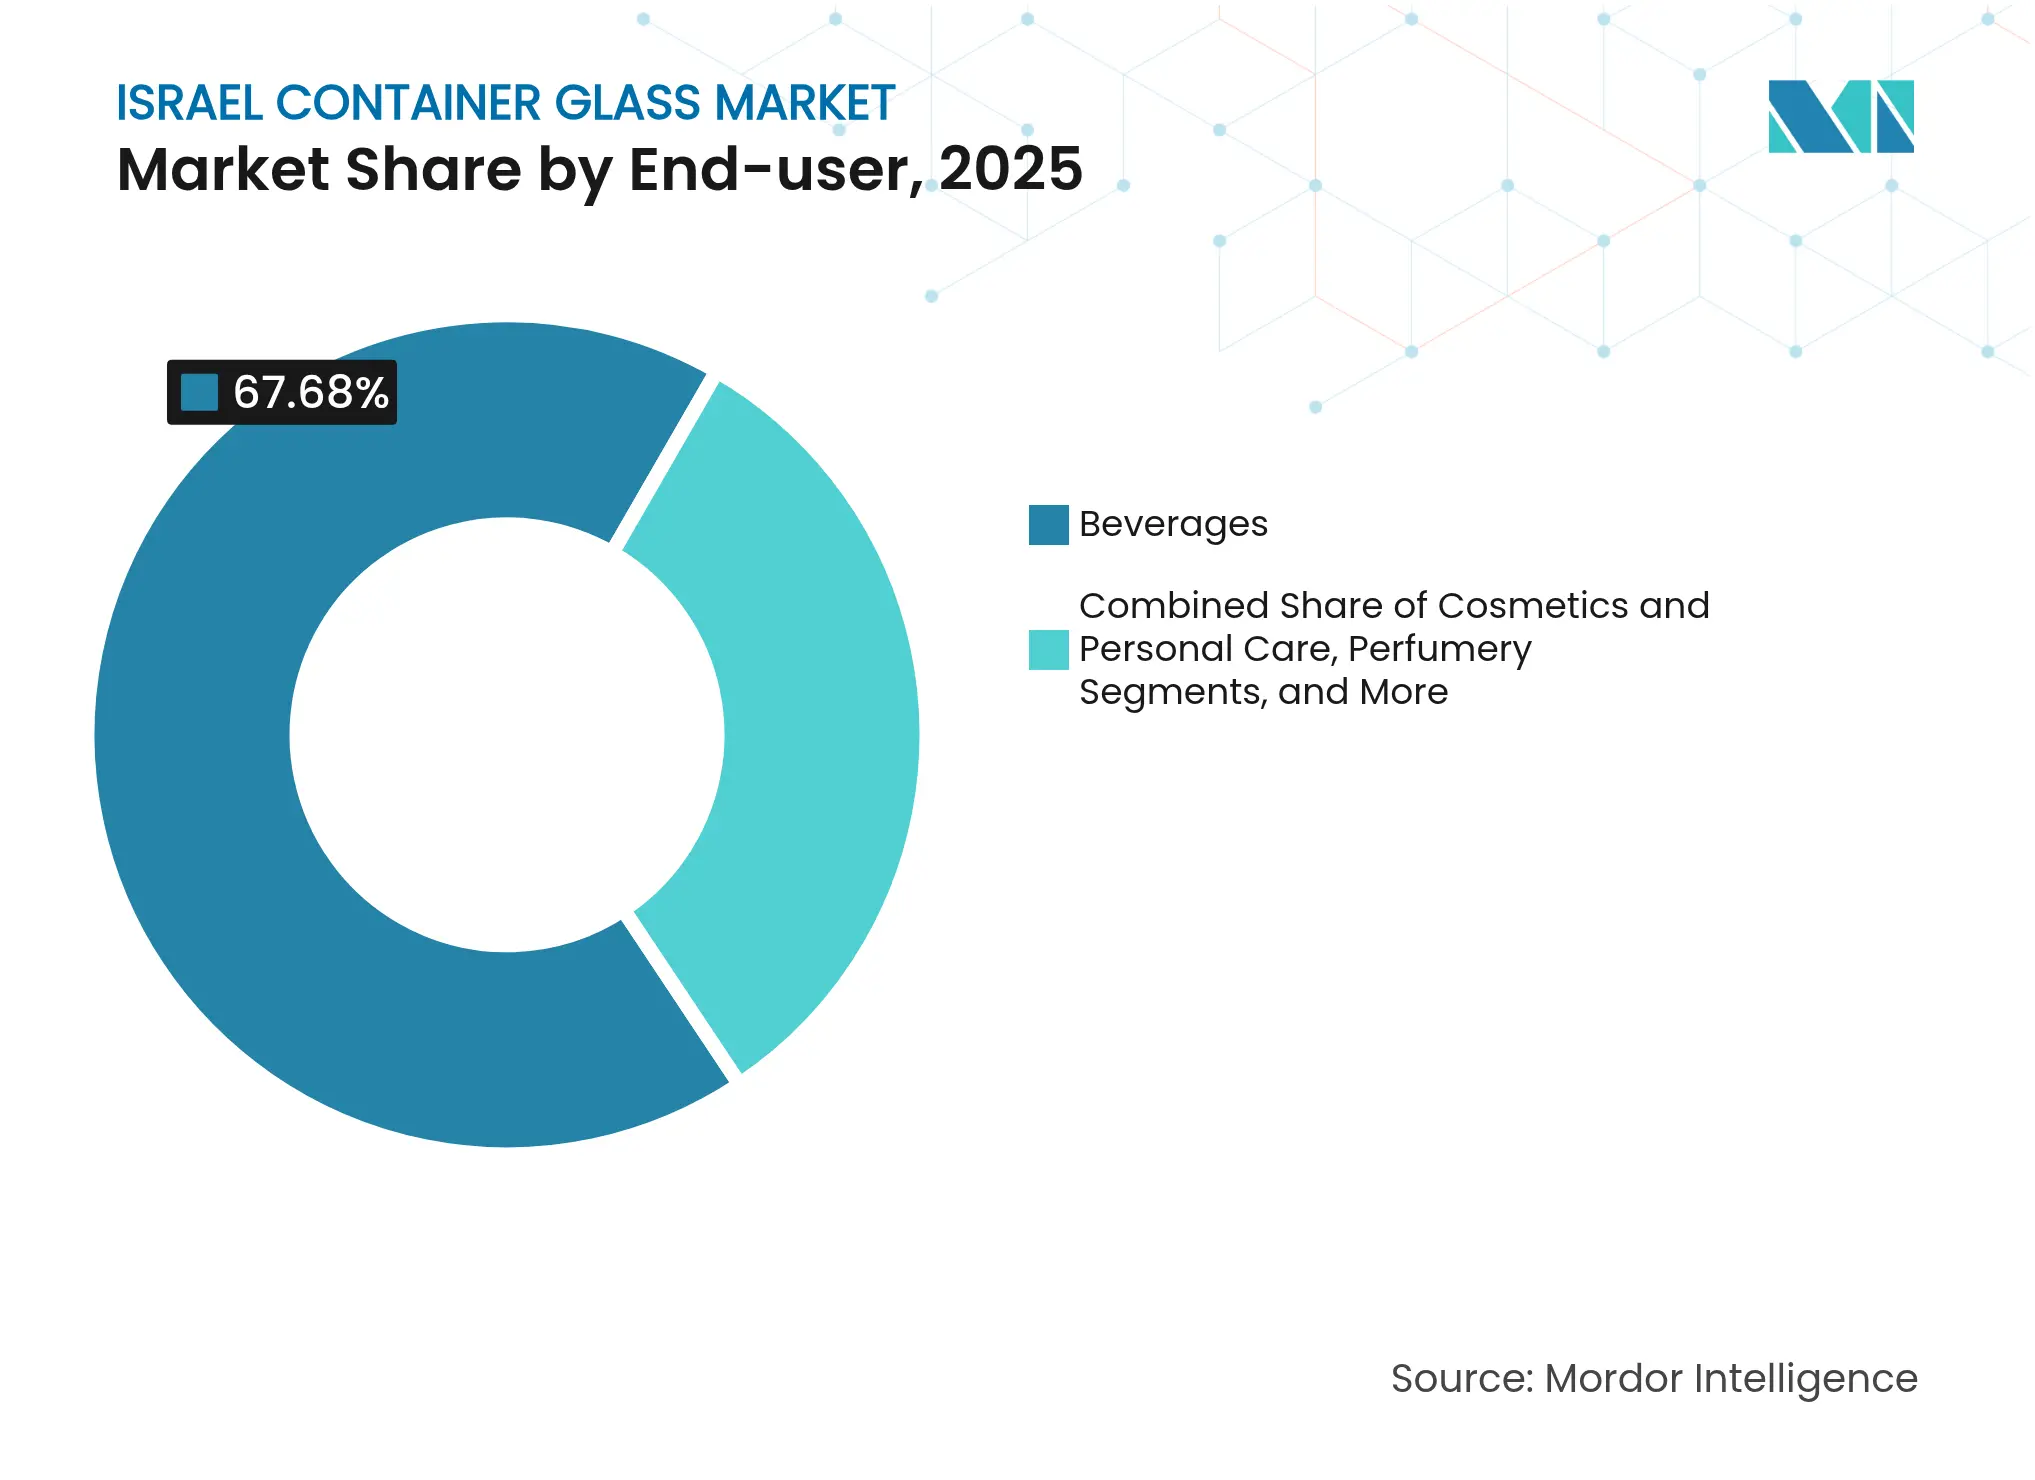
- By end-user, beverages captured 67.68% of the Israel container glass market share in 2025.
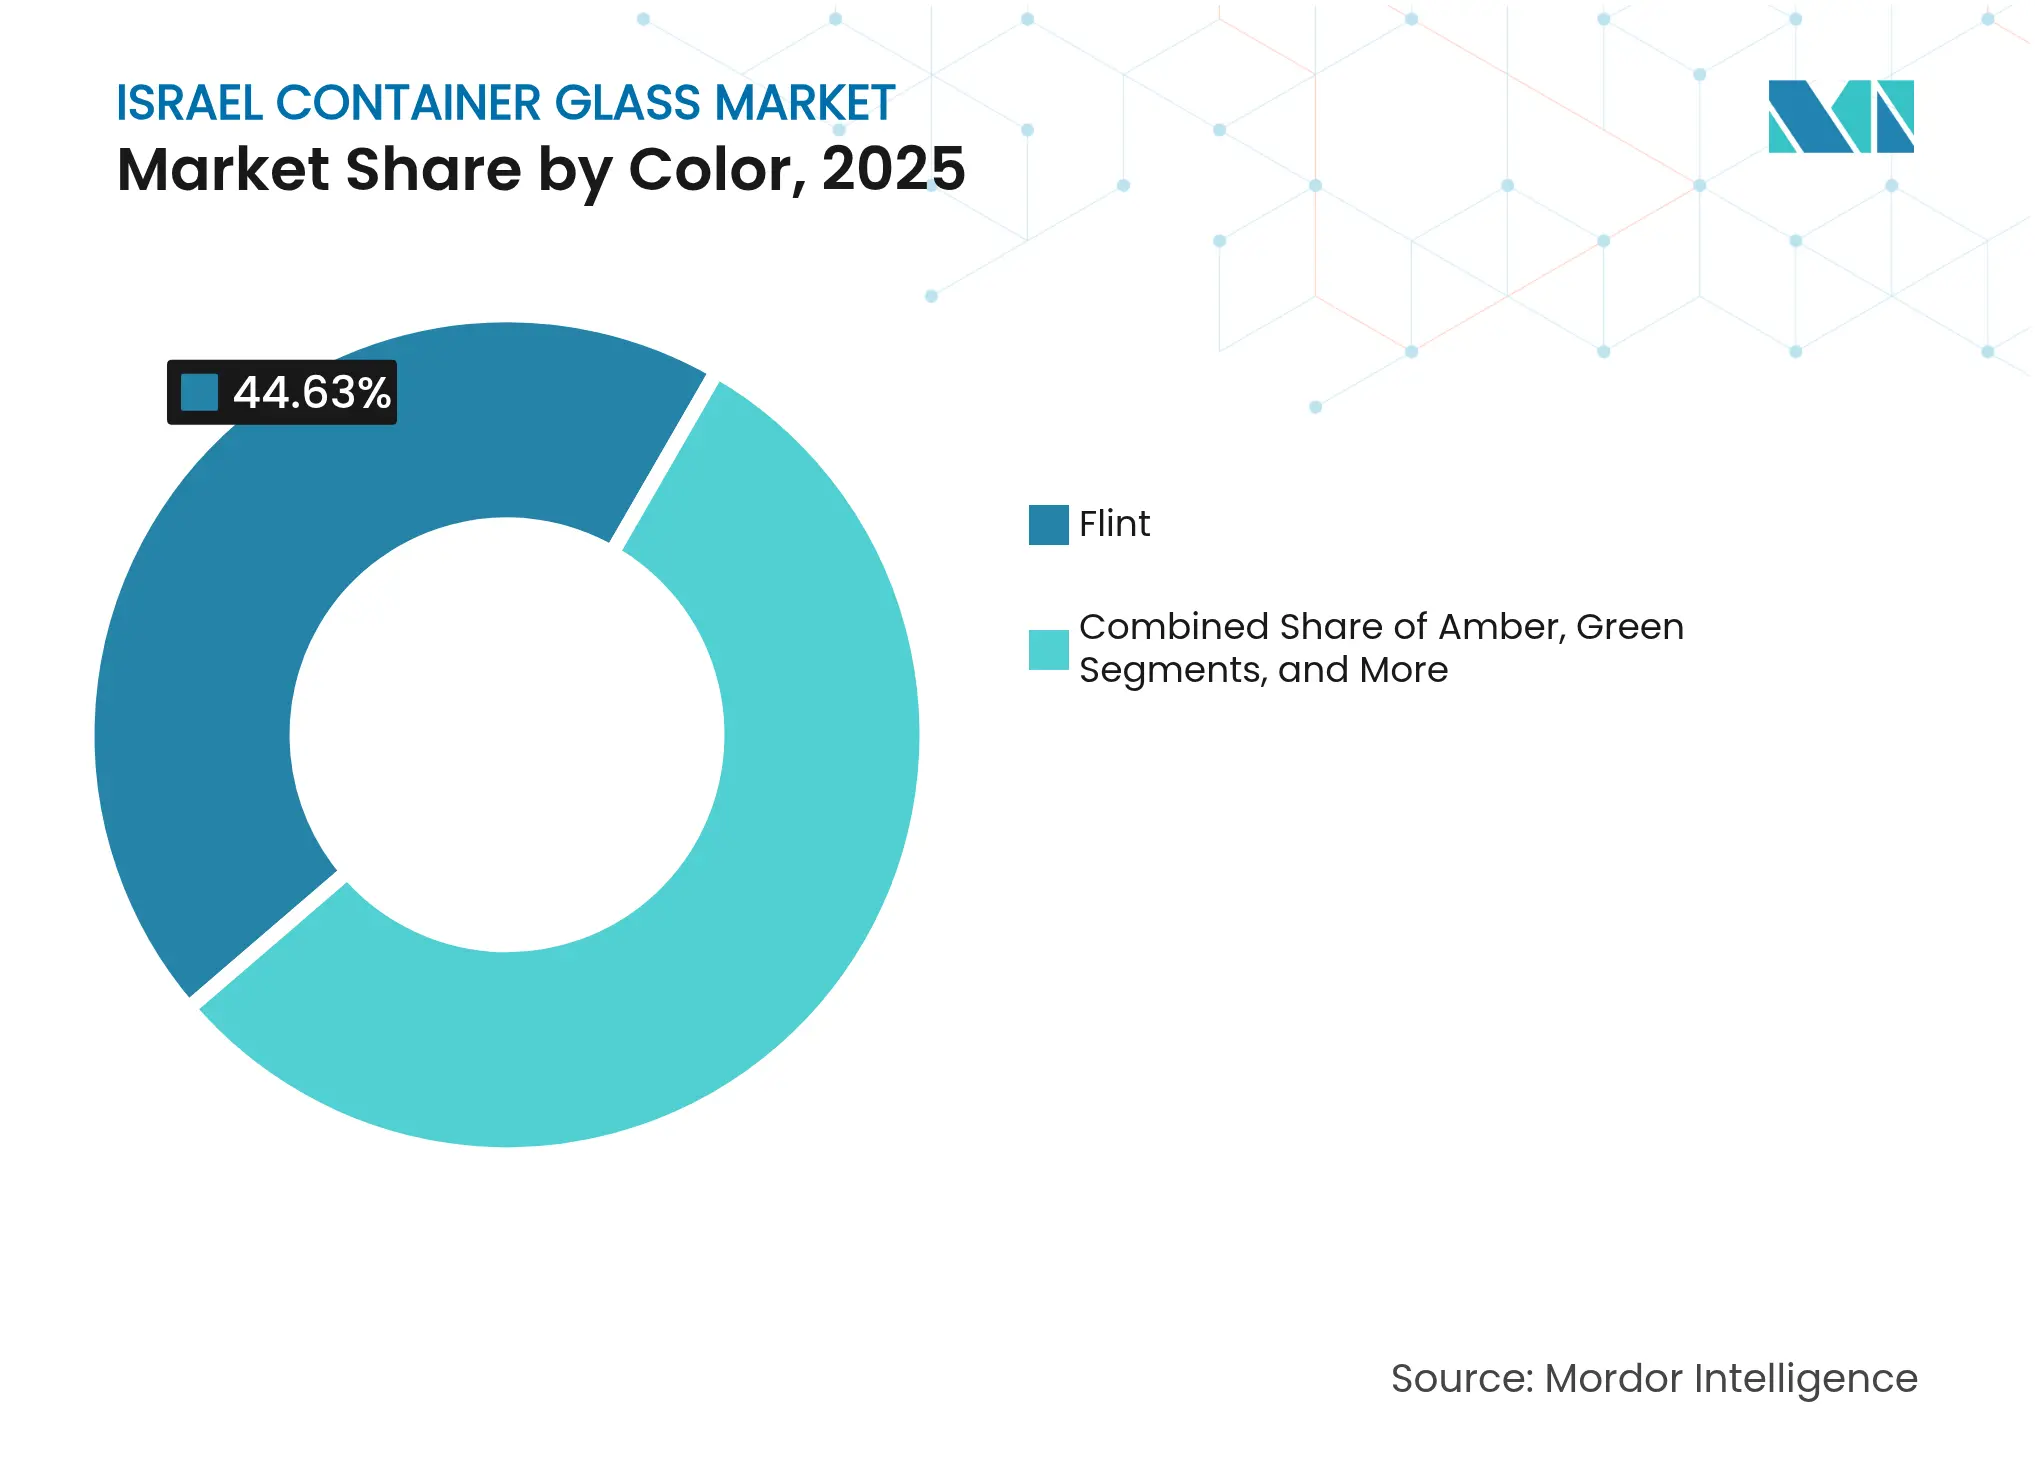
- By color, the Israel container glass market for amber glass is projected to grow at a 4.53% CAGR between 2026-2031.
Note: Market size and forecast figures in this report are generated using Mordor Intelligence's proprietary estimation framework, updated with the latest available data and insights as of 2026.
Israel Container Glass Market Trends and Insights
Drivers Impact Analysis
| Driver | (~) % Impact on CAGR Forecast | Geographic Relevance | Impact Timeline | |||
|---|---|---|---|---|---|---|
Eco-friendly packaging demand Eco-friendly packaging demand | +0.8% | Tel Aviv and Haifa metros | Medium term (2-4 years) | (~) % Impact on CAGR Forecast:+0.8% | Geographic Relevance:Tel Aviv and Haifa metros | Impact Timeline:Medium term (2-4 years) |
Domestic beer and RTD spirits boom Domestic beer and RTD spirits boom | +0.6% | National urban centers | Short term (≤ 2 years) | |||
Government recycling-target incentives Government recycling-target incentives | +0.5% | Nationwide | Long term (≥ 4 years) | |||
Medical cannabis dosage-form packaging Medical cannabis dosage-form packaging | +0.4% | Licensed cultivation zones | Medium term (2-4 years) | |||
Craft-spirits premium bottles Craft-spirits premium bottles | +0.3% | Jerusalem, Tel Aviv, Galilee | Medium term (2-4 years) | |||
Retail-recycler cullet partnerships Retail-recycler cullet partnerships | +0.2% | 140 municipalities | Long term (≥ 4 years) | |||
| Source: Mordor Intelligence | ||||||
Growing demand for eco-friendly packaging solutions
Mandatory 60% recycling targets under the Packaging Management Law elevate glass as a compliance-friendly material, strengthening procurement preferences among major food and beverage fillers. Deposit-refund logistics managed by T.M.I.R streamline take-back flows, which supply up to 30% cullet content to furnaces, thereby lowering melting energy and CO₂ intensity.[2]T.M.I.R, “Annual Recycling Report 2024,” tmir.org.il Supermarket chains in Tel Aviv and Haifa have begun implementing supplier scorecards for circularity, favoring returnable or high-recycled-content bottles. Brand owners cite positive consumer sentiment as a key factor in shifting from single-use plastics to returnable glass multipacks. As enforcement tightens, procurement teams are prioritizing vendors that certify recycled content and life-cycle CO₂ savings, thereby reinforcing volume prospects for the Israeli container glass market.
Rapid growth of domestic beer and RTD spirits segments
Urban craft breweries doubled the number of unit launches between 2023 and 2025, and ready-to-drink cocktail volumes rose 15% year-over-year as on-premise channels rebounded post-pandemic. Glass remains the default choice for premium positioning and flavor integrity, with Tempo Beverages highlighting returnable long-neck bottles in its sustainability report. Export-oriented wineries require aesthetic differentiation and oxygen-barrier performance that only glass can provide, bolstering specialized bottle runs at Phoenicia’s Yeruham plant. With tourism rebounding, driving taproom traffic, incremental demand is concentrated in 330 mL and 750 mL formats, anchoring the baseline throughput for the Israeli container glass market.
Government recycling-target incentives
Israel’s ILS 0.30 deposit on 100 mL-5 L beverage containers underpins a 77% return rate, ensuring predictable cullet inputs that cut raw-material imports and landfill fees. Municipalities deploy more than 15,000 reverse-vending drop-points, reducing collection costs for fillers. ELA Recycling secures offtake agreements with Phoenicia to guarantee feedstock quality, locking in glass packaging within high-turnover beverage SKUs. The stability of these loops supports long-term furnace investment decisions, sustaining capacity utilization across the Israeli container glass market.
Medical cannabis dosage-form packaging uptake
Israel’s regulated cannabis channel dispensed 62 metric tons of product in 2024, with oils and tinctures requiring USP Type III amber bottles that block UV and oxygen. Pharmaceutical distributors mandate child-resistant closures and micro-dose calibrations, which are feasible only with precision-molded glass vials. As export licenses increase, formulators seek suppliers that can match EU-GMP documentation, driving demand toward higher-margin pharmaceutical glass within the Israeli container glass market.
Restraints Impact Analysis
| Restraint | (~) % Impact on CAGR Forecast | Geographic Relevance | Impact Timeline | |||
|---|---|---|---|---|---|---|
PET and aluminium substitution in value lines PET and aluminium substitution in value lines | -0.7% | Mass-market beverages | Short term (≤ 2 years) | (~) % Impact on CAGR Forecast:-0.7% | Geographic Relevance:Mass-market beverages | Impact Timeline:Short term (≤ 2 years) |
Energy-price volatility for gas-fired furnaces Energy-price volatility for gas-fired furnaces | -0.5% | All plants | Medium term (2-4 years) | |||
Furnace energy-cost volatility Furnace energy-cost volatility | -0.3% | Smaller producers | Medium term (2-4 years) | |||
Cooling-water scarcity rules Cooling-water scarcity rules | -0.2% | Negev and coastal zones | Long term (≥ 4 years) | |||
| Source: Mordor Intelligence | ||||||
PET and aluminium substitution in value segments
High-speed PET filling at 32,000 bottles per hour (bph) and lightweight cans deliver cost benefits that pull low-margin soda and dairy lines away from glass. Retailers push for shelf-space density and transport savings, prompting value brands to switch to one-way plastics. Glass suppliers counter by emphasizing premium cues and carbon-neutral processes, but sustained price gaps limit recapture in commoditized categories of the Israel container glass market.
Energy-price volatility for gas-fired furnaces
Natural-gas spot rates climbed 18% in 2024, increasing batch-melt costs that account for 70% of the energy used in glass production. Phoenicia’s in-house cogeneration reduces exposure, yet smaller specialty converters face margin compression. Capital needed for electric or hybrid furnaces is high, and Israel’s grid tariffs remain above OECD average, slowing technology transitions that could stabilize operating expenses within the Israel container glass market.
Segment Analysis
By End-user: Beverages Maintain Scale while Cosmetics Accelerate
Beverages accounted for 67.68% of 2025 shipments, equivalent to 137.99 kilotons of the Israel container glass market size. Beer, wine, and RTD cocktails rely on glass for flavor stability and brand storytelling, anchoring baseline furnace loads. Non-alcoholic drinks such as juices sustain legacy volumes, although PET advances in mass channels. The Israel container glass market share for cosmetics and personal care, though under 5%, is rising at a 4.62% CAGR as premium skincare brands upscale to recyclable jars with decorative embossing. Medical cannabis oils add pharmaceutical compliance requirements, attracting premium margins that offset smaller volumes. Retailers increasingly feature refill stations for shampoos and lotions, but initial fills still ship in glass to reinforce quality cues.
Household food staples, such as jams and condiments, preserve steady but mature demand, keeping the production mix diversified. Second-generation value capture emerges in bespoke spirits bottles retailing above USD 25, where engravings and low-run designs command 20-30% price uplift. Packaging converters pivot to shorter lead times, leveraging digital decoration to align limited editions with seasonal promotions. Beverage brand owners are also trialing reusable bottle pools serviced by reverse logistics startups in Tel Aviv, potentially boosting glass trip rates and lifecycle cost competitiveness within the Israeli container glass market.
Note: Segment shares of all individual segments available upon report purchase
By Color: Flint Dominates, Amber Scales fastest
Flint claimed 44.63% of 2025 tonnage, primarily across soft drinks, beer line-extension SKUs, and gourmet condiments. Clear visibility aligns with consumer preference for product naturalness, maintaining Israel's container glass market size leadership for flint. Amber’s 4.53% CAGR reflects accelerated uptake in pharmaceuticals, premium lagers, and cannabis extracts that require UV shielding; by 2031, it is projected to approach a 29.00% unit share. Branding teams use dark tints to signify craft heritage, further propelling growth. Green remains entrenched in wine, yet wineries introduce ‘eco-flint’ bottles that utilize higher post-consumer cullet to reduce weight by 12%, challenging the historic link between varietals and bottle hue. Niche cobalt-blue and decorated pastel runs target high-margin fragrance lines and gift packs, sustaining color-mix complexity for the Israel container glass market.
Amber’s expansion increases the complexity of furnace scheduling, as color changeovers become more frequent. Phoenicia mitigates downtime via hot-top colorant dosing, reducing transition waste and reclaiming cullet streams separately. The innovation aligns with the brand's sustainability targets, amplifying customer stickiness in color-critical segments across the Israeli container glass market.
Note: Segment shares of all individual segments available upon report purchase
Geography Analysis
Production is concentrated at Phoenicia’s Yeruham facility in the Negev, supplying roughly 90% of domestic demand and feeding export lanes through Haifa port. Centralized output benefits from economies of scale but entails 180-250 km transport hauls to population centers in Tel Aviv and Haifa, accounting for 14% of the delivered cost structure. Coastal beverage fillers hedge logistics risk by holding higher safety stocks, while boutique wineries in Galilee source mixed-pallet orders directly, leveraging next-day delivery windows to maintain cellar-door inventory flexibility within the Israel container glass market.
Nationwide, more than 140 municipalities operate deposit-refund nodes that funnel cullet back to Yeruham. The closed loop supports up to 55% recycled content in standard brown beer bottles, resulting in up to 15% reduction in furnace energy consumption compared to a virgin batch. Northern demand clusters around biotech corridors in Petah Tikva and Rehovot, where pharmaceutical glass vials and ampules feed clinical trial pipelines. These medical hubs prefer regional warehousing to meet just-in-time GMP workflows, driving third-party logistics providers to establish temperature-controlled glass depots and reinforcing market density in central Israel.
Export flows reached 18% of production in 2024, shipping mainly to Mediterranean EU states that value Israel’s rapid order-to-delivery cycles and kosher-compliance documentation. Phoenicia leverages Haifa’s weekly Ro-Ro schedules to service Italian craft-beer clients within a six-day transit time, offering a lead-time advantage over Asian suppliers. Conversely, Israel imported USD 0.703 million worth of glass containers from the U.S. in 2024, primarily for specialty perfumery, indicating a white space for domestic designers to backfill ultra-premium SKUs. Water scarcity rules in the arid Negev drive investments in closed-loop cooling towers that recycle 95% of process water, cushioning operations against drought-driven permit curtailments and underscoring regional environmental stewardship in the Israel container glass market.

Competitive Landscape
Market Concentration
The Israel container glass market features moderate concentration, with Phoenicia Glass Works as the principal domestic manufacturer and a handful of niche decorators and importers filling specialty gaps. Phoenicia’s 1 million-bottle-per-day line gives it scale economy, yet capital intensity limits new entrants, keeping domestic rivalry contained. Sustainability differentiation is pivotal; Phoenicia’s 2022 partnership with Airovation converts flue-gas CO₂ into soda ash feedstock, slashing upstream raw-material purchases by 16%. This circular-carbon model secures long-term cullet-batch ratios and appeals to brand owners with science-based climate targets.
International suppliers compete in narrow segments. SCHOTT courts Israeli biotech firms with borosilicate tubing, trialing hydrogen-fired furnaces to halve Scope 1 emissions. Egyptian giant Middle East Glass expanded to 385,000 tpa and eyes kosher-certified beer bottle exports, introducing regional price pressure. Domestic converters respond by adding digital direct-print equipment from DIP-Tech, enabling 72-hour turnaround on 5,000-unit color-switch orders and unlocking artisanal spirits accounts that crave personalization.
Supply-chain risk management drives collaboration. Tempo Beverages signs a multi-year offtake agreement with Phoenicia, guaranteeing recycled-content thresholds, while Archem brokers GMP-grade amber vials to medical cannabis extractors. Financing constraints persist for furnace refurbishment amid volatile gas pricing, prompting joint applications for government green-energy grants that could subsidize hybrid electric melters, thereby influencing capacity plans within the Israeli container glass market.
Israel Container Glass Industry Leaders

*Disclaimer: Major Players sorted in no particular order
Recent Industry Developments
- March 2025: Yarden Wine Imports reported record 2024 growth with case volumes and gross sales each rising more than 40%, underscoring premium bottle demand.
- February 2025: Capsule Minimal advanced, concentrated cosmetic capsules to reduce single-use packaging, presenting future refill opportunities for glass jars.
- January 2025: Phoenicia Flat Glass Industries maintained uninterrupted float-glass exports to 30 countries, confirming operational resilience.
- September 2024: Middle East Glass consolidated shareholder stakes, becoming the Middle East’s largest glass-packaging producer at 385,000 tpa.
Table of Contents for Israel Container Glass Industry Report
1. INTRODUCTION
- 1.1Study Assumptions and Market Definition
- 1.2Scope of the Study
2. RESEARCH METHODOLOGY
3. EXECUTIVE SUMMARY
4. MARKET LANDSCAPE
- 4.1Market Overview
- 4.2Market Drivers
- 4.2.1Growing demand for eco-friendly packaging solutions
- 4.2.2Rapid growth of domestic beer and RTD spirits segments
- 4.2.3Government recycling-target incentives
- 4.2.4Medical cannabis dosage-form packaging uptake
- 4.2.5Craft-spirits premiumisation driving bespoke bottles
- 4.2.6Retail-recycler tie-ups boosting cullet availability
- 4.3Market Restraints
- 4.3.1PET and aluminium substitution in value segments
- 4.3.2Energy-price volatility for gas-fired furnaces
- 4.3.3Furnace energy-cost volatility
- 4.3.4Cooling-water scarcity regulations
- 4.4PESTEL Analysis
- 4.5Industry Supply-Chain Analysis
- 4.6Container Glass Furnace Capacity and Locations in Israel
- 4.6.1Plant Locations and Year of Commencement
- 4.6.2Production Capacities
- 4.6.3Types of Furnaces
- 4.6.4Color of Glass Produced
- 4.7Export-Import Data of Container Glass - Covering Key Import and Export Destinations
- 4.7.1Import Volume and Value, 2021-2024
- 4.7.2Export Volume and Value, 2021-2024
- 4.8Porter’s Five Forces Analysis
- 4.8.1Threat of New Entrants
- 4.8.2Bargaining Power of Suppliers
- 4.8.3Bargaining Power of Buyers
- 4.8.4Threat of Substitutes
- 4.8.5Competitive Rivalry
- 4.9Raw Material Analysis
- 4.10Recycling Trends for Glass Packaging
- 4.11Demand vs Supply Analysis for Glass Packaging
5. MARKET SIZE AND GROWTH FORECASTS (VOLUME)
- 5.1By End-user
- 5.1.1Beverages
- 5.1.1.1Alcoholic
- 5.1.1.1.1Beer
- 5.1.1.1.2Wine
- 5.1.1.1.3Spirits
- 5.1.1.1.4Other Alcoholic Beverages (Cider and Other Fermented Drinks)
- 5.1.1.2Non-Alcoholic
- 5.1.1.2.1Juices
- 5.1.1.2.2Carbonated Drinks (CSDs)
- 5.1.1.2.3Dairy Product Based Drinks
- 5.1.1.2.4Other Non-Alcoholic Beverages
- 5.1.2Food (Jam, Jelly, Marmalades, Honey, Sausages and Condiments, Oil, Pickles)
- 5.1.3Cosmetics and Personal Care
- 5.1.4Pharmaceuticals (excluding Vials and Ampoules)
- 5.1.5Perfumery
- 5.2By Color
- 5.2.1Green
- 5.2.2Amber
- 5.2.3Flint
- 5.2.4Other Colors
6. COMPETITIVE LANDSCAPE
- 6.1Market Concentration
- 6.2Strategic Moves and Developments
- 6.3Company Market Share Analysis, (Based on Latest Production Capacity)
- 6.4Company Profiles (includes Global level Overview, Market level overview, Core Segments, Financials as available, Strategic Information, Market Rank/Share for key companies, Products and Services, and Recent Developments)
- 6.4.1Feemio Group Co., Ltd.
- 6.4.2Schott Israel Ltd.
- 6.4.3Phoenicia Glass Works Ltd.
- 6.4.4Frontak Ltd.
- 6.4.5Gil Plastic Products Ltd
7. MARKET OPPORTUNITIES AND FUTURE OUTLOOK
- 7.1White-space and Unmet-Need Assessment
Israel Container Glass Market Report Scope
Glass Containers refer to clean bottles and jars made from glass. The scope excludes windows and other non-container glass products. Container glass is used in the alcoholic and non-alcoholic beverage industries due to its ability to maintain chemical inertness, sterility, and non-permeability. Glass packaging is valued for its unique properties, including its transparency, inertness, and ability to preserve the quality and integrity of its contents.
Israel container glass market is segmented by end-user vertical (beverages [alcoholic beverages (beer, wine, spirits, and other alcoholic beverages {cider and other fermented drinks}), non-alcoholic beverages (juices, carbonated drinks (CSDs), dairy product-based drinks, other non-alcoholic beverages)], food [jam, jelly, marmalades, honey, sausages and condiments, oil, pickles], cosmetics and personal care, pharmaceuticals (excluding vials and ampoules), and perfumery), by color (green, amber, flint and other colors). The report offers market forecasts and size in volume (kilotons) for all the above segments.