China Container Glass Packaging Market Size and Share
Market Overview
| Study Period | 2020 - 2031 |
|---|---|
| Forecast Data Period | 2026 - 2031 |
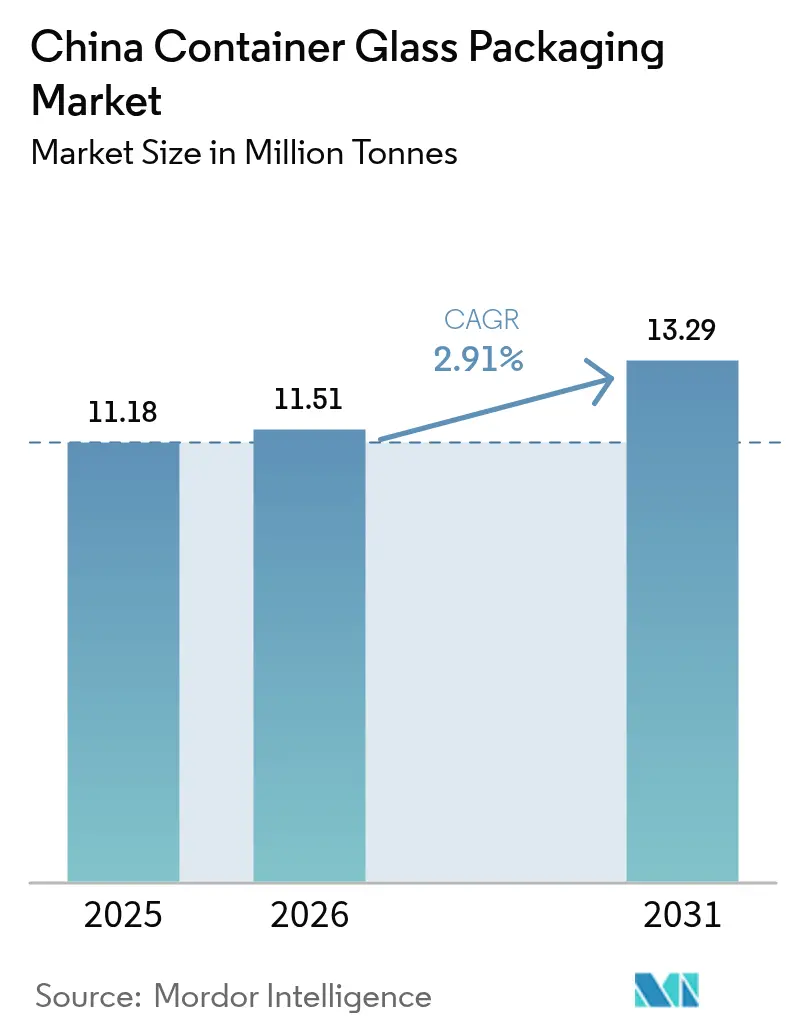
| Base Year Market Size (2025) | 11.18 Million tonnes |
| Market Volume (2026) | 11.51 Million tonnes |
| Market Volume (2031) | 13.29 Million tonnes |
| Growth Rate (2026 - 2031) | 2.91% CAGR |
| Market Concentration | Medium |
Major Players *Disclaimer: Major Players sorted in no particular order Image © Mordor Intelligence. Reuse requires attribution under CC BY 4.0. | |
China Container Glass Packaging Market Analysis by Mordor Intelligence
The China Container Glass Packaging Market size was valued at 11.18 million tonnes in 2025 and estimated to grow from 11.51 million tonnes in 2026 to reach 13.29 million tonnes by 2031, at a CAGR of 2.91% during the forecast period (2026-2031). Healthy macro-economic conditions, premiumization of beverages, and stronger sustainability mandates guide this measured trajectory. Expanding export capacity in eastern coastal provinces supports steady outbound volumes, while tier-1 city consumers accelerate trade-up behavior that lifts unit value. Cosmetics and pharmaceutical fillers favor chemically inert glass over plastic, reinforcing demand even when raw-material volatility compresses producer margins. Meanwhile, government-backed recycling programs reduce cullet shortages and improve cost structures, cushioning energy price spikes. Together, these forces keep the China glass container packaging market broadly resilient despite cyclical headwinds.
Key Report Takeaways
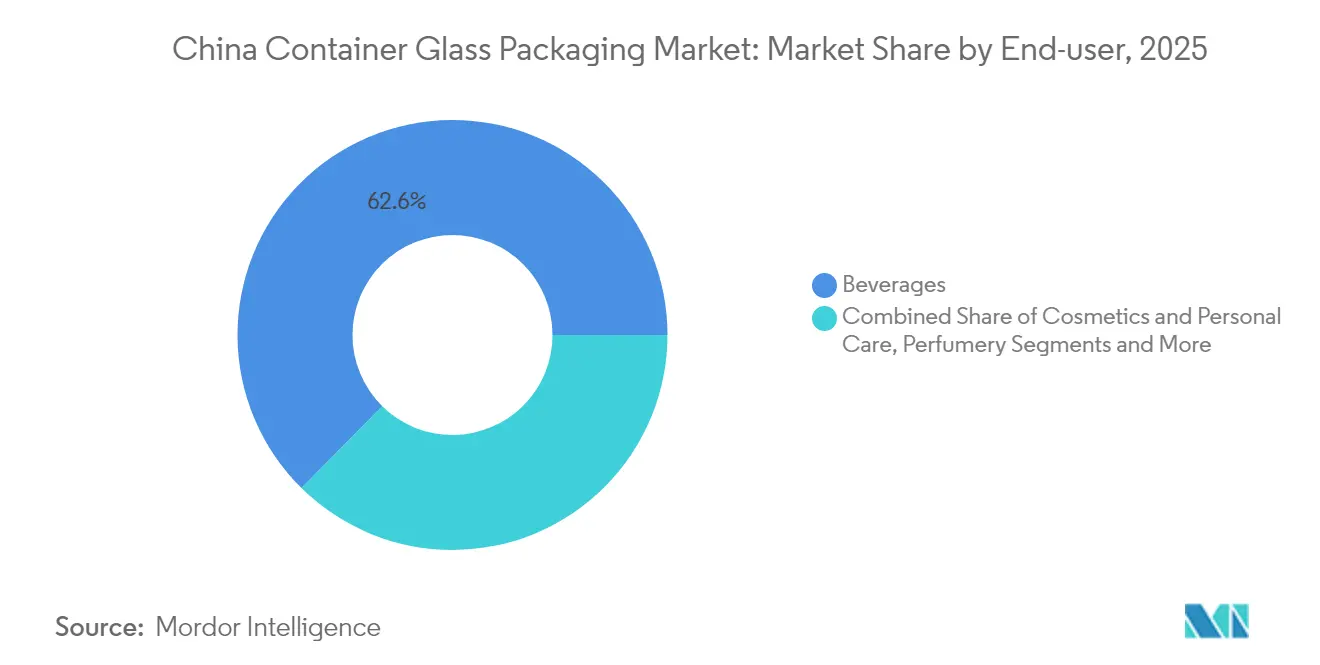
- By end-user, beverages captured 62.61% of the China glass container packaging market share in 2025.
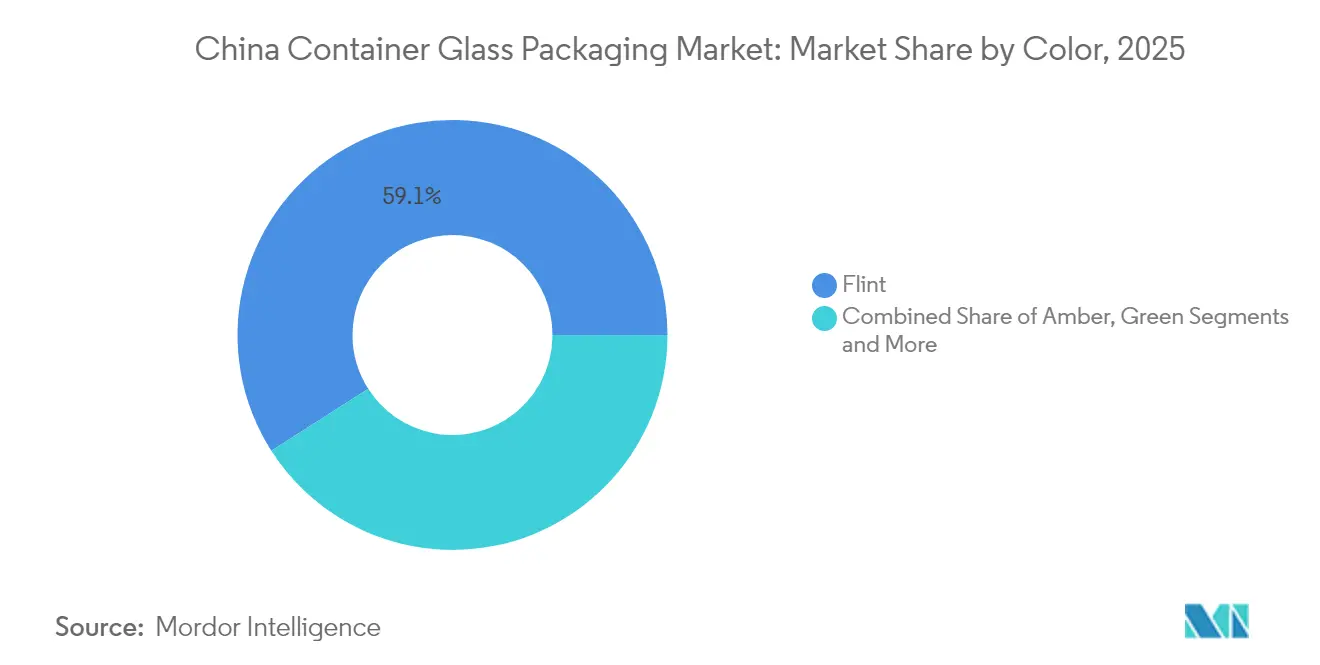
- By color, the China glass container packaging market for amber glass is projected to grow at a 3.72% CAGR between 2026-2031.
Note: Market size and forecast figures in this report are generated using Mordor Intelligence’s proprietary estimation framework, updated with the latest available data and insights as of 2026.
China Container Glass Packaging Market Trends and Insights
Drivers Impact Analysis*
| Driver | (~) % Impact on CAGR Forecast | Geographic Relevance | Impact Timeline |
|---|---|---|---|
| Surging alcoholic beverage consumption | +0.8% | National, concentrated in tier-1 and tier-2 cities | Medium term (2–4 years) |
| Booming cosmetics industry | +0.9% | National, early gains in Shanghai, Beijing, Guangzhou | Long term (≥ 4 years) |
| Sustainability push and plastic substitution | +0.7% | National, accelerated in coastal provinces | Long term (≥ 4 years) |
| Export-oriented manufacturing | +0.5% | Shandong, Jiangsu, Zhejiang | Medium term (2–4 years) |
| Technological advancements | +0.4% | Eastern manufacturing clusters | Medium term (2–4 years) |
| Pharma sector expansion | +0.6% | National, pharmaceutical hubs | Long term (≥ 4 years) |
| Source: Mordor Intelligence | |||
Surging Alcoholic Beverage Consumption Drives Glass Bottle Demand
Glass remains the vessel of choice for premium beer, wine, and baijiu, giving producers a trusted barrier that protects volatile flavors while signaling heritage to consumers. The easing of anti-corruption measures in late 2024 revived banquet occasions, restoring volumes for mid-range spirits. Craft breweries scaled nationwide distribution, relying on returnable 500 ml flint bottles that slot neatly into urban recycling loops. Export-oriented distillers shipped nostalgia-tinted clear baijiu bottles to overseas Chinese communities, bolstering the China glass container packaging market in coastal factories. Government modernization guidelines for the alcohol sector explicitly reference recyclable glass adoption, further entrenching the material in premium positioning.
Booming Cosmetics Industry Fuels Premium Glass Packaging Adoption
Domestic beauty labels pivoted to heavy-walled, colored glass jars that mimic foreign luxury aesthetics, a strategy that lifted unit prices and brand equity simultaneously. Regulations enacted by the National Medical Products Administration classify glass as an inert, refill-ready option for active-rich serums, an attribute that resonates with Gen-Z shoppers. Direct-to-consumer e-commerce lets small brands justify glass’s weight premium through sustainability storytelling. Specialized furnaces in Jiangsu switched to double-gob feeders to handle miniature 15 ml droppers efficiently, expanding the China glass container packaging market footprint in this high-margin niche. Continuous demand helps offset raw-material cost swings, boosting investment in cosmetic-grade annealing lines.
Sustainability Push and Plastic Substitution Favor Glass
China’s circular-economy agenda prioritizes infinitely recyclable materials, elevating glass above single-use polymers.[1]National Development and Reform Commission, “Circular Economy Development Plan,” NDRC.GOV.CN Urban recycling pilots in Shanghai and Guangzhou lifted cullet yields to 45% of furnace input by mid-2025, lowering soda-ash requirements and cutting emissions. Brands in sauces, juices, and dairy roll out “return-for-refund” schemes that hinge on glass’s reusability advantage. Extended Producer Responsibility rules effective 2025 penalize virgin-plastic dependence, nudging fillers toward glass upgrades. These parallel measures create a durable demand tailwind that shores up the Chinese glass container packaging market during commodity down-cycles.
Export-Oriented Manufacturing Strengthens Global Supply Role
Dense manufacturing clusters in Shandong leverage integrated soda-ash supply and port access to ship flint wine bottles to Australia and ASEAN, filling gaps left by Europe’s energy-constrained furnaces. Although the United States imposed antidumping duties on certain wine bottles in July 2024, producers swiftly re-tooled molds for ASEAN-specified finishes, preserving kiln utilization at 88%. The Belt and Road Initiative adds Bahar port calls that shorten transit to Middle-East fill lines, further entrenching China’s export competitiveness. As foreign customers demand color stability and dimensional accuracy, Chinese firms invest in servo-driven IS machines, bolstering technological parity with European peers.
Restraints Impact Analysis*
| Restraint | (~) % Impact on CAGR Forecast | Geographic Relevance | Impact Timeline |
|---|---|---|---|
| Soda ash and silica price volatility | -0.6% | National | Short term (≤ 2 years) |
| Breakage risks and high transport costs | -0.4% | National, especially long-haul freight | Medium term (2–4 years) |
| Plastic and flexible packaging competition | -0.5% | National, cost-sensitive categories | Long term (≥ 4 years) |
| Energy-intensive melting and carbon exposure | -0.7% | High-energy-cost provinces | Long term (≥ 4 years) |
| Source: Mordor Intelligence | |||
Soda Ash and Silica Price Volatility Squeezes Margins
Spot soda-ash benchmarks jumped from CNY 2,100 to CNY 2,740 per ton between February and May 2024 after stricter pollutant-emission audits idled two major trona-based plants. The price shock lifted raw-material cost share to 43% of ex-factory bottle value, crimping EBITDA for sub-scale furnaces. Producers with short hedges faced cash-flow strain, prompting temporary line stoppages in Henan. Silica-sand grades above SiO₂ 99.8% grew scarce following tighter mining permits, adding further procurement risk. Scale players with in-house quarries weathered the turbulence better, underlining the growing consolidation theme in the China glass container packaging market.
Energy-Intensive Melting Raises Carbon Exposure and Cost Risk
Oxy-fuel furnaces consume 20% less natural gas yet require capital outlays beyond the reach of many family-owned plants. As China’s national ETS phases in glass from 2026, carbon liabilities could add USD 16 per ton to operating costs under current allowance forecasts. Early movers such as Shandong Pharmaceutical Glass installed electric melters that slash CO₂ by 55% and unlock green-procurement premiums from pharma customers. Provincial subsidy disparities, however, risk widening competitiveness gaps across the China glass container packaging market.
*Our forecasts treat driver/restraint impacts as directional, not additive. The impact forecasts reflect baseline growth, mix effects, and variable interactions.
Segment Analysis
By End-user: Beverages Lead Volume, Cosmetics Drive Premium Growth
The beverages segment held 62.61% of the China glass container packaging market size in 2025, translating into roughly 7,000 kilotons of output. Beer, wine, and baijiu account for the bulk, while iced coffee and kombucha led premium non-alcoholic gains. Spirits suppliers pivoted to embossed flint decanters that command double-digit price uplifts, sustaining revenue momentum even as tonnage stabilizes. The Chinese glass container packaging market benefits when breweries cycle seasonal limited editions, raising SKU counts and mold complexity across the IS fleet.
Cosmetics and personal care recorded a 3.49% CAGR outlook, the fastest among end-users, yet delivered only 435 kilotons in 2025, highlighting sizable room for expansion. Serums, essential-oil droppers, and prestige skincare jars adopt glass to convey purity, pushing average unit prices to USD 0.24, versus USD 0.05 in beverages. Glass offers flawless barrier properties that preserve volatile actives, while thick bases lend tactile luxury. Refill station pilots in flagship stores encourage consumer return habits, embedding circularity in brand value propositions and boosting repeat bottle demand. These dynamics underline why the China glass container packaging market continues moving up the value pyramid.


By Color: Flint Dominates, Amber Accelerates in Specialty Applications
The flint segment captured 59.05% of the Chinese glass container packaging market share in 2025, equivalent to 6,600 kilotons. Universal compatibility with automated inspection and colorless aesthetics drives adoption across food condiments, cooking wine, and beverage lines. Advanced NNPB technology yields weight savings between 10–15%, mitigating transport penalties and enabling lighter crates. Seamless furnace changeovers keep line downtime minimal, reinforcing Flint’s operational appeal in the Chinese glass container packaging market.
Amber glass posted the highest growth at a 3.72% CAGR and supplied 1,890 kilotons in 2025. Pharmaceutical vials, cough-syrup bottles, and ultraviolet-sensitive cosmetics choose amber for its 380-450 nm light-blocking capacity. The National Medical Products Administration updated the pharmacopeia in 2024 to recommend Type III amber glass for photolabile injectables, locking in regulatory pull-through. Color control demands tighter batch chemistry and furnace parameter discipline, a hurdle that raises switching costs and consolidates share with technically advanced producers. As biotech pipelines scale, amber volumes could exceed 2,260 kilotons by 2031, reinforcing the high-margin tier of the China glass container packaging market.
Geography Analysis
Eastern seaboard provinces dominated 2025 production, pooling 78% of installed melting capacity thanks to proximity to high-grade silica sand quarries and ports. Shandong alone produced 3,230 kilotons, leveraging vertically integrated factories adjacent to soda-ash suppliers. Jiangsu followed with 1,585 kilotons, specializing in cosmetic and pharma ware with higher trimming precision, while Zhejiang focused on export-grade beverage bottles. This coastal concentration reflects legacy investment patterns and supports efficient outbound logistics to ASEAN and Europe.
Tier-1 cities Beijing, Shanghai, and Guangzhou absorbed 37% of 2025 domestic glass container demand. Their consumers prioritize premium positioning and environmental responsibility, tilting share toward thick-base flint and colored cosmetic jars. Retailers in these cities piloted bottle-return kiosks connected to reverse-vending machines that sort by color, funneling cullet back to nearby plants. Rising living standards in Chengdu, Wuhan, and Xi’an propelled tier-2 consumption, narrowing the per-capita gap with coastal peers and enlarging the China glass container packaging market footprint inland.
Western provinces remain sub-scale producers, constrained by high freight costs on cullet and soda ash. Nevertheless, policy incentives linked to the Belt and Road Initiative improve transport corridors, encouraging exploratory investments in Chongqing and Xinjiang that may diversify geographic supply. Should renewable-energy pricing in the northwest undercut coastal tariffs by 2027, electric furnace deployment could shift some volume inland, tempering regional disparities within the China glass container packaging market.
Competitive Landscape
Moderate fragmentation persists, with roughly 150 measurable plants operating across China in 2025. The top five vendors combined for an estimated 38% shipment share, signaling room for consolidation. Large incumbents exploit scale, captive raw-material access, and automotive IS machines to maintain cost leadership. Gerresheimer’s Suzhou site, for instance, runs four high-speed lines dedicated to Type I borosilicate vials, courting pharma clients that prize traceability.
Domestic champions such as Shandong Pharmaceutical Glass and Xinzhuang Glass emphasize vertical integration owning cullet yards, mining silica, and forging close links with downstream fillers.[3]Shandong Pharmaceutical Glass Co., “Technology Upgrade Announcement,” SHANDONGPHARMGLASS.COM Smaller regionals counterbalance by specializing in custom molds, hand-decorated flacons, or limited-batch color mixes that large players overlook. Environmental compliance escalates capital intensity, nudging undersized furnaces toward M&A or exit. In 2024 alone, six furnaces below 100 TPD shuttered due to unmet NOx abatement deadlines, reinforcing consolidation signals within the China glass container packaging market.
Strategic moves center on energy efficiency and digitalization. Companies deploy hot-end cameras, servo pusher systems, and predictive-maintenance analytics to lift pack-to-melt yields above 88%. Joint-venture models pairing domestic land banks with foreign pharma expertise surface in Henan and Shanxi, promising technology spill-overs that elevate local quality norms. The competitive narrative increasingly rewards ESG compliance, with buyers issuing scorecards that prefer suppliers running electric or oxy-fuel melters.
China Container Glass Packaging Industry Leaders
Gerresheimer Shuangfeng Pharmaceutical Glass (Danyang) Co. Ltd.
Danfa Glass Limited
Hualian Glass Manufacturers Co., Ltd
Feemio Packaging Co., Ltd.
Ningbo Zhengli Pharmaceutical Packaging Co., Ltd.
- *Disclaimer: Major Players sorted in no particular order

Recent Industry Developments
- August 2024: Gerresheimer announced a production hall expansion for drug-delivery vials in Suzhou, increasing capacity by 150 million units annually.
- July 2024: The United States applied antidumping duties on Chinese wine bottles, prompting exporters to pivot toward ASEAN routes
- July 2024: The Ministry of Ecology and Environment released updated EPR rules mandating higher recycled-content thresholds for packaging
- June 2024: Cosmetic-glass specialists in Jiangsu announced two new 120 TPD furnaces dedicated to colored flacons.


China Container Glass Packaging Market Report Scope
Container glass is used in the alcoholic and non-alcoholic beverage industries due to its ability to maintain chemical inertness, sterility, and non-permeability. Glass packaging is valued for its unique properties, including its transparency, inertness, and ability to preserve the quality and integrity of its contents. It is often chosen for products where purity, safety, and environmental sustainability are paramount concerns.
The China container glass packaging market is segmented by end-user vertical (beverages [alcoholic beverages (beer, wine, spirits, and other alcoholic beverages {cider and other fermented drinks}), non-alcoholic beverages (juices, carbonated drinks (CSDs), dairy product-based drinks, other non-alcoholic beverages)], food [jam, jelly, marmalades, honey, sausages and condiments, oil, pickles], cosmetics and personal care, pharmaceuticals (excluding vials and ampoules), and perfumery, and by color (green, amber, flint and other colors). The report offers market forecasts and size in volume (kilotons) for all the above segments.
| Beverages | Alcoholic | Beer |
| Wine | ||
| Spirits | ||
| Other Alcoholic Beverages (Cider and Other Fermented Drinks) | ||
| Non-Alcoholic | Juices | |
| Carbonated Drinks (CSDs) | ||
| Dairy Product Based Drinks | ||
| Other Non-Alcoholic Beverages | ||
| Food (Jam, Jelly, Marmalades, Honey, Sausages and Condiments, Oil, Pickles) | ||
| Cosmetics and Personal Care | ||
| Pharmaceuticals (excluding Vials and Ampoules) | ||
| Perfumery | ||
| Green |
| Amber |
| Flint |
| Other Colors |
| By End-user | Beverages | Alcoholic | Beer |
| Wine | |||
| Spirits | |||
| Other Alcoholic Beverages (Cider and Other Fermented Drinks) | |||
| Non-Alcoholic | Juices | ||
| Carbonated Drinks (CSDs) | |||
| Dairy Product Based Drinks | |||
| Other Non-Alcoholic Beverages | |||
| Food (Jam, Jelly, Marmalades, Honey, Sausages and Condiments, Oil, Pickles) | |||
| Cosmetics and Personal Care | |||
| Pharmaceuticals (excluding Vials and Ampoules) | |||
| Perfumery | |||
| By Color | Green | ||
| Amber | |||
| Flint | |||
| Other Colors | |||


Key Questions Answered in the Report
How large is the China container llass packaging market in 2026?
The market reached 11.51 million tonnes in 2026 and is forecast to grow at a 2.91% CAGR through 2031.
Which end-user currently dominates glass container demand?
Beverages command 62.61% share, with premium beer, wine, and spirits driving most of the volume.
What is the fastest-growing application area for glass packaging?
Cosmetics and personal care is projected to expand at a 3.49% CAGR thanks to premiumization and sustainability trends.
Why is amber glass gaining traction?
Amber blocks UV light, making it ideal for pharmaceuticals and active-rich cosmetics that are sensitive to photodegradation.
How are rising raw-material costs affecting producers?
Soda-ash and silica volatility has lifted raw-material cost share above 40%, squeezing margins for smaller furnaces without hedging strategies.
Page last updated on:


