New Zealand Mobile Virtual Network Operator (MVNO) Market Size and Share
Market Overview
| Study Period | 2019 - 2030 |
|---|---|
| Forecast Data Period | 2025 - 2030 |
| Historical Data Period | 2019 - 2023 |
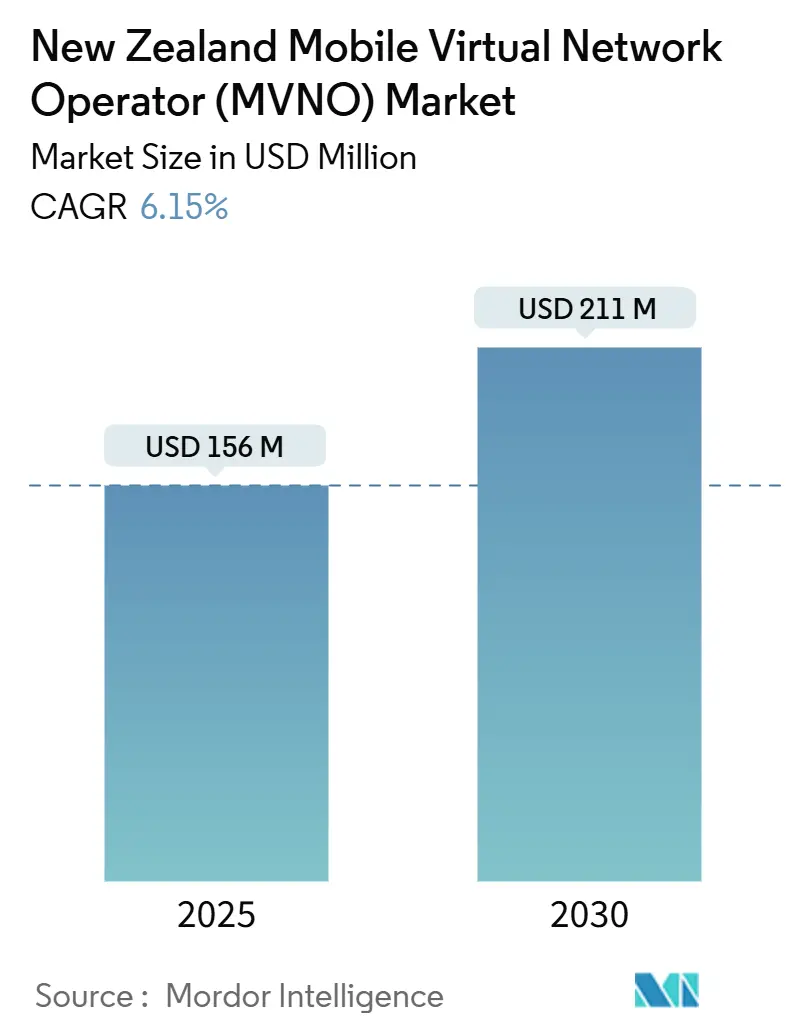
| Market Size (2025) | USD 156 Million |
| Market Size (2030) | USD 211 Million |
| Growth Rate (2025 - 2030) | 6.15% CAGR |
| Market Concentration | Medium |
Major Players
*Disclaimer: Major Players sorted in no particular order Image © Mordor Intelligence. Reuse requires attribution under CC BY 4.0. |
|
New Zealand Mobile Virtual Network Operator (MVNO) Market Analysis by Mordor Intelligence
The New Zealand Mobile Virtual Network Operator Market size is estimated at USD 156 million in 2025, and is expected to reach USD 211 million by 2030, at a CAGR of 6.15% during the forecast period (2025-2030). In terms of subscriber volume, the market is expected to grow from 231.19 thousand subscriber in 2025 to 289.90 thousand subscriber by 2030, at a CAGR of 4.63% during the forecast period (2025-2030).
Structural constraints keep MVNO penetration close to 1% of total mobile subscribers, far below benchmarks such as the United Kingdom’s 16% share. The concentrated presence of Spark, One NZ and 2degrees, which together serve more than 98% of mobile connections, sustains high wholesale prices and limits pricing headroom for alternative providers. At the same time, Commerce Commission wholesale-access reforms, One NZ’s satellite direct-to-device launch with Starlink, and a growing price-sensitive consumer segment encourage renewed MVNO entry. Cloud-based deployment, eSIM adoption, and 5G network-slicing APIs lower the cost and time to launch, allowing digital-only sub-brands to reach national scale quickly. Energy retailers bundling mobile plans with electricity supply further diversify distribution strategies, signaling convergence across utilities and connectivity services.
Key Report Takeaways
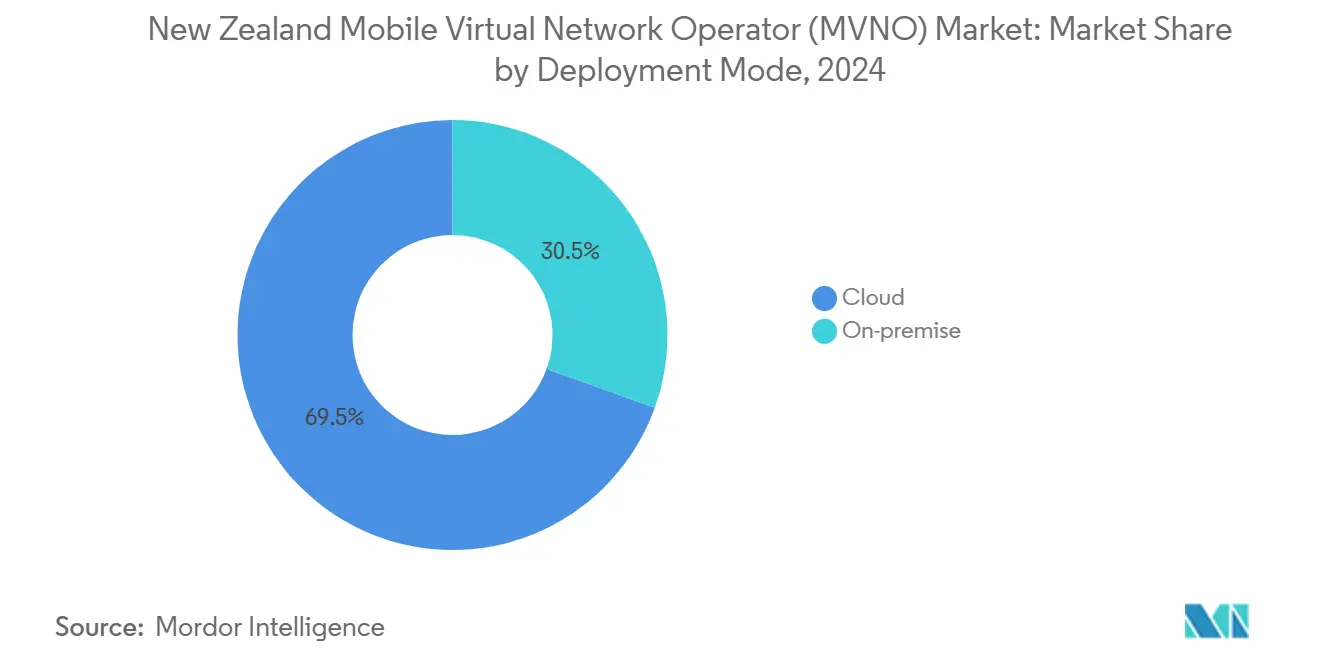
- By deployment model, cloud-based solutions held 69.51% share of the New Zealand MVNO market in 2024, while the same segment is forecast to advance at a 9.77% CAGR through 2030.
- By operational mode, resellers and light MVNOs retained 59.87% of the New Zealand MVNO market share in 2024, whereas full MVNOs are set to expand at 20.48% CAGR to 2030.
- By subscriber type, consumer accounts controlled 81.88% share of the New Zealand MVNO market in 2024; IoT-specific connections are projected to rise at 27.74% CAGR between 2025 and 2030.
- By application, discount plans captured 43.88% of the New Zealand MVNO market size in 2024, while cellular M2M applications are predicted to grow at 27.19% CAGR to 2030.
- By network technology, 4G/LTE held 71.12% of the New Zealand MVNO market share in 2024, yet satellite/NTN connectivity is poised for 40.06% CAGR through 2030.
- By distribution channel, digital-only channels accounted for 55.91% of the New Zealand MVNO market size in 2024 and are expected to progress at 9.88% CAGR over the forecast window.
New Zealand Mobile Virtual Network Operator (MVNO) Market Trends and Insights
Drivers Impact Analysis*
| Driver | (~) % Impact on CAGR Forecast | Geographic Relevance | Impact Timeline |
|---|---|---|---|
| Intensifying price-sensitive consumer segment post-COVID | +1.2% | Urban centers | Short term (≤ 2 years) |
| Wholesale access reforms (2023 Commerce Commission review) | +1.8% | National | Medium term (2-4 years) |
| 5G network-slicing APIs for digital-only brands | +0.9% | Urban then regional | Medium term (2-4 years) |
| eSIM-enabled friction-less churn and multi-SIM usage | +0.7% | National | Short term (≤ 2 years) |
| Retail-energy bundling by Contact, Mercury and Nova | +0.6% | National | Medium term (2-4 years) |
| Satellite/NTN trials for rural coverage parity | +0.3% | Rural areas | Long term (≥ 4 years) |
| Source: Mordor Intelligence | |||
Intensifying Price-Sensitive Consumer Segment Post-COVID Cost-of-Living Squeeze
New Zealand mobile data prices remain among the highest in the OECD, with 4–5 GB plans averaging NZD 40 while comparable Australian offers deliver 37–60 GB at similar rates. Consumers facing inflationary pressure have become more price-focused, seeking lower-cost alternatives for basic connectivity. MVNOs such as Rocket Mobile responded by introducing unlimited plans beginning at NZD 30 per month with managed speed tiers, undercutting entry-level incumbent tariffs. Commerce Commission surveys continue to list mobile value dissatisfaction among the top consumer complaints. Combined, these factors create a fertile environment for discount-oriented MVNO propositions targeting urban millennials and families. As cost consciousness persists, operators leveraging lean digital distribution and cloud billing achieve scalable economics while sustaining aggressive pricing.
Wholesale Access Reforms (2023 Commerce Commission MVNO Review) Accelerating Onboarding
In late 2023 the Commerce Commission completed an MVNO market study recommending greater transparency in wholesale terms, retention of mobile roaming regulation and fresh scrutiny of mobile termination rates. The regulator’s stance has prompted incumbent networks to publish simplified reference offers and cut onboarding lead times, reducing barriers to entry for new brands. International precedents such as Canada’s mandated MVNO access framework illustrate potential regulatory pathways that foster service-based competition. Improved wholesale certainty encourages entrepreneurial activity; One NZ’s July 2025 agreement with Advantai offers an API-rich onboarding environment that supports multiple MVNO launches per year. Over the medium term these reforms could lift the effective share ceiling beyond the entrenched 1% mark and expand the total addressable base for niche propositions.
5G Network-Slicing APIs Enabling Differentiated Digital-Only Sub-Brands
Ookla’s H1 2024 benchmarks show 2degrees delivering 90.1% mobile consistency and One NZ leading mobile gaming latency at 80.55 points. MVNOs can now request performance-oriented slices that match these scorecards, bundling premium data tiers for gamers, video streamers or enterprise field teams without owning spectrum. One NZ has opened network-slicing APIs through its developer portal, letting brands experiment with quality-of-service profiles during trial periods. This capability breaks the traditional discount-only perception of MVNOs, enabling differentiated offers priced on performance rather than volume. As 5G standalone coverage spreads to secondary cities, digital-only sub-brands can target high-value micro-segments while still leveraging automated provisioning and cloud billing for cost control.
eSIM Adoption Driving Friction-Less Churn and Multi-SIM Usage
eSIM removes the logistical friction of physical SIM distribution, allowing QR-code activation in minutes through self-care apps. International case studies indicate that operators supporting fully digital onboarding record 30–40% lower acquisition costs and higher trial conversions. In New Zealand, Kogan Mobile’s lack of eSIM support was called out by technophile forums as a competitive gap in June 2024. Early adopters in Auckland and Wellington are increasingly relying on dual-profile smartphones to manage roaming or secondary data lines, a behavior MVNOs can exploit by positioning low-commitment data bundles. As device ecosystems fully transition to embedded SIMs by 2026, digital-first MVNOs that integrate automated eSIM activation will gain acquisition speed advantages over legacy carriers that still rely on retail SIM distribution.
Restraints Impact Analysis*
| Restraint | (~) % Impact on CAGR Forecast | Geographic Relevance | Impact Timeline |
|---|---|---|---|
| Extremely low MVNO market share (< 2%) limits scale synergies | -1.4% | National | Medium term (2-4 years) |
| High wholesale rates versus OECD peers compress margins | -1.1% | National | Short term (≤ 2 years) |
| Spectrum ownership barrier for 5G standalone innovation | -0.8% | Urban centers | Long term (≥ 4 years) |
| Limited domestic roaming mandates outside rural zones | -0.5% | Rural areas | Medium term (2-4 years) |
| Source: Mordor Intelligence | |||
Extremely Low MVNO Market Share (< 2%) Limits Scale Synergies
Just 69,000 MVNO connections out of 6.4 million total mobile subscriptions translate into limited purchasing power when negotiating wholesale discounts. Lacking critical mass, most players outsource billing, customer service and network operations, thus losing control over customer experience differentiation. The sector’s fragmented profile—where even the largest independent MVNO reports only “tens of thousands” of lines—discourages strategic investors that prefer scalable growth prospects. Smaller bases also struggle to amortize marketing spend across customer life cycles, pushing operators toward low-touch digital channels that suit bargain hunters but limit brand loyalty. Without consolidation or a step-change in subscriber volume, cost disadvantages could persist through 2029 despite regulatory relief.
High Wholesale Rates Versus OECD Peers Dampen Pricing Headroom
Mobile termination access in New Zealand costs 0.0799 EUR per minute compared with an OECD average of 0.04 EUR, shrinking the gap between retail and wholesale tariffs available to MVNOs. Commerce Commission consultations on termination deregulation remain ongoing, leaving pricing uncertainty over the near term. Elevated inputs force MVNOs to anchor propositions around unlimited bundles with speed caps rather than lower-price capped-usage plans that depend on fine wholesale granularity. Incumbent operators can quickly mirror headline discounts while still profiting from wholesale margins, reducing competitive differentiation. Sustained high wholesale costs therefore remain a principal brake on aggressive market-share capture even as demand for lower prices rises.
*Our forecasts treat driver/restraint impacts as directional, not additive. The impact forecasts reflect baseline growth, mix effects, and variable interactions.
Segment Analysis
By Deployment Model: Cloud Infrastructure Drives Digital Transformation
Cloud solutions claim 69.51% of the New Zealand MVNO market share in 2024, reflecting the industry’s pivot from proprietary hardware toward elastic, API-driven platforms. Adopting cloud infrastructure allows rapid onboarding of new sub-brands through multi-tenant environments, supporting automated billing, analytics and customer care from day one. The New Zealand MVNO market size for cloud deployments is projected to expand at 9.77% CAGR through 2030 as partners such as Advantai integrate network-slicing orchestration that speeds service activation for digital-only entrants. Operators using public-cloud-native stacks avoid large upfront capex, redirecting resources to marketing and product differentiation.
On-premise solutions remain relevant among utilities and enterprise-centric MVNOs that require data sovereignty or bespoke integrations with energy billing platforms. These deployments incur higher capex yet offer deeper control over security and service logic, making them suitable for energy bundling by Contact, Mercury and Nova. However, maturing cloud security certifications and local availability zones are eroding historical hesitations about data residency. Over the forecast period, even conservative enterprises are expected to shift non-core workloads to managed cloud MVNO platforms to shorten product cycles.


By Operational Mode: Full MVNOs Emerge Despite Reseller Dominance
Resellers and light MVNOs represented 59.87% of the New Zealand MVNO market share in 2024, attracting early entrants seeking asset-light routes to market. Yet full MVNOs are forecast to record 20.48% CAGR, the fastest growth across operational archetypes, as service innovation and data ownership become critical to long-term differentiation. Migrating toward full control unlocks bespoke pricing engines, private label VoLTE and 5G network-slice management, capabilities that resellers cannot match.
The shift also reflects cross-industry convergence where energy utilities leverage existing billing relationships to upsell mobile connectivity. Full MVNO status lets these gentailers manage customer data holistically, applying advanced analytics to optimize bundled discounts and credit risk. Although upfront investment is higher, margins improve over time through wholesale volume discounts and ancillary revenue such as device financing or insurance. Consequently, the New Zealand MVNO market size attributable to full MVNOs is set to reach meaningful scale by 2030 as at least three new utility-backed entrants complete network-core upgrades.
By Subscriber Type: Enterprise and IoT Growth Accelerates Beyond Consumer Base
Consumer accounts dominate with 81.88% share in 2024, but IoT-specific lines are projected to grow at 27.74% CAGR, outpacing all other segments. The New Zealand MVNO market size associated with IoT solutions will benefit from agriculture sensors, connected logistics and health-care telemetry that require national coverage at low data volumes. MVNOs can bundle SIM management portals and analytics dashboards, addressing enterprise pain points around asset tracking and compliance.
Enterprise mobility represents an additional upside as businesses seek unified communications and mobile device management without multi-year carrier lock-ins. Full MVNOs capable of offering SD-WAN, private APNs and SLA-backed data slices can capture premium ARPU segments. While price-sensitive consumers continue to drive absolute connection volumes, IoT and enterprise contracts offer higher lifetime value, smoothing revenue volatility that stems from discount-centric consumer churn.
By Application: Cellular M2M Applications Drive Next-Generation Growth
Discount plans held 43.88% of the New Zealand MVNO market in 2024, underscoring the historical perception of MVNOs as budget alternatives. However, cellular M2M solutions are projected to achieve 27.19% CAGR, becoming the fastest-expanding application category. Industrial automation, utility metering and smart city deployments require low-power wide-area services that dovetail with NB-IoT and LTE-M capabilities available on all three host networks.
MVNOs can layer over advanced device management, firmware updates and analytics reporting, capturing value beyond connectivity. Meanwhile, discount voice-and-data bundles face commoditization as incumbent sub-brands quickly replicate headline offers. To sustain growth, MVNOs are pivoting toward higher-margin verticals such as M2M, where technical integration depth deters fast-follower competition.
By Network Technology: Satellite Integration Transforms Rural Connectivity
4G/LTE still accounts for 71.12% of the New Zealand MVNO market share in 2024. Satellite-to-mobile services, however, lead the growth trajectory at a forecast 40.06% CAGR. One NZ activated Starlink Direct-to-Mobile messaging for more than 300,000 eligible users in December 2024. This milestone demonstrates that MVNOs can partner for nationwide reach without shouldering rural tower capex.
5G network transformation continues in urban corridors, enabling high-throughput slices for gaming, AR and enterprise video collaboration. At the same time, 2G/3G sunset plans set for 2025 will push legacy machine-to-machine devices to migrate onto LTE-M or NB-IoT carriers. MVNOs positioned to orchestrate multi-access delivery—combining cellular, satellite and Wi-Fi offload—stand to differentiate on coverage resiliency rather than pure price.


By Distribution Channel: Digital-First Strategies Dominate Market Evolution
Digital-only channels contributed 55.91% to the New Zealand MVNO market size in 2024 and are anticipated to grow at 9.88% CAGR through 2030. Online-centric GTM models leverage automated KYC, eSIM activation and self-service care to minimize acquisition costs. E-commerce specialist Mighty Ape demonstrated this scalability by onboarding thousands of users within weeks of the Mighty Mobile rollout.
Traditional retail remains essential for demographics requiring physical device bundles or identity verification. Carrier-owned sub-brand stores act as hybrid outposts where customers can switch to discount plans without leaving the incumbent group. Nonetheless, the overall channel mix is tipped toward digital as banking-grade remote ID verification and embedded SIM provisioning become mainstream by 2026.
Geography Analysis
New Zealand’s dispersed population of 5.2 million shapes regional connectivity economics. Urban hubs such as Auckland and Wellington present high ARPU potential thanks to dense student and professional populations. Ookla clocked Wellington’s median mobile download speed at 94.26 Mbps in H1 2024, the fastest nationwide. MVNOs selecting host networks can therefore tailor gaming-grade or streaming-grade bundles to metropolitan centers demanding consistent performance.
Secondary cities including Hamilton, Christchurch and Tauranga account for growing suburbs where cost sensitivity intersects with adequate 4G coverage. Discount MVNOs like Rocket Mobile target these markets through social-media advertising and referral campaigns, leveraging cloud billing to absorb promotional churn costs without extensive retail overhead.
Rural coverage gaps persist on the West Coast, Coromandel and central Otago where mountainous terrain hampers macro-tower economics. Starlink Direct-to-Mobile and 2degrees’ AST SpaceMobile pilots promise to bridge these gaps, potentially unlocking latent demand for basic voice and messaging services among farming and tourism communities. Should satellite messaging prove reliable, MVNOs could market nationwide “zero-coverage-black-spots” guarantees that reposition them as reliability leaders rather than merely budget players.
Competitive Landscape
The structural dominance of Spark, One NZ and 2degrees leaves MVNOs competing for only 1–2% share of overall connections. Spark’s discount sub-brand Skinny alone outsells every independent MVNO, underscoring the incumbents’ ability to segment their own bases without relinquishing revenue. Commerce Commission oversight continues to evaluate whether sub-brand pricing strategies undermine service-based competition, though no price-control remedies have been imposed to date.
Independent entrants follow two broad plays. The first is pure-price disruption, seen in Rocket Mobile’s NZD 30 unlimited headline offer launched in August 2024. The second leverages cross-industry bundling: Contact Energy, Mercury and Nova include mobile allowances within electricity plans to lift household ARPU and cut churn in the regulated power market. Energy retailers benefit from existing customer care platforms that seamlessly integrate additional services, compressing time to break even.
Technology has become the equalizer. Cloud MVNEs such as Advantai provide white-label network cores, while eSIM provisioning reduces distribution costs. Incumbent networks monetize these services through wholesale revenue but also defend retail lines by accelerating sub-brand refreshes. Over the forecast window, sector consolidation remains plausible, especially if utilities acquire or merge smaller MVNOs to scale subscriber bases above the 100,000 line threshold required for better wholesale pricing.
New Zealand Mobile Virtual Network Operator (MVNO) Industry Leaders
-
Kogan Mobile
-
Warehouse Mobile
-
Mighty Mobile
-
Rocket Mobile
-
Zeronet Mobile
- *Disclaimer: Major Players sorted in no particular order

Recent Industry Developments
- June 2025: Kogan Mobile confirmed no eSIM support in the local market, citing device certification constraints.
- March 2025: One NZ partnered with Advantai to accelerate MVNO onboarding via API-rich platform tools.
- March 2025: Commerce Commission opened a formal review into potential deregulation of Mobile Termination Access Services (MTAS).
- January 2025: Kogan Mobile surpassed “tens of thousands” of customers, positioning as the fifth-largest mobile provider behind the three MNOs and Skinny.


New Zealand Mobile Virtual Network Operator (MVNO) Market Report Scope
| Cloud |
| On-premise |
| Reseller |
| Service Operator |
| Full MVNO |
| Light / Brand MVNO |
| Consumer |
| Enterprise |
| IoT-specific |
| Discount |
| Business |
| Cellular M2M |
| Others |
| 2G/3G |
| 4G/LTE |
| 5G |
| Satellite/NTN |
| Online/Digital-only |
| Traditional Retail Stores |
| Carrier Sub-brand Stores |
| Third-Party/Wholesale |
| By Deployment Model | Cloud |
| On-premise | |
| By Operational Mode | Reseller |
| Service Operator | |
| Full MVNO | |
| Light / Brand MVNO | |
| By Subscriber Type | Consumer |
| Enterprise | |
| IoT-specific | |
| By Application | Discount |
| Business | |
| Cellular M2M | |
| Others | |
| By Network Technology | 2G/3G |
| 4G/LTE | |
| 5G | |
| Satellite/NTN | |
| By Distribution Channel | Online/Digital-only |
| Traditional Retail Stores | |
| Carrier Sub-brand Stores | |
| Third-Party/Wholesale |


Key Questions Answered in the Report
What is the forecast revenue for New Zealand MVNO services in 2030?
The sector is projected to reach USD 211 million by 2030, reflecting a 6.15% CAGR over 2025-2030.
Which network technology is growing fastest among alternative providers?
Satellite/NTN lines, boosted by One NZ’s Starlink Direct-to-Mobile collaboration, are expected to post 40.06% CAGR through 2030.
How large is the consumer share of total MVNO connections?
Consumers account for 81.88% of active lines as of 2024.
Which operational archetype will expand most quickly in the next five years?
Full MVNOs are forecast to grow at 20.48% CAGR as brands seek deeper service control.
Where are MVNOs seeing the strongest geographic uptake?
Auckland and Wellington lead adoption due to dense populations and high data demand, while rural growth hinges on satellite coverage gains.
Page last updated on:


