Market Overview
| Study Period | 2020 - 2031 |
|---|---|
| Forecast Data Period | 2026 - 2031 |
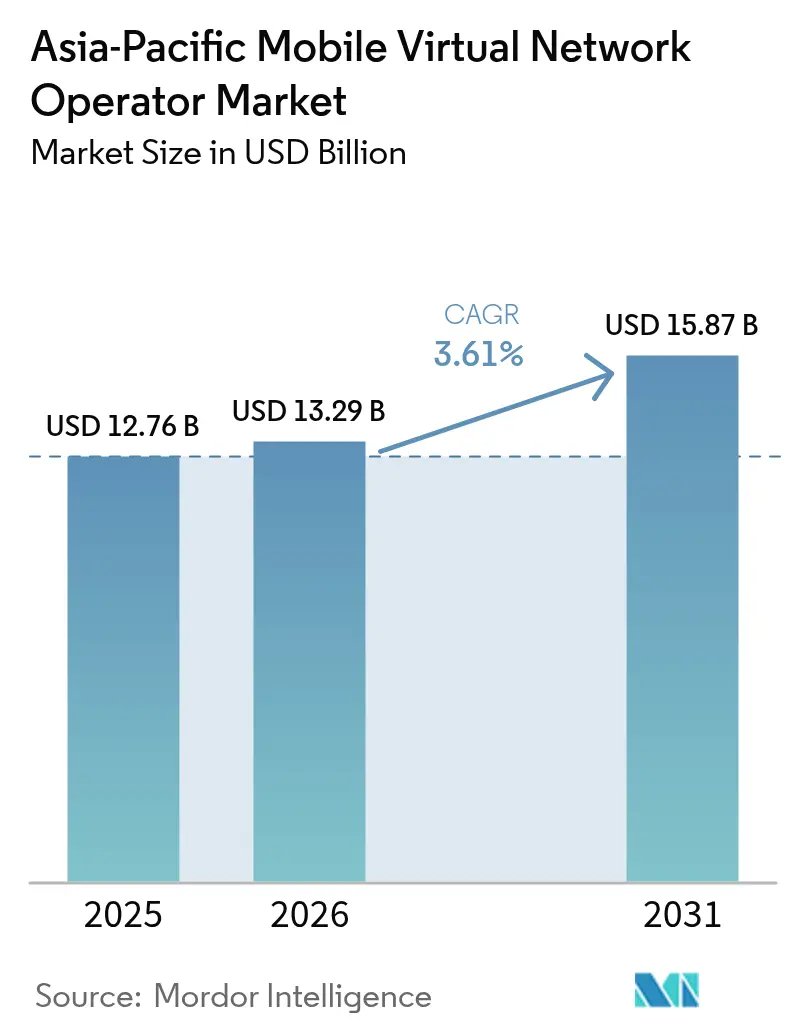
| Base Year Market Size (2025) | USD 12.76 Billion |
| Market Size (2026) | USD 13.29 Billion |
| Market Size (2031) | USD 15.87 Billion |
| Growth Rate (2026 - 2031) | 3.61% CAGR |
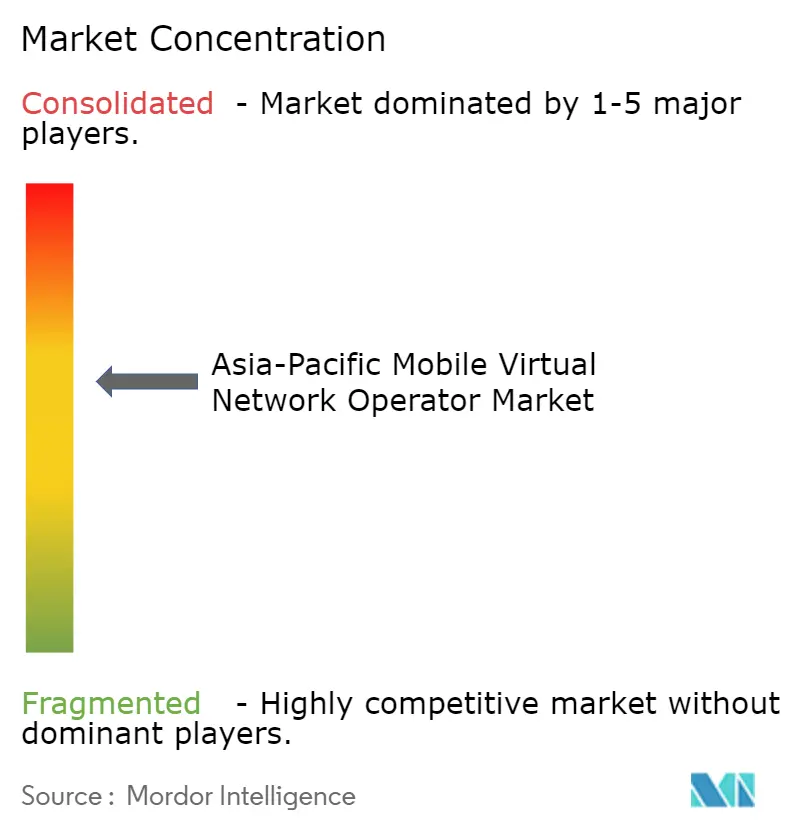
| Market Concentration | Medium |
Major Players *Disclaimer: Major Players sorted in no particular order Image © Mordor Intelligence. Reuse requires attribution under CC BY 4.0. | |
Asia-Pacific Mobile Virtual Network Operator Market Analysis by Mordor Intelligence
The Asia-Pacific Mobile Virtual Network Operator market size is expected to grow from USD 12.76 billion in 2025 to USD 13.29 billion in 2026 and is forecast to reach USD 15.87 billion by 2031 at 3.61% CAGR over 2026-2031. Regulatory biometric-SIM mandates, wholesale rate cuts, and the pivot to Open RAN are reshaping value creation, while enterprise IoT demand and satellite backhaul are opening fresh addressable niches. Markets with proactive cost-based wholesale regulation such as Japan and South Korea are witnessing faster full-MVNO scale-up, whereas countries with sticky pricing like Malaysia and the Philippines face margin compression. Intensifying price rivalry keeps consumer ARPU low, yet multi-year IoT and private-5G contracts are lifting revenue visibility for enterprise-focused operators. Meanwhile, super-app and fintech bundles are recasting telecom connectivity as an embedded loyalty feature, altering customer acquisition economics.
Key Report Takeaways
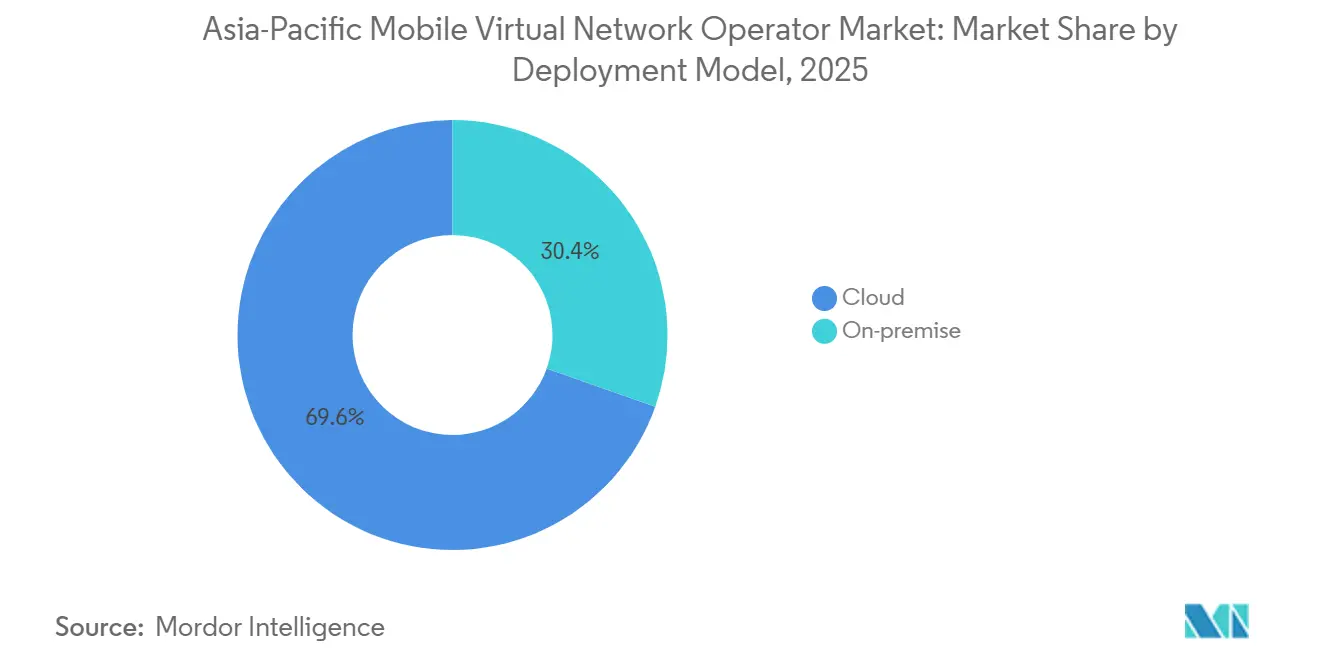
- By deployment model, cloud captured 69.58% revenue share of Asia-Pacific MVNO market in 2025; on-premise is projected to expand at a 3.76% CAGR to 2031.
- By operational mode, light and brand MVNOs held 56.62% of the Asia-Pacific mobile virtual network operator market share in 2025, while full MVNOs are advancing at a 5.17% CAGR through 2031.
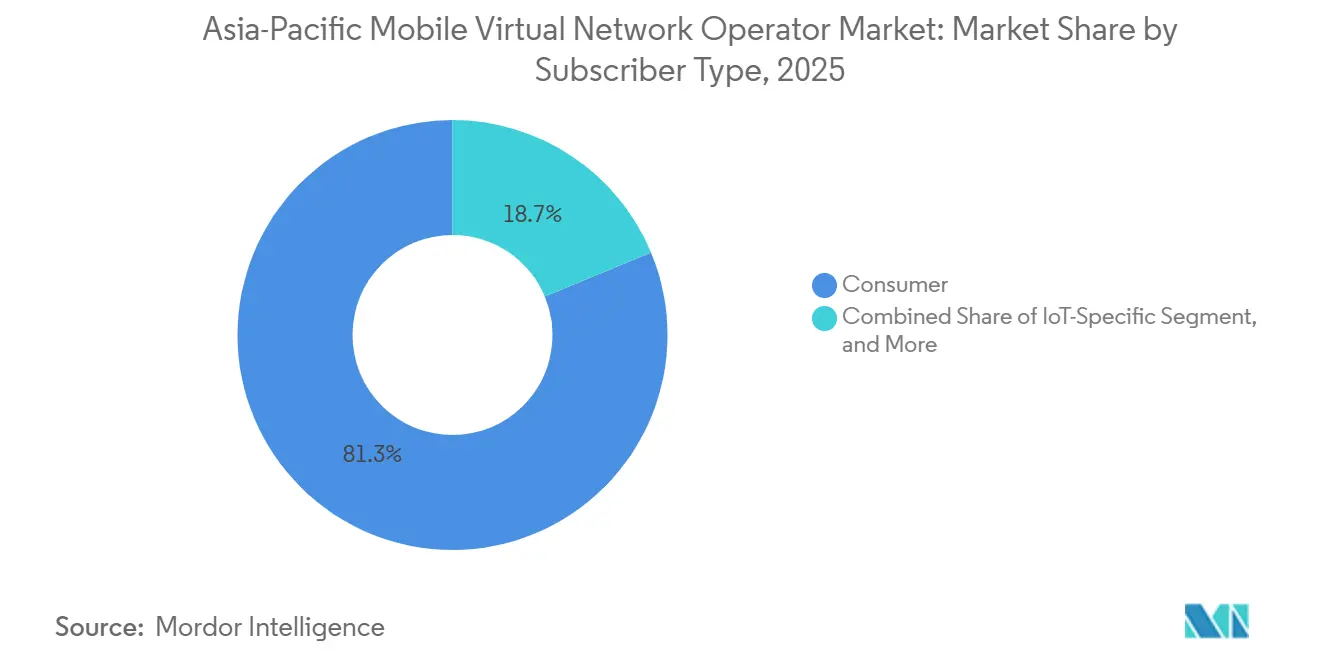
- By subscriber type, consumer lines accounted for 81.27% of the base in 2025, whereas IoT-specific connections are growing at 7.84% CAGR to 2031.
- By application, discount services led with 41.27% revenue share in 2025 and cellular M2M is set to grow at 5.42% CAGR to 2031.
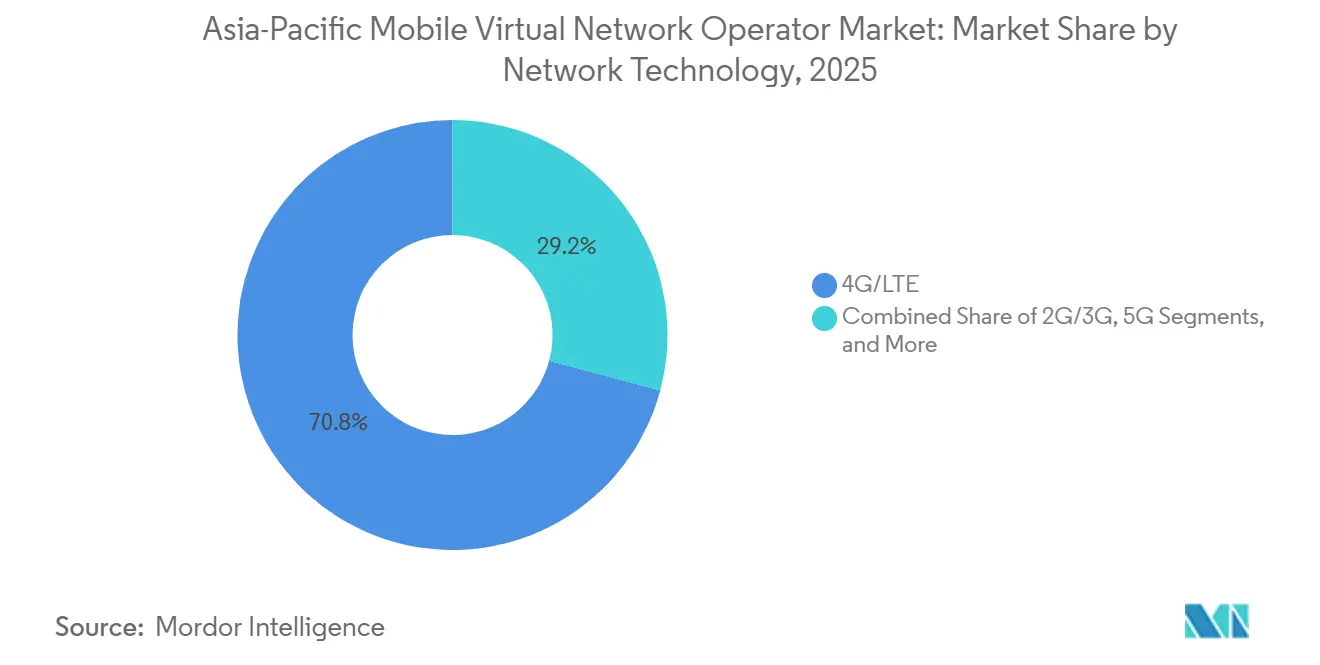
- By network technology, 4G and LTE represented 70.84% of the Asia-Pacific mobile virtual network operator market size in 2025; satellite and NTN links are forecast to expand at 8.49% CAGR.
- By distribution channel, online and digital-only outlets commanded 56.38% share od APAC MVNO market in 2025 and will rise at 3.91% CAGR.
- By country, China led with 31.53% share in 2025, while Vietnam is projected to post the fastest 8.07% CAGR to 2031.
Note: Market size and forecast figures in this report are generated using Mordor Intelligence’s proprietary estimation framework, updated with the latest available data and insights as of 2026.
Asia-Pacific Mobile Virtual Network Operator Market Trends and Insights
Drivers Impact Analysis*
| Driver | (~) % Impact on CAGR Forecast | Geographic Relevance | Impact Timeline |
|---|---|---|---|
| Rapid 5G Roll-Out, Network-Slicing-Enabled Service Differentiation | +0.9% | South Korea, Japan, Australia, Singapore | Medium term (2-4 years) |
| IoT Connection Boom Spawning Enterprise-Focused MVNOs | +0.7% | Japan, China, Singapore | Long term (≥ 4 years) |
| Rising Smartphone Penetration and Digital-Only Acquisition Models | +0.6% | India, Vietnam, Philippines, Indonesia | Short term (≤ 2 years) |
| Fintech and Super-App Bundling of Mobile Plans | +0.5% | Singapore, Malaysia, Vietnam, Philippines, India | Medium term (2-4 years) |
| Open-RAN-Driven Wholesale Cost Declines | +0.4% | Japan, Australia, Indonesia | Long term (≥ 4 years) |
| Private 5G and B2B2X Partnerships for Industry Verticals | +0.3% | Australia, Japan, New Zealand, Singapore | Long term (≥ 4 years) |
| Source: Mordor Intelligence | |||


Rapid 5G Roll-Out, Network-Slicing-Enabled Differentiation
Network slicing has shifted from lab trials to commercial scaling as regulators compel MNOs to open advanced capabilities to full MVNOs. Japan’s revised guidelines, issued in March 2025, require cooperative slicing access and already enabled the first MVNO number allocation in June 2025.[1]Ministry of Internal Affairs and Communications Japan, “Revised Guidelines for MVNO Network Slicing Access,” soumu.go.jp South Korea cut wholesale data prices by 36% in January 2025 and layered volume discounts that reward high-traffic full MVNOs.[2]Korea Herald, “Government Cuts MVNO Wholesale Rates by 36%,” koreaherald.com Mineo’s January 2026 full-MVNO launch grants control over core functions, letting the brand offer differentiated QoS tiers. Ericsson and Far EasTone’s live enterprise slices in Taiwan and Vodafone Idea’s India trials further validate monetizable use cases. These advances compress the proof-of-concept cycle and pull forward revenue from latency-sensitive verticals.
IoT Connection Boom Spawning Enterprise-Focused MVNOs
Cellular M2M lines are growing faster than consumer SIMs as industrial clients seek predictable lifetime pricing and global roaming. Soracom’s May 2025 joint venture with Marubeni and its March 2026 SGP.32 hypervisor pre-orders exemplify how multi-carrier eSIM orchestration lowers lock-in risk.[3]Soracom, “SGP.32 Connectivity Hypervisor Launch,” soracom.io 1NCE’s USD 1-2.50 lifetime-flat plan erases monthly billing friction. Singtel’s floLIVE pact embeds connectivity inside hardware, turning the operator into a B2B2X platform. Maxis and Smart Communications anchor similar alliances in Malaysia and the Philippines, proving that industrial IoT MVNOs secure higher contract duration and stickier revenue.
Rising Smartphone Penetration and Digital-Only Models
High smartphone uptake and mandatory e-KYC frameworks enable app-based onboarding for less than USD 10 per customer. SIMBA captured more than 10% share in Singapore within two years by relying almost exclusively on digital channels. Circles.Life rolled out a 1 terabyte 5G plan and cross-border “Borderless” service in February 2025, illustrating rapid feature iteration once retail overhead is removed. Indonesia, Malaysia, and South Korea will move to facial verification by early 2026, further slashing physical-store reliance. Yet IIJ’s October 2025 KYC upgrade in Japan shows that compliance costs can rise, forcing digital-natives to balance frictionless onboarding with fraud prevention.
Fintech and Super-App Bundling of Mobile Plans
Super-apps are integrating telecom to retain users inside payment ecosystems. Grab’s September 2025 tie-up with Alipay+ syncs cross-border QR payments and positions mobile data as a loyalty perk.[4]Grab, “Alipay+ Partnership Expands Cross-Border QR Acceptance,” grab.com OCBC Bank added eight regional wallets in November 2025, creating a single rail that can up-sell connectivity during checkout.[5]OCBC Bank, “OCBC Digital Wallet Integration,” ocbc.com LG Uplus links public-transit discounts and IPTV bundles to U+Mobile SIMs, proving that daily-life integrations deepen stickiness. As payments and connectivity converge, MVNOs morph into white-label enablers for fintech brands, shifting marketing spend toward ecosystem partnerships rather than standalone advertising.
Restraints Impact Analysis*
| Restraint | (~) % Impact on CAGR Forecast | Geographic Relevance | Impact Timeline |
|---|---|---|---|
| Persistently High Wholesale Rates Squeezing Margins | -0.6% | Malaysia, Philippines, Indonesia, broader region | Short term (≤ 2 years) |
| Price-Led Rivalry Driving Ultra-Low ARPU and High Churn | -0.5% | China, Vietnam, India | Medium term (2-4 years) |
| AI-Based KYC and Fraud-Prevention Compliance Costs | -0.3% | Indonesia, Malaysia, Thailand, South Korea | Short term (≤ 2 years) |
| Uncertain Spectrum Fees for Satellite MVNOs | -0.2% | India, Philippines, Australia | Long term (≥ 4 years) |
| Source: Mordor Intelligence | |||
Persistently High Wholesale Rates Squeezing Margins
Wholesale charges often claim 60-70% of MVNO revenue, and regulators outside Japan and South Korea rarely enforce cost-based benchmarks. Vietnam’s MVNO ARPU of USD 2.00-2.80 is less than half the MNO level, yet operators still exited due to unviable margins.[6]Vietnam Ministry of Information and Communications, “Telecommunications Law 2023,” mic.gov.vn Thailand’s NT departed the segment in August 2025 amid spectrum expiry and roaming cost inflation. China’s MVNO revenues fell more than 20% in the first three quarters of 2025 while usage dropped, highlighting the double squeeze of falling top-line and sticky input costs. Absent regulatory reform, capital for slicing, IoT platforms, and brand marketing will remain constrained.
Price-Led Rivalry Driving Ultra-Low ARPU and High Churn
Discount MVNOs frequently undercut incumbents, pushing tariffs below sustainable levels and triggering churn cycles. China’s 2025 voice and SMS traffic decline of over 30% underscores commoditization.[7]China Academy of Information and Communications Technology, “MVNO Market Performance Q1-Q3 2025,” caict.ac.cn IIJmio’s February 2026 price reset to JPY 1,600 aims to preserve share but slices margin headroom. Circles.Life’s 2026 platform-fee hike risks churn if rivals hold prices. Malaysia’s flat ARPU of USD 5.1 despite 147% penetration indicates that competition expands multi-SIM ownership rather than revenue. Continuous price discounting erodes lifetime value, forcing MVNOs into volume-driven strategies.
*Our forecasts treat driver/restraint impacts as directional, not additive. The impact forecasts reflect baseline growth, mix effects, and variable interactions.
Segment Analysis
By Deployment Model: Cloud Services Consolidate Advantage
Cloud-based implementations commanded 69.58% of the Asia-Pacific mobile virtual network operator market share in 2025. Transatel’s November 2025 adoption of Oracle’s 5G SA core showed how cloud orchestration shortens launch cycles. Soracom’s SGP.32 hypervisor allows real-time carrier swaps, emphasizing elasticity. The Asia-Pacific mobile virtual network operator market size linked to cloud is projected to climb at a 3.76% CAGR as hyperscalers bundle telecom APIs with existing IaaS footprints. On-premise remains relevant for sovereign or critical-infrastructure workloads such as CentrePort’s New Zealand port network, yet hybrid models that keep edge workloads local while off-loading subscriber management to public cloud are proliferating. Cost avoidance, faster scaling, and vendor-agnostic Open RAN stacks will keep cloud’s leadership intact while squeezing proprietary appliance vendors.
Second-generation deployments are coupling cloud cores with disaggregated radios, as seen in Rakuten Mobile’s March 2026 Samsung deal. Regional MVNEs now offer “network-as-code” portals that let smaller brands spin up new slices in days, reducing dependence on MNO engineering backlogs. As a result, entry barriers fall, encouraging niche MVNO launches targeting content bundles, migrant communities, or B2B verticals. However, reliance on third-party public clouds shifts OPEX from capex to recurring spend, nudging margins toward software-like profiles that reward scale and automation.

By Operational Mode: Full MVNOs Gain Strategic Control
Light and brand MVNOs held 56.62% share in 2025 thanks to low capital requirements, but full MVNO lines are rising at 5.17% CAGR as brands chase differentiated QoS. Japan Communication Inc secured the first dedicated number range under the 2025 slicing guidelines, signaling regulator support for deeper infrastructure control. The Asia-Pacific mobile virtual network operator market size attributable to full-mode operations will expand as volume-linked discounts in South Korea favor entities that manage their own core. Global MVNO Consortium’s March 2026 formation demonstrates cooperative purchasing power, letting smaller operators share costs yet still access full-core functions.
Brands shifting up the stack can craft application-specific slices for gaming, telemedicine, or AR/VR, carving premium niches. Yet the capex burden moves to software licensing, cybersecurity, and 24×7 NOC staffing, areas where many legacy reseller MVNOs lack expertise. Consequently, a two-tier landscape is likely: capital-lite resellers playing in ultra-low-price retail, and capital-heavy full MVNOs monetizing enterprise and vertical opportunities. The middle-ground service-operator model may shrink as economies of scale bifurcate.
By Subscriber Type: Enterprise and IoT Transform the Mix
Consumer accounts formed 81.27% of subscriptions in 2025, but IoT lines are growing the fastest at 7.84% CAGR. Multi-year contracts from logistics, utilities, and manufacturing reduce churn and elevate EBITDA margins. The Asia-Pacific mobile virtual network operator market size tied to IoT platforms benefits from 1NCE’s lifetime-flat business model that aligns with asset-depreciation cycles. Enterprise voice and data bundles also gain traction as LG Uplus packages IPTV and transport discounts, locking customers into ecosystem services.
Conversely, consumer-focused discount brands struggle with rising acquisition costs as biometric verification becomes mandatory. Digital onboarding lowers store expenses but pushes marketing budgets to online channels where competition for attention is fierce. The diverging economics will push many MVNOs to pivot toward B2B2X relationships, leaving mass-market consumer segments concentrated among a handful of scale players.

By Application: Discount Still Leads While M2M Accelerates
Discount propositions owned 41.27% revenue share in 2025, sustained by price-sensitive segments across China, Vietnam, and India. However, cellular M2M is forecast to grow at 5.42% CAGR through 2031, adding recurring high-margin connections. Enterprise procurement teams increasingly favor per-device flat pricing, and platforms like Soracom’s hypervisor ease global rollout, making MVNOs attractive over siloed MNO roaming packs. Media-and-entertainment tie-ups, exemplified by Rakuten Mobile’s U-NEXT bundle, illustrate how content differentiators can lift ARPU without equivalent traffic cost escalation. Retail and migrant applications remain niche yet resilient, leveraging affinity marketing.
Still, unlimited-data promotions in the discount space challenge network cost recovery, especially where spectrum fees rise. Some brands respond with fair-usage throttling and platform-fee surcharges, but retention risk remains when substitutes abound. M2M’s predictable data envelopes and SLA-linked premium increase the strategic importance of enterprise relationships.
By Network Technology: LTE Dominates but Satellite Gains Altitude
The 4G and LTE segment accounted for 70.84% of the Asia-Pacific Mobile Virtual Network Operator market share in 2025, reflecting the installed handset base and contiguous mid-band spectrum. Satellite and non-terrestrial networks are the fastest risers, advancing at an 8.49% CAGR through 2031 as operators extend coverage to islands, deserts, and maritime lanes. Smart Philippines logged 11.2 million 5G devices in Q4 2025, underscoring the pull of mid-band 5G for urban data users. Telstra’s June 2025 satellite messaging launch proved low-earth-orbit links can carry emergency texts without terrestrial fallback. India’s regulator capped satellite spectrum fees at 4% of adjusted gross revenue, a precedent that lowers entry barriers for space-enabled MVNO model.
As operators sunset 3G bands, refarmed spectrum is flowing into 4G and 5G standalone cores, letting MVNOs deliver sub-10 millisecond latency for industrial automation. Circles.Life activated 5G standalone in February 2025, showing that digital-only brands can be first-movers when host networks expose new radio slices. Optus opened 5G standalone fixed-wireless access to wholesale partners in June 2025, giving MVNOs a speed-tier tool for rural broadband. Globe’s January 2026 Starlink activation in the Philippines shifted backhaul economics for hard-to-reach provinces. Together, these moves diversify network options and reduce the risk that any single technology chokepoint constrains future growth.
By Distribution Channel: Digital-Only Outruns Brick-and-Mortar
Online and digital-only routes captured 56.38% of 2025 additions, the largest slice of the Asia-Pacific Mobile Virtual Network Operator market share, and they are projected to grow at a 3.91% CAGR to 2031. SIMBA in Singapore surpassed 500,000 users by mid-2024 with an app-first model that cuts acquisition cost below USD 10 per line. Biometric SIM registration rules taking effect in South Korea from March 2026, plus pilot trials in Indonesia, enable remote onboarding and further reduce the need for storefront visits. Circles.Life bundled a 1 terabyte 5G plan with a borderless roaming pack in February 2025, proving large-data offers can be sold entirely in-app. IIJ updated its KYC workflow in January 2026, adding facial verification and chip reads, which lifted compliance spending but cut fraud-related churn.
Cash-centric populations keep brick-and-mortar relevant, so hybrid tactics place starter-kits in convenience stores while shifting top-ups to digital wallets. Malaysia’s Maxis partnered with China Mobile CMLink in August 2025, using electronics retailers to reach expatriate shoppers before steering recharges online. Pop-up kiosks at transport hubs still drive impulse sales for traveler SIMs, yet e-SIM-ready phones are phasing out physical inventory, freeing retailers to focus on device bundles. Mandatory facial KYC raises per-activation costs but also builds trust, which increases basket size when users add family lines or content bundles. As a result, digital-first MVNOs are evolving into hybrid sellers that blend low-touch acquisition with selective retail presence to reach unbanked or last-mile customers.
Geography Analysis
China controlled 31.53% of the Asia-Pacific Mobile Virtual Network Operator market share in 2025, yet its MVNO segment reported 46.04 million users for the first three quarters of that year, with voice and SMS traffic falling more than 30%, revenue dropping over 20%, and profits sliding more than 30%. Persistent wholesale fees and price-led rivalry are compressing gross margins and limiting reinvestment in network-slicing upgrades. Even so, the installed smartphone base and the government’s industrial IoT push continue to attract enterprise-focused MVNO launches that target smart-factory and logistics hubs.
Vietnam is the fastest growing geography, advancing at an 8.07% CAGR through 2031 as a pro-competition law and Circular 08/2024 require nondiscriminatory wholesale tariffs. Five active MVNOs served 2.65 million lines in April 2025, equal to only 2.1% of national mobile subscribers, leaving ample headroom for digital-only entrants. Average revenue per MVNO user runs from VND 50,000 to VND 70,000 per month (USD 2.00-2.80), roughly one-third of MNO levels, but mandated price floors on interconnection help stabilize contribution margins. The regulator also signaled support for 6G pilots beginning 2029, which may let MVNOs leapfrog legacy networks and deploy native cloud cores.
Japan and South Korea illustrate how regulation steers scale. Japan’s MVNO base reached 13.829 million lines and 6% overall market share in September 2025, led by IIJ at 32.8% of domestic MVNO subscribers. Revised interconnection rules compel host operators to open network-slicing APIs, and Mineo became a full MVNO in January 2026 to exploit those rights. South Korea crossed 10 million MVNO lines in June 2025 after the Ministry of Science and ICT cut wholesale data rates by 36% and introduced volume discounts that trim up to 25% above 50,000 terabytes. LG Uplus alone added 9.005 million MVNO users in 2025, marking its seventh straight year of double-digit growth. These contrasting policy models show that cost-based wholesale mandates correlate with faster MVNO penetration and fuller migration toward network-slicing services.
Competitive Landscape
Competition is moderately fragmented. Light and brand operators still account for 56.62% of 2025 revenue, yet full MVNOs are scaling fastest as they deploy cloud cores and Open RAN radios to differentiate quality of service. In Japan, IIJ sustained leadership by repricing its 15-gigabyte plan to JPY 1,600 (USD 10.67) in February 2026 while keeping churn below 1.5% per month. Rakuten Mobile achieved EBITDA break-even in fiscal 2025 with 10 million subscribers, then diversified vendors through a March 2026 Samsung Open RAN supply pact that reduces per-site costs.
South Korea highlights volume-driven economics. LG Uplus tied mobile service bundles to internet and IPTV in May 2025 and layered a K-Pass transit discount in April 2025, driving cross-product stickiness that pushed average revenue per bundled user 15% above stand-alone lines. KT M Mobile, meanwhile, crossed 1.9 million subscribers in January 2026 by leveraging host-provided volume rebates to undercut rival tariffs. In Southeast Asia, Circles.Life raised its platform fee from SGD 0.30 to SGD 0.70 (USD 0.22-0.52) on 1 February 2026 to offset rising biometric KYC costs, a move that rivals have yet to follow.
IoT-centric specialists are carving profitable niches. Soracom and Marubeni formed a 51-49 joint venture in May 2025 to broaden industrial connectivity across Asia, while 1NCE’s USD 1-2.50 lifetime flat model captured asset-tracker deployments in logistics and utilities. Transatel’s November 2025 Oracle 5G standalone core now orchestrates multi-carrier eSIM profiles for automotive OEMs, reducing roaming risk for connected-car programs. Consolidators such as the Global MVNO Consortium, launched March 2026, aggregate wholesale demand across Jersey Telecom, MVNE Pty, MDS Global, and Ycorp to negotiate near-full MVNO economics without duplicating infrastructure.
Asia-Pacific Mobile Virtual Network Operator Industry Leaders
Circles.Life (Liberty Wireless Pte Ltd)
Tune Talk Sdn. Bhd.
Red One Network Sdn. Bhd.
Amaysim Mobile Pty Ltd
Kogan Mobile Operations Pty Ltd
- *Disclaimer: Major Players sorted in no particular order

Recent Industry Developments
- March 2026: Soracom opened pre-orders for its SGP.32 Connectivity Hypervisor enabling multi-carrier eSIM orchestration.
- March 2026: Global MVNO Consortium launched to pool wholesale demand and secure full-MVNO economics.
- March 2026: Rakuten Mobile signed a 5G Open RAN supply agreement with Samsung, diversifying vendor mix.
- February 2026: Telkomsel introduced facial-recognition SIM registration across Indonesia, aligning with national trials.


Asia-Pacific Mobile Virtual Network Operator Market Report Scope
The Asia-Pacific Mobile Virtual Network Operator (MVNO) market is defined based on the revenues generated from the MVNO services offered by various players operating in the market. The analysis is based on the market insights captured through secondary research and primaries. The market also covers the major factors impacting its growth in terms of drivers and restraints.
The Asia-Pacific Mobile Virtual Network Operator Market Report is Segmented by Deployment Model (Cloud, and On-Premise), Operational Mode (Reseller, Service Operator, Full MVNO, and Light/Brand MVNO), Subscriber Type (Consumer, Enterprise, and IoT-Specific), Application (Discount, Business, Cellular M2M, Media and Entertainment, Retail, Roaming, Migrant, and Telecom Wholesale), Network Technology (2G/3G, 4G/LTE, 5G, and Satellite/NTN), Distribution Channel (Online/Digital-Only, Traditional Retail Stores, Carrier Sub-Brand Stores, and Third-Party/Wholesale), and Geography (China, India, Japan, Vietnam, Malaysia, Philippines, Singapore, South Korea, and Rest of Asia Pacific). The Market Forecasts are Provided in Terms of Value (USD).
By Deployment Model
| Cloud |
| On-Premise |
By Operational Mode
| Reseller |
| Service Operator |
| Full MVNO |
| Light / Brand MVNO |
By Subscriber Type
| Consumer |
| Enterprise |
| IoT-Specific |
By Application
| Discount |
| Business |
| Cellular M2M |
| Media and Entertainment |
| Retail |
| Roaming |
| Migrant |
| Telecom Wholesale |
By Network Technology
| 2G/3G |
| 4G/LTE |
| 5G |
| Satellite/NTN |
By Distribution Channel
| Online / Digital-Only |
| Traditional Retail Stores |
| Carrier Sub-Brand Stores |
| Third-Party / Wholesale |
By Country
| China |
| India |
| Japan |
| Vietnam |
| Malaysia |
| Philippines |
| Singapore |
| South Korea |
| Rest of Asia-Pacific |
| By Deployment Model | Cloud |
| On-Premise | |
| By Operational Mode | Reseller |
| Service Operator | |
| Full MVNO | |
| Light / Brand MVNO | |
| By Subscriber Type | Consumer |
| Enterprise | |
| IoT-Specific | |
| By Application | Discount |
| Business | |
| Cellular M2M | |
| Media and Entertainment | |
| Retail | |
| Roaming | |
| Migrant | |
| Telecom Wholesale | |
| By Network Technology | 2G/3G |
| 4G/LTE | |
| 5G | |
| Satellite/NTN | |
| By Distribution Channel | Online / Digital-Only |
| Traditional Retail Stores | |
| Carrier Sub-Brand Stores | |
| Third-Party / Wholesale | |
| By Country | China |
| India | |
| Japan | |
| Vietnam | |
| Malaysia | |
| Philippines | |
| Singapore | |
| South Korea | |
| Rest of Asia-Pacific |


Key Questions Answered in the Report
What is the forecast size of the Asia-Pacific mobile virtual network operator market by 2031?
The market is projected to reach USD 15.87 billion by 2031, expanding at a 3.61% CAGR from 2026.
Which subscriber segment is growing fastest?
IoT-specific connections are advancing at 7.84% CAGR thanks to enterprise demand for global, lifecycle-aligned connectivity.
Why are full MVNOs gaining traction?
Regulatory mandates for network slicing in Japan and South Korea and volume-linked discounts encourage brands to operate independent cores for differentiated QoS.
How are satellite networks impacting MVNO growth?
Direct-to-device satellite services from providers such as Starlink and Telstra add coverage in rural and maritime zones, expanding addressable markets beyond terrestrial footprints.
What key restraint could limit MVNO profitability?
Persistently high wholesale rates, especially in markets without cost-based regulation, can consume up to 70% of revenue and squeeze margins.
Which country is expected to post the fastest MVNO growth through 2031?
Vietnam, supported by non-discriminatory wholesale pricing rules, is forecast to grow at an 8.07% CAGR.
Page last updated on:


