Market Overview
| Study Period | 2020 - 2031 |
|---|---|
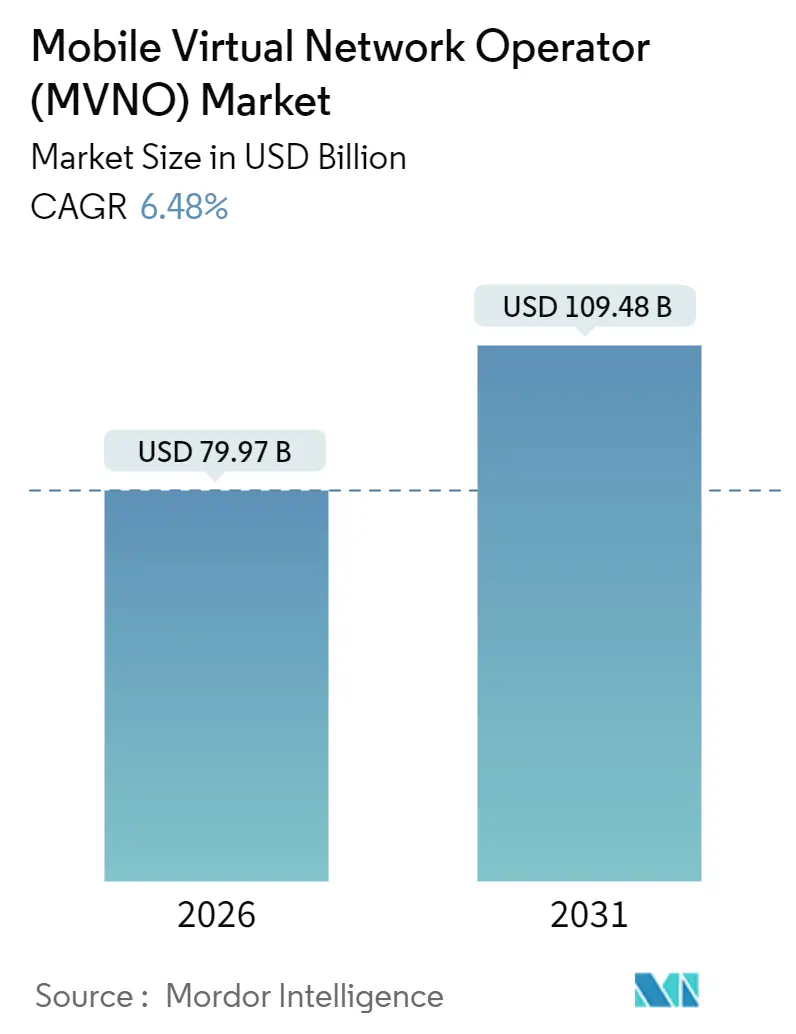
| Market Size (2026) | USD 79.97 Billion |
| Market Size (2031) | USD 109.48 Billion |
| Growth Rate (2026 - 2031) | 6.48% CAGR |
| Fastest Growing Market | Asia Pacific |
| Largest Market | North America |
| Market Concentration | Low |
Major Players *Disclaimer: Major Players sorted in no particular order Image © Mordor Intelligence. Reuse requires attribution under CC BY 4.0. | |
Mobile Virtual Network Operator (MVNO) Market Analysis by Mordor Intelligence
The Mobile Virtual Network Operator market size reached USD 79.97 billion in 2026 and is set to climb to USD 109.48 billion by 2031, advancing at a 6.48% CAGR. This expansion reflects how agile brands shift core business systems to public cloud platforms, pair them with eSIM provisioning, and monetize fast-growing IoT traffic while navigating cost exposure to host-network wholesale fees. Cloud-based enablement, large prepaid subscriber pools, and supportive wholesale-access regulation collectively spur growth, yet margin headwinds persist whenever incumbent Mobile Network Operators (MNOs) lift per-gigabyte charges to fund 5G rollouts.
Competitive strategy increasingly centers on automation at scale. Cloud billing engines spin up new instances on demand, reducing onboarding bottlenecks during flash promotions and holiday-season SIM giveaways. eSIM-only sign-ups cut customer-acquisition costs from around USD 50 in brick-and-mortar channels to below USD 20 online, though frictionless switching amplifies churn risk. Industrial IoT lines, often contracted for 10-year device life cycles, give operators a revenue hedge against price-sensitive consumer prepaid traffic. Meanwhile, partial spectrum sharing and satellite-to-cell partnerships extend coverage to remote zones, but they also blur traditional wholesale boundaries by letting enterprises self-provision connectivity. As a result, the Mobile Virtual Network Operator market must balance relentless price competition with service differentiation based on niche content, fintech tie-ins, and multi-network IoT dashboards.
Key Report Takeaways
- By deployment model, cloud platforms captured 56.51% revenue in 2025 and are expanding at a 7.11% CAGR through 2031.
- By operational mode, Light or Brand MVNOs will be the fastest growers, registering a 6.78% CAGR through 2031.
- By subscriber type, IoT-specific connections are projected to rise at a 7.37% CAGR, outpacing consumer additions through 2031.
- By application, Cellular M2M solutions are set to post a 6.93% CAGR between 2026 and 2031.
- By network technology, 5G MVNO lines are forecast to advance at a 7.89% CAGR through 2031.
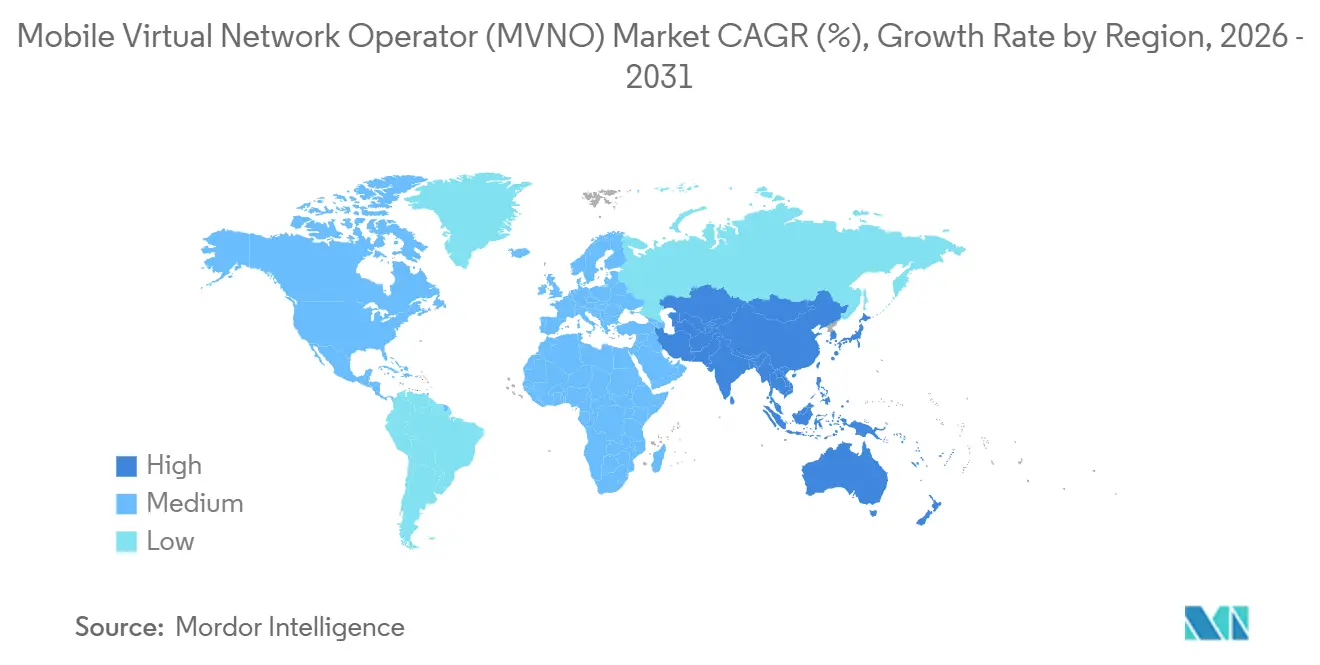
- Asia Pacific leads regional growth with a 7.45% CAGR forecast through 2031.
Note: Market size and forecast figures in this report are generated using Mordor Intelligence’s proprietary estimation framework, updated with the latest available data and insights as of January 2026.
Global Mobile Virtual Network Operator (MVNO) Market Trends and Insights
Drivers Impact Analysis*
| Driver | (~) % Impact on CAGR Forecast | Geographic Relevance | Impact Timeline |
|---|---|---|---|
| Rising mobile-subscriber base and smartphone penetration | +1.2% | India, Indonesia, Nigeria, other emerging markets | Medium term (2-4 years) |
| Demand for low-cost voice and data plans | +1.5% | South America, Africa, South Asia | Short term (≤ 2 years) |
| Expansion of IoT and M2M connections | +1.3% | North America, Europe, China, Southeast Asia | Long term (≥ 4 years) |
| Regulatory push for open wholesale access and eSIM-enabled entry | +1.0% | Europe, India, Latin America | Medium term (2-4 years) |
| Fintech and telco convergence spawning bank-branded MVNOs | +0.8% | Brazil, Mexico, Kenya | Medium term (2-4 years) |
| Satellite-to-cell partnerships enabling global MVNO coverage | +0.7% | Rural North America, Sub-Saharan Africa | Long term (≥ 4 years) |
| Source: Mordor Intelligence | |||
Rising Mobile-Subscriber Base and Smartphone Penetration
Smartphones added more than 100 million new users in India between 2024 and 2025, and urban smartphone adoption in Sub-Saharan Africa exceeded 50% for the first time in 2025.[1]GSMA, “The Mobile Economy 2025,” gsma.com An enlarged smartphone user base lifts data-centric average revenue per user because customers stream video, transact on social-commerce platforms, and rely on digital wallets. MVNOs with cloud billing rapidly bundle these services and adjust tariff structures without lengthy network-core upgrades. Higher data usage also stabilizes churn because subscribers accrue app ecosystems tied to the MVNO account rather than legacy voice only plans.
Demand for Low-Cost Voice and Data Plans
Brazil recorded a 4.6% inflation rate in 2025, pushing thousands of middle-income consumers toward prepaid MVNO plans priced 30-40% below incumbent post-paid offers. The European Commission confirmed a 12% fall in wholesale gigabyte fees from 2023 to 2025, letting discount MVNOs uphold gross margins above 20% even while under-cutting MNO retail prices.[2]Ericsson, “Mobility Report June 2025,” ericsson.com Although the arbitrage is attractive, it narrows quickly when host MNOs retaliate with fighter brands or regulators enforce price floors to protect network investment returns.
Expansion of IoT and M2M Connections
Ericsson counted 3.2 billion cellular IoT connections worldwide in 2025, a figure it expects to reach 5.5 billion by 2030. Logistics fleets, utilities, and healthcare providers leverage MVNO-aggregated global SIMs to avoid siloed contracts in every country. Because IoT lines stay active for up to 15 years and carry predictable usage profiles, they provide annuity-like revenue that balances volatile prepaid consumer markets. Massive IoT growth also justifies investments in cloud-native core networks optimized for narrowband traffic and long-battery-life edge devices.
Regulatory Push for Open Wholesale Access and eSIM-Enabled Entry
BEREC required European MNOs to grant full MVNO access within 90 days of request effective 2024, cutting time-to-market for digital-first brands[3]BEREC, “Wholesale Access Guidelines 2024,” berec.europa.eu. India’s TRAI introduced eSIM interoperability in 2025, allowing consumers to switch operators without visiting a store.[4]TRAI, “eSIM Interoperability Framework 2025,” trai.gov.in Together, these rules lower entry costs for fintechs and content providers eager to embed connectivity inside existing apps, intensifying competition but also broadening service innovation.
Restraints Impact Analysis*
| Restraint | (~) % Impact on CAGR Forecast | Geographic Relevance | Impact Timeline |
|---|---|---|---|
| Margin squeeze from intense price competition | -1.1% | Mature European markets, parts of North America | Short term (≤ 2 years) |
| Dependence on host MNOs for network quality and wholesale fees | -0.9% | Markets lacking price-cap mandates | Medium term (2-4 years) |
| Device-OEM control of eSIM ownership bypassing MVNO model | -0.6% | Western Europe, North America, urban China | Long term (≥ 4 years) |
| Private-spectrum sharing lets enterprises self-provision service | -0.5% | United States, Germany, Japan, Australia | Long term (≥ 4 years) |
| Source: Mordor Intelligence | |||
Margin Squeeze from Intense Price Competition
United Kingdom average mobile ARPU fell from GBP 14.20 (USD 19.03) in 2023 to GBP 12.80 (USD 17.15) in 2025, reflecting commoditized unlimited-data bundles. Because wholesale fees often track MNO 5G investment cycles, MVNOs experience fixed-cost pressure while retail price ceilings slide. Operators therefore cross-sell device insurance, paid content, and buy-now-pay-later finance inside their apps to offset declining connectivity margins.
Dependence on Host MNOs for Network Quality and Wholesale Fees
An MVNO riding a third-place MNO’s network struggles to match a rival’s rural coverage if that rival buys capacity from the national number-one carrier. Wholesale-fee hikes can also arrive without warning, as dominant MNOs protect post-paid revenue by taxing partner traffic. Lacking spectrum licenses, MVNOs cannot simply light up new towers, so their primary defense is diversified multi-MNO or satellite-overlay agreements that improve resilience but raise cost complexity.
*Our forecasts treat driver/restraint impacts as directional, not additive. The impact forecasts reflect baseline growth, mix effects, and variable interactions.
Segment Analysis
By Deployment Model: Cloud Drives Flexible Scaling
Cloud platforms accounted for 56.51% of revenue in 2025 and are on track for 7.11% CAGR through 2031, reflecting the segment’s ability to spin up real-time rating, digital-onboarding, and AI-based care modules as subscriber counts surge. The Mobile Virtual Network Operator market size for cloud deployment is forecast to expand faster than on-premise setups because operators avoid hefty server refresh cycles when 5G standalone workloads rise. In parallel, some regulators insist on local-data residency, so hybrid clouds emerge where sensitive subscriber databases stay in-country while less confidential analytics workloads run in global regions. Cybersecurity posture also improves because hyperscale providers amortize zero-trust upgrades across thousands of tenants, something small operators could not afford alone.
On-premise environments persist among legacy brands in markets where data-sovereignty or public-cloud skepticism remains high. These MVNOs often carry capitalized IT assets on balance sheets, so they sweat hardware longer, accepting slower product-release cadences. Nonetheless, container orchestration is seeping into their private data centers, letting them adopt some microservice agility without wholesale re-platforming. Cost models diverge: cloud bills flex with marketing-driven subscriber spikes while on-premise depreciation schedules stay flat, shaping cash-flow planning and headline EBITDA.
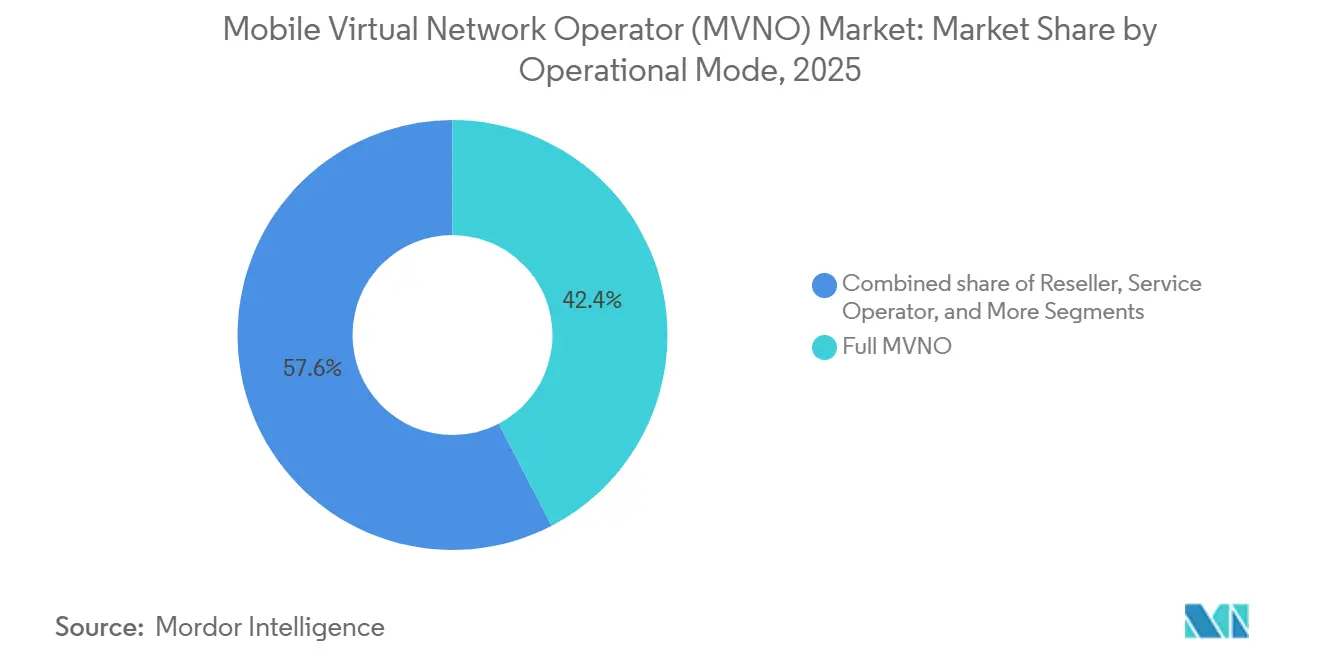
By Operational Mode: Light Models Trim Capital Risk
Full MVNOs held 42.37% of global revenue in 2025, yet Light or Brand MVNOs are forecast at 6.78% CAGR, outpacing the heavier core-network investors. A Light MVNO outsources switching functions and subscriber databases, focusing instead on brand affinity, fintech bundling, or retail-loyalty cross-promotions. The Mobile Virtual Network Operator market share for Light models will therefore widen as non-telecom companies, airlines, supermarkets, and online banks seek telco exposure without spectrum auctions or engineering teams.
Reseller MVNOs, the simplest layer, lease complete retail offers from host MNOs and sell under their logos, yielding razor-thin margins but near-zero capital expenditure. Service Operator MVNOs slot between Light and Full implementations, taking charge of customer care and billing while relying on the host for network and authentication. Each migration step demands bigger compliance budgets yet grants richer data ownership and tariff flexibility that ultimately lift long-run enterprise value.


By Subscriber Type: IoT Lines Accelerate
Consumer lines still dominated with 79.49% connections in 2025, but IoT-specific subscriptions are projected at 7.37% CAGR to 2031, more than twice the consumer growth pace. The Mobile Virtual Network Operator market size tethered to IoT will expand because manufacturing, logistics, and smart-city projects demand multi-network redundancy and centralized dashboards. Enterprise handset lines, negotiated in corporate fleet contracts, expand steadily, though workforce mobility changes such as hybrid working alter device counts per employee.
IoT subscriber acquisition looks unlike consumer marketing. Instead of television advertising, operators bid on global supply contracts where tens of thousands of devices ship with embedded SIMs, each yielding modest but stable monthly fees. Battery-life considerations push many projects toward NB-IoT and LTE-M, where radio modules draw minimal power. As 5G RedCap and future IoT-optimized NR releases mature, MVNOs able to aggregate spectrum slices across regions will command premium enterprise contracts.
By Application: M2M Monetizes Industrial Data
Discount voice-and-data bundles captured 31.71% of 2025 revenue as households trimmed bills. Cellular M2M revenue, however, is forecast to grow 6.93% CAGR through 2031, reflecting automated meter reading, predictive maintenance, and real-time cold-chain monitoring. The Mobile Virtual Network Operator market size attributable to M2M improves because enterprises seek single-invoice, multi-country solutions rather than piecemeal roaming add-ons.
Business-centric MVNO plans integrate unified-communications add-ons like hosted PBX and secure push-to-talk, competing against legacy MNO enterprise sales teams. Media-and-entertainment MVNOs court Gen-Z segments by zero-rating music or streaming subscriptions. Retail MVNOs piggyback on supermarket foot traffic to bundle grocery discounts with airtime. Roaming specialists thrive among frequent travelers using virtual local numbers, while migrant-focused MVNOs provide ultra-low-cost international voice to diaspora communities. Telecom-wholesale MVNOs, finally, sit behind the curtain, selling white-label network access to boutique brands that favor marketing over network operations.
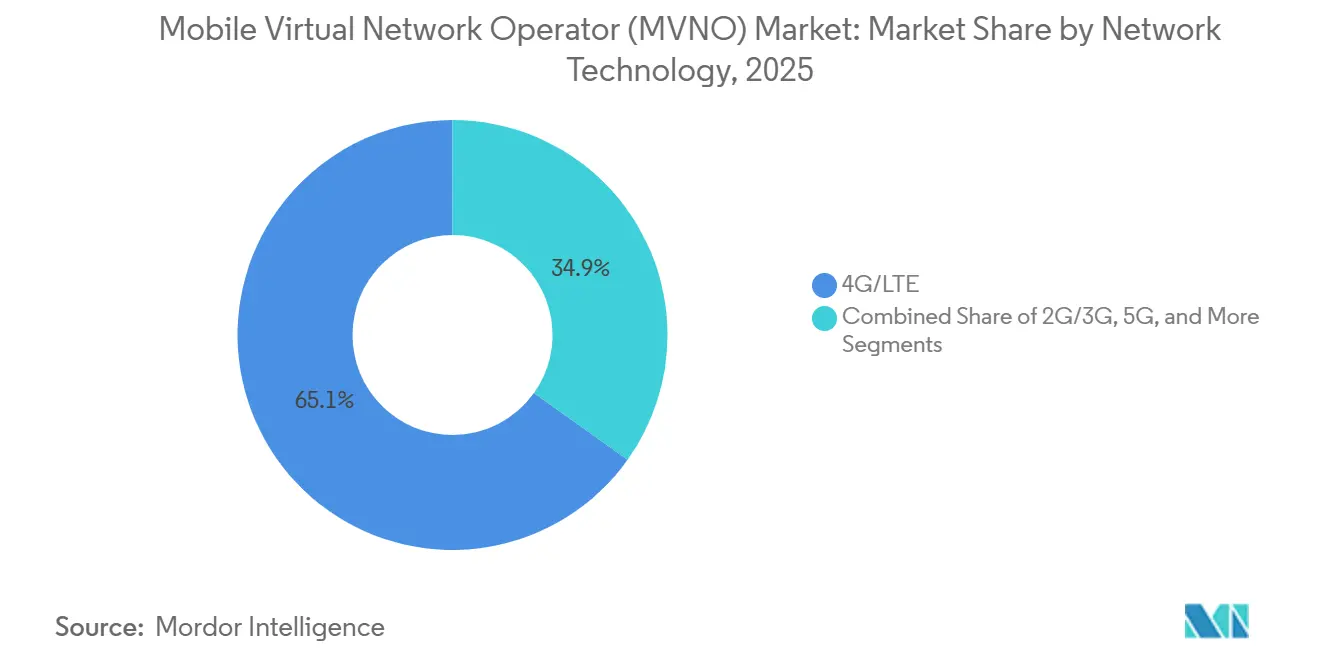
By Network Technology: 5G Unlocks Low-Latency Services
4G/LTE still covered 65.14% of aggregate connections in 2025, but 5G lines are expected to climb at a 7.89% CAGR because high-capacity mid-band spectrum reaches dense urban clusters. The Mobile Virtual Network Operator market share for 5G will therefore rise, but tariff premiums must outweigh higher wholesale access charges. Early movers bundle unlimited 5G data with device financing, pushing average revenue per user upward despite macro-economic headwinds.
Legacy 2G and 3G networks approach switch-off schedules in multiple territories, forcing MVNOs to migrate remaining feature-phone clients or risk service loss. Satellite and non-terrestrial integrations remain nascent though Starlink and AST SpaceMobile capacity trials hint at global-coverage MVNO offers for maritime or mining sectors. Whether satellite wholesale rates undercut narrow-pipe L-band incumbents remains an open question, but the technology offers a redundancy advantage that may justify premium niches.
By Distribution Channel: Digital Cuts Acquisition Costs
Online and digital-only sign-ups captured 48.65% of new activations in 2025 and are tracking a 7.23% CAGR through 2031. Self-service apps with embedded video KYC compress onboarding to under five minutes, contrasting with retail processes that require SIM packaging, cashier scans, and physical ID. The Mobile Virtual Network Operator market size captured through digital channels will expand because remote eSIM provisioning sidesteps inventory and logistics charges.
Traditional electronics retailers still matter for customers needing device guidance or top-up vouchers in cash-heavy economies. Carrier sub-brand stores showcase MNO fighter brands but also promote MVNO wholesale partners, especially when regulators demand equal shelf space. Third-party wholesalers and distributors remain vital in fragmented rural territories where storefront presence signals trust. Digital-only brands must therefore supplement apps with remote 24-hour call centers and courier-delivered plastic SIMs for subscribers whose smartphones lack eSIM compatibility.
Geography Analysis
Europe generated 34.23% of global MVNO revenue in 2025. Wholesale-access directives from BEREC compel MNOs to provide cost-oriented pricing, sustaining dozens of price-aggressive discount brands across Germany, the United Kingdom, France, Italy, and Spain. Yet with penetration high and prepaid churn elevated, organic European growth slows, driving operators toward acquisitions in Central and Eastern Europe or thematic pivots into IoT. The Mobile Virtual Network Operator market size in Europe therefore trends toward modest single-digit uplift while profitability hinges on lean cloud back-ends and bundled digital services.
Asia Pacific will post the fastest regional trajectory, with a 7.45% CAGR through 2031. India adopted MVNO licensing in 2024, and TRAI’s 2025 eSIM rules let consumers switch within hours, helping fintechs embed mobile plans in super-apps. China licensed more than 50 MVNOs by 2025, although state-owned carriers still dominate. Japan and South Korea feature mature competitive arenas, while ASEAN nations such as Indonesia and Vietnam welcome new entrants that couple data plans with entertainment streaming in local languages. Spectrum auctions favor network quality upgrades, which in turn raise wholesale capacity suitable for MVNO resale.
North America blends cable-operator MVNOs, prepaid-only brands, and IoT specialists. Comcast and Charter bundle mobile with broadband, lowering churn and capturing incremental wallet share. Wholesale access is not mandated, so negotiated terms with Verizon, AT&T, and T-Mobile hinge on traffic predictability and strategic alignment. Canada debates compulsory wholesale fees, while Mexico’s IFT adopted explicit price-cap formulas in 2024. South America grows off a smaller base; inflation-struck Brazil sees digital banks tie SIMs to current accounts, whereas Argentina’s economic swings intensify prepaid adoption. In the Middle East and Africa, migrant-targeted calling plans thrive in Gulf economies, and Kenya’s regulator green-lit MVNO entry to extend mobile money ecosystems into rural counties. Opportunities grow where national broadband plans encourage open access and spectrum-sharing frameworks.

Regulatory Landscape
Wholesale-access regulation and technical interoperability rules continue to shape MVNO entry and operating economics across major markets. In Europe, BEREC required MNOs to grant full MVNO access within 90 days of request effective 2024, compressing time-to-market for digital-first brands while tightening scrutiny on non-discriminatory wholesale processes. Canada also moved to broaden scope, with the CRTC mandating in Telecom Decision 2024-238 that incumbents remove limitations tied to enterprise and IoT services from their wholesale MVNO access tariffs, which directly affects MVNOs selling multi-line enterprise and managed IoT connectivity.
Regulators are also codifying operational requirements that influence multi-host and eSIM-based models. In India, TRAI issued November 2024 recommendations that permit Access Service VNOs to take connectivity from multiple Network Service Operators for wireline access with logical partitioning safeguards, reflecting a broader emphasis on security and separation when virtual operators span more than one host. In May 2026, the Nigerian Communications Commission (NCC) published Draft Business Rules for Mobile Virtual Network Operations (Version 2.0) to clarify licensing scope, eSIM onboarding, and HNO-MVNO integration expectations. This signals a shift from relying only on commercial wholesale negotiation toward defined onboarding and integration rules that can reduce launch friction, even as compliance demands increase.
Competitive Landscape
In the telecommunications landscape, no single operator commands more than a 5% share globally, resulting in a market concentration score of 3. While TracFone, Lycamobile, and Lebara have carved out niches as prominent discount brands, they are increasingly engaged in price competition. This dynamic intensifies as major Mobile Network Operators (MNOs) aggressively promote their own sub-brands. Meanwhile, bank-branded Mobile Virtual Network Operators (MVNOs) are capitalizing on extensive know-your-customer databases to upsell micro-loans and facilitate cross-border remittances, highlighting the convergence of finance and telecommunications.
Enterprise-IoT specialists, such as Truphone, are expanding their positions by competing on software-orchestration portals and improving global roaming footprints. Their offerings resonate with multinationals seeking SIM consistency across large truck fleets and critical medical devices. Across Europe, niche providers focusing on ethnic communities are gaining traction, supported by multilingual call centers and community sponsorships that strengthen cultural connection in telecom.
Operators are increasingly differentiating themselves through cloud adoption, with a keen focus on continuous-integration pipelines and AI-driven care solutions. The integration of chatbots has proven pivotal, adeptly handling tier-1 queries. This not only alleviates the workload on human agents, allowing them to tackle more intricate disputes, but also significantly reduces the mean time to answer. The end result? A marked improvement in net promoter scores, a key metric of customer satisfaction. However, the dynamics of customer loyalty are shifting. The advent of eSIM onboarding is reshaping churn dynamics, as the associated switching costs dwindle to nearly zero. This newfound fluidity in customer movement is prompting operators to rethink their strategies.
Mobile Virtual Network Operator (MVNO) Industry Leaders
TracFone Wireless, Inc.
Tesco Mobile Limited
Lycamobile Group
Virgin Mobile (Virgin Media O2)
Giffgaff Limited
- *Disclaimer: Major Players sorted in no particular order

Market Opportunities and Future Outlook
Digital onboarding and cloud enablement create near-term whitespace for new MVNO propositions that can be launched and iterated without heavy network-core investment. With online and digital-only sign-ups accounting for 48.65% of new activations in 2025, operators that standardize eSIM-led activation, automated KYC, and cloud billing can compete on speed of product packaging, including content, insurance, or fintech bundles, rather than storefront footprint. The cost and margin picture still depends on wholesale terms, so opportunities concentrate in markets where regulators have recently tightened wholesale access obligations, including Europe under BEREC timelines effective 2024, and where tariff scope has been broadened for enterprise and IoT use cases, as reflected in Canada after CRTC Telecom Decision 2024-238.
Enterprise and IoT connectivity remains a structural expansion lane for MVNOs that can aggregate multi-country footprints and provide centralized management, particularly where compliance and integration requirements are becoming more defined. Ericsson counted 3.2 billion cellular IoT connections worldwide in 2025, supporting a larger addressable base for MVNOs offering global SIMs, lifecycle-long contracts, and multi-network resiliency through diversified host arrangements. Taken together, the evolving frameworks in India (TRAI November 2024 recommendations on multi-NSO connectivity with logical partitioning) and Nigeria (NCC May 2026 draft business rules covering eSIM onboarding and HNO-MVNO integration) point to where enablement platforms and new entrants can align offerings with regulator-defined guardrails. This reduces integration uncertainty for niche launches, including bank-branded and retailer-led MVNO programs.
Recent Industry Developments
- May 2026: The Nigerian Communications Commission (NCC) published Draft Business Rules for Mobile Virtual Network Operations (Version 2.0) to clarify licensing scope, eSIM onboarding, and host network operator (HNO)-MVNO integration requirements. The formalization of operational expectations can shorten onboarding cycles for new MVNO launches while increasing emphasis on technical and compliance readiness.
- March 2026: Virgin Media O2 extended a five-year partnership with Ericsson, positioning Ericsson as a primary RAN partner to power a majority of Virgin Media O2s UK radio network. Larger-scale RAN modernization and vendor-led network evolution can improve wholesale capacity characteristics for MVNOs using the host network, while also reinforcing the host MNOs leverage in commercial negotiations.
- November 2024: The CRTC issued Telecom Decision 2024-238, directing incumbents to remove restrictions tied to enterprise and IoT services from their wholesale MVNO access tariffs. This widens the practical scope for MVNOs to address managed IoT and enterprise mobility use cases under regulated wholesale constructs, supporting more specialized MVNO business models beyond consumer prepaid.


Research Methodology Framework and Report Scope
Market Definition and Coverage
This market covers the revenue earned by MVNOs from providing mobile connectivity and related services to end users, where capacity is leased from licensed mobile network operators and the MVNO manages pricing, packaging, and customer billing.
Scope exclusions: We exclude handset resale revenue, pure Wi-Fi only connectivity providers, and mobile operator sub-brands whose results are fully consolidated into the host operator.
Segmentation Overview
- By Deployment Model
- Cloud
- On-Premise
- By Operational Mode
- Reseller
- Service Operator
- Full MVNO
- Light / Brand MVNO
- By Subscriber Type
- Consumer
- Enterprise
- IoT-Specific
- By Application
- Discount
- Business
- Cellular M2M
- Media and Entertainment
- Retail
- Roaming
- Migrant
- Telecom Wholesale
- By Network Technology
- 2G/3G
- 4G/LTE
- 5G
- Satellite/NTN
- By Distribution Channel
- Online/Digital-Only
- Traditional Retail Stores
- Carrier Sub-Brand Stores
- Third-Party/Wholesale
- By Geography
- North America
- United States
- Canada
- Mexico
- South America
- Brazil
- Argentina
- Colombia
- Rest of South America
- Europe
- Germany
- United Kingdom
- France
- Italy
- Spain
- Russia
- Rest of Europe
- Asia Pacific
- China
- India
- Japan
- South Korea
- ASEAN
- Rest of Asia Pacific
- Middle East
- Saudi Arabia
- United Arab Emirates
- Turkey
- Rest of Middle East
- Africa
- South Africa
- Nigeria
- Rest of Africa
- North America
Data Sources, Market Sizing, and Validation
Desk Research
Desk work starts by building a fact base on mobile subscriptions, traffic growth, and telecom service pricing, and then mapping it to MVNO activity. Public sources such as the ITU, OECD broadband and telecom indicators, national telecom regulator publications, and World Bank digital adoption data help keep definitions consistent across countries.
To connect these signals to revenue, we review operator annual reports, investor decks, and press releases for wholesale agreements and subscriber disclosures, and we cross-check with reputable telecom association updates. Where needed, paid subscriptions for company financials and intelligence, news and financials, and patent databases are used to confirm corporate structure, service launches, and product positioning. We also look at spectrum and wholesale access policy notes from regulators, which helps indicate where MVNOs can scale.
The sources listed here are illustrative only, and many other public references are used to collect data, validate assumptions, and clarify gaps.
Primary Interviews and Surveys
Primary work is used to pressure-test wholesale pricing logic, ARPU ranges, and the share of prepaid versus postpaid plans that MVNOs are actually selling in each region. We speak with a mix of MVNO executives, wholesale and roaming specialists, and channel-side leaders, and views are balanced across APAC, EMEA, and the Americas so regional regulation and host-network terms are not overgeneralized.
Distribution of primary research fieldwork respondents
| Company type | Respondent position | Region |
|---|---|---|
| Top tier: 35% | CXOs: 20% | APAC: 50% |
| Mid tier: 43% | Functional/Unit leaders: 25% | EMEA: 29% |
| Smaller Players: 22% | Managers: 55% | Americas: 21% |
Market-Sizing & Forecasting
The model begins with a top-down build where country-level mobile service revenue pools are reconstructed and then filtered through the MVNO share that is feasible under local wholesale access rules. Results are then corroborated using selective bottom-up checks such as sampled MVNO ARPU times subscriber bases in key countries, along with channel checks on plan pricing and wholesale cost ranges, which helps correct for outliers.
Inputs that matter most include MVNO subscriber counts where disclosed, prepaid versus postpaid mix, ARPU progression linked to data consumption trends, the spread between retail plan pricing and wholesale access pricing, and the timing of 4G and 5G coverage expansion that changes plan value. For forecasting, we primarily use scenario analysis supported by expert consensus, where adoption and pricing paths are flexed based on regulation changes, competitive intensity, and macro demand for low-cost plans. When disclosures are missing, gaps are handled by using proxy penetration rates from comparable markets with similar regulatory conditions and income levels, and then re-checked with interview feedback before finalizing totals.
Data Validation & Update Cycle
Estimates are validated through triangulation across independent signals such as mobile service revenue totals, subscription and traffic trends, and whether the implied ARPU sits inside realistic market ranges. If a country output moves sharply without a matching driver, the assumptions are reviewed, peer compared, and corrected through a second analyst pass before sign-off.
The report is refreshed annually, and interim updates are made when major events occur, including new wholesale access regulation, large MVNO consolidation, or material pricing shifts. Before delivery, we run a final check to ensure the latest public releases and relevant market events are reflected in the numbers.
Mordor Intelligence's Mobile Virtual Network Operator Mvno Market Size Measured Against Other Published Estimates
Published MVNO market values do not always line up because the revenue boundary is not handled the same way across studies, and because base years and currency timing can differ. In our work, the main drivers behind gaps are usually what is counted as MVNO revenue versus adjacent telecom revenue, plus how ARPU and subscriber growth are projected when plan pricing is changing.
By checking wholesale access scope rules and refreshing ARPU and subscriber assumptions with telecom experts, Mordor Intelligence keeps the value tied to MVNO-billed service revenue and avoids blending in handset sales or host-operator sub-brand revenues. Some estimates also lean on faster or slower pricing uplift paths, or apply a single global growth rate that does not reflect region-specific regulation and MVNO enablement maturity.
Benchmark comparison
| Source | Market Size | Gaps in Research Methodology |
|---|---|---|
| Mordor Intelligence | USD 79.97 B (2026) | |
| Global Consultancy A | USD 94.80 B (2025) | Uses a different base year and can capture broader revenue pools by mixing multiple MVNO operating models and contract types without clearly separating MVNO-billed services from adjacent telecom revenues across countries. |
| Industry Publisher B | USD 93.63 B (2025) | Anchors the model on a 2025 base and applies a smoother global growth curve, which can over-average markets where wholesale pricing and regulatory access change sharply by region and year. |
The table shows that timing and scope choices explain a large part of the spread, even before forecast assumptions are applied. When the demand pool is built from clear subscription and ARPU logic and then cross-checked against wholesale access conditions, the output becomes easier to reproduce and easier to defend in planning discussions.


Key Questions Answered in the Report
How large is the Mobile Virtual Network Operator market in 2026?
The Mobile Virtual Network Operator market size stood at USD 79.97 billion in 2026.
What CAGR is expected for MVNO revenue through 2031?
The sector is forecast to post a 6.48% CAGR to reach USD 109.48 billion by 2031.
Which region will grow the fastest through 2031?
Asia Pacific leads with a projected 7.45% CAGR, driven by India, China, and ASEAN demand.
Why are cloud platforms preferred for MVNO enablement?
Cloud billing and core-network functions scale instantly, cutting capex and accelerating product launches during subscriber spikes.
What factor most threatens MVNO margins?
Host-network wholesale fee increases and fighter-brand price wars compress gross margins, especially in mature European markets.
How quickly are 5G MVNO connections expanding?
5G lines are forecast to rise at a 7.89% CAGR as low-latency applications and premium data bundles gain traction.
Page last updated on:


