
Market Overview
| Study Period | 2020 - 2031 |
|---|---|
| Forecast Data Period | 2026 - 2031 |
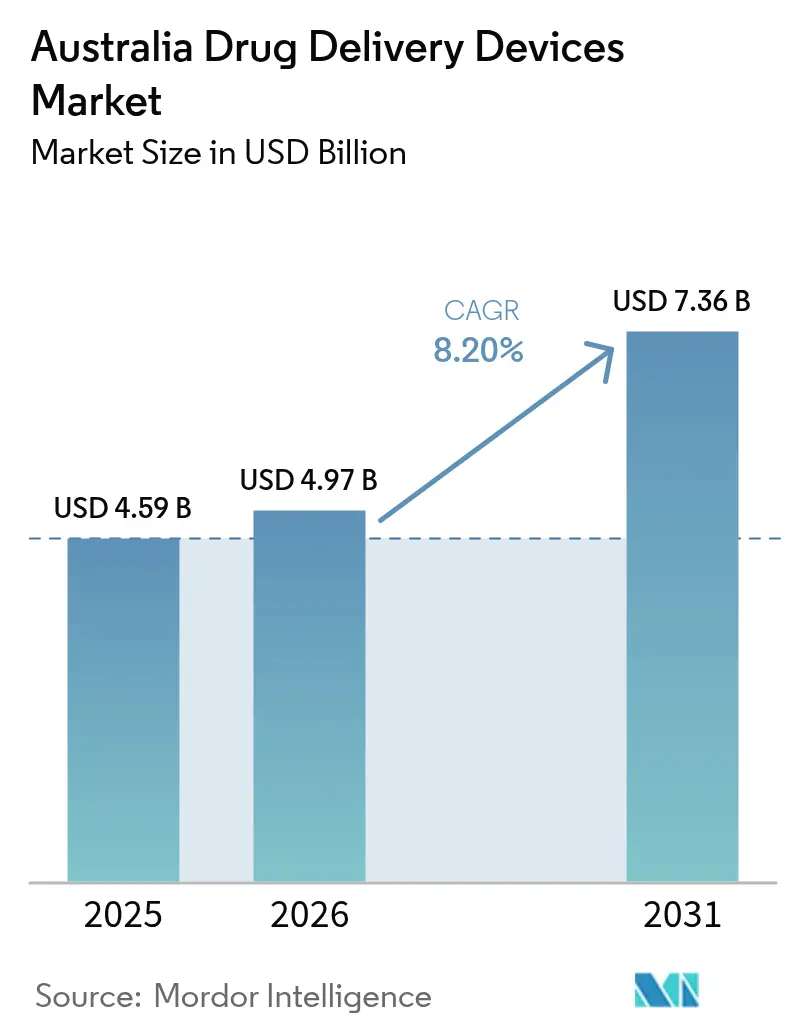
| Base Year Market Size (2025) | USD 4.59 Billion |
| Market Size (2026) | USD 4.97 Billion |
| Market Size (2031) | USD 7.36 Billion |
| Growth Rate (2026 - 2031) | 8.20 % |
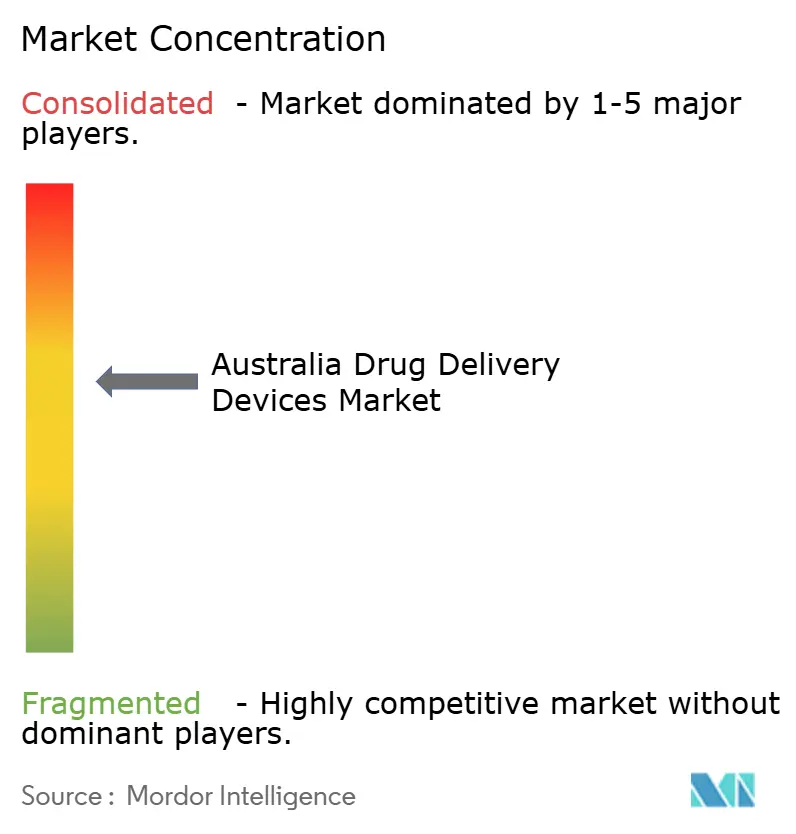
| Market Concentration | Medium |
Major Players *Disclaimer: Major Players sorted in no particular order Image © Mordor Intelligence. Reuse requires attribution under CC BY 4.0. | |
Australia Drug Delivery Devices Market Analysis by Mordor Intelligence
Australia drug delivery devices market size in 2026 is estimated at USD 4.97 billion, growing from 2025 value of USD 4.59 billion with 2031 projections showing USD 7.36 billion, growing at 8.20% CAGR over 2026-2031. Growth is underpinned by an aging population, a rising chronic-disease burden, and widespread use of the Pharmaceutical Benefits Scheme (PBS), which dispensed medicines to nearly 70% of residents during 2022.[1]Australian Bureau of Statistics, “Health Conditions and Risks,” abs.gov.au Government programs that shift care from hospitals to homes, such as Victoria’s Better at Home initiative, further expand demand for user-friendly devices.[2]Victorian Department of Health, “Better at Home Initiative,” health.vic.gov.auIntensifying R&D around microneedle patches, connected injectors, and orally delivered biologics is driving product innovation, while digital health investments are improving data flow and remote monitoring capability. Against this backdrop, manufacturers face higher Therapeutic Goods Administration (TGA) fees and strict combination-product rules that lift compliance costs.
Key Report Takeaways
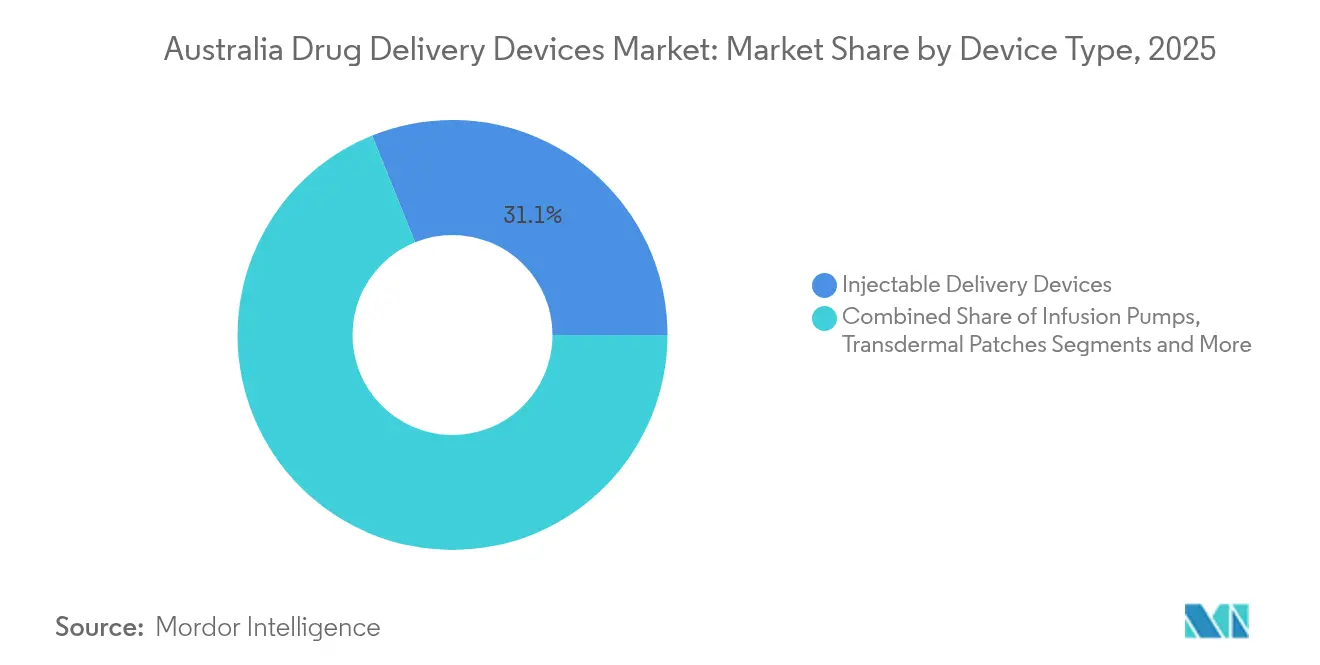
- By device type, injectable delivery devices led with 31.10% of the Australia drug delivery devices market share in 2025; transdermal patches are projected to expand at a 11.92% CAGR through 2031.
- By route of administration, injectables captured 44.10% of the Australia drug delivery devices market share in 2025, whereas oral mucosal systems are set to grow at a 10.05% CAGR during 2026-2031.
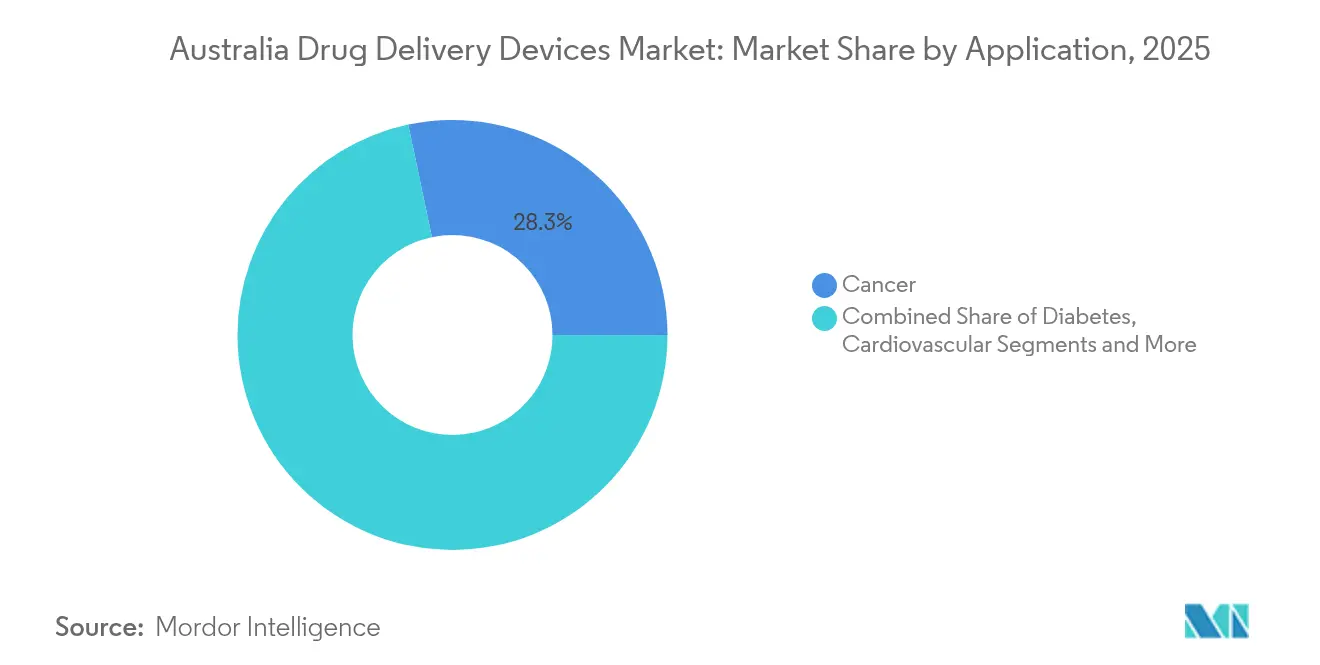
- By application, cancer therapy accounted for a 28.30% share of the Australia drug delivery devices market size in 2025, while diabetes therapies record the highest expected CAGR at 10.45% to 2031.
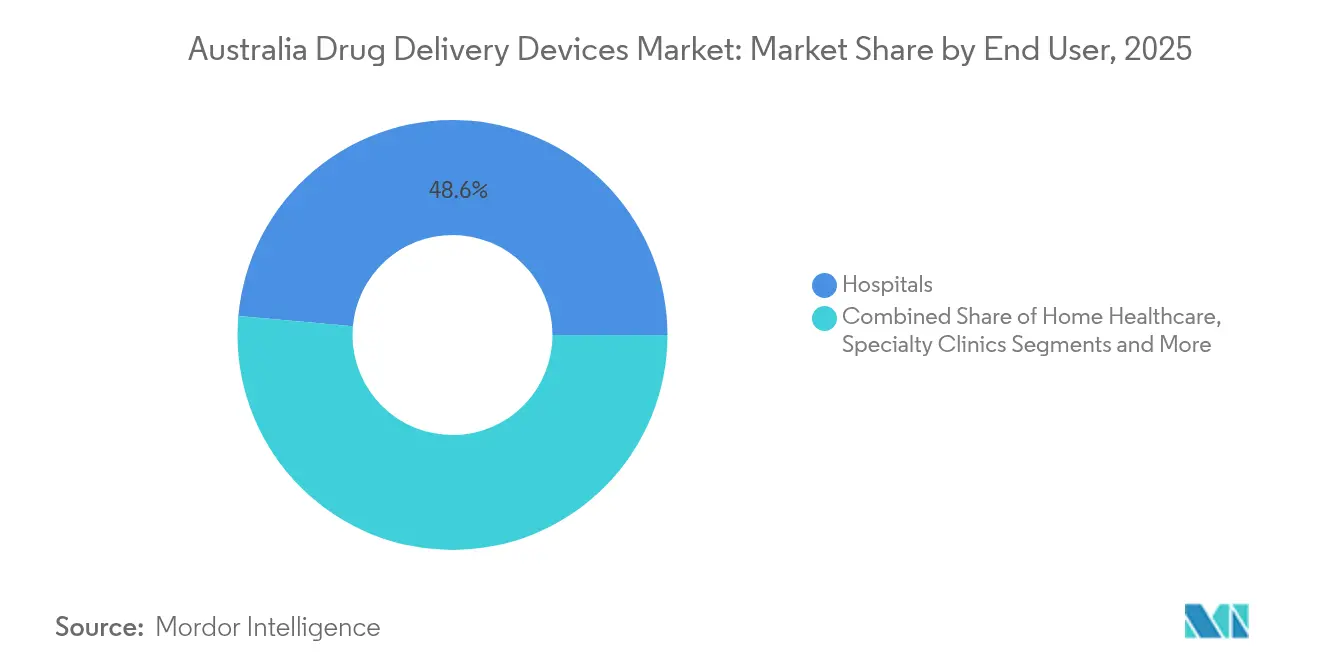
- By end user, hospitals commanded 48.60% of the Australia drug delivery devices market size in 2025; home healthcare settings are on track for an 11.05% CAGR over 2026-2031.
Note: Market size and forecast figures in this report are generated using Mordor Intelligence’s proprietary estimation framework, updated with the latest available data and insights as of 2026.
Australia Drug Delivery Devices Market Trends and Insights
Drivers Impact Analysis*
| Driver | (~) % Impact on CAGR Forecast | Geographic Relevance | Impact Timeline |
|---|---|---|---|
| High burden of chronic diseases and ageing population | +2.8% | National; strongest in Victoria and New South Wales | Long term (≥ 4 years) |
| Government & industry support for at-home care and remote drug delivery | +2.1% | National; early adoption in Victoria and Queensland | Medium term (2-4 years) |
| Rising penetration of biosimilars and targeted therapies | +1.5% | National; concentrated in metro areas | Medium term (2-4 years) |
| Digital health integration with connected injectors and pumps | +1.2% | National; early uptake in urban centres | Short term (≤ 2 years) |
| Community-pharmacy vaccination programs that foster self-injection | +1.0% | National; higher penetration in cities | Medium term (2-4 years) |
| Accelerated pipeline drugs and TGA fast-track pathways | +0.8% | National | Short term (≤ 2 years) |
| Source: Mordor Intelligence | |||
High Burden of Chronic Diseases and Ageing Population
Australia’s 1.3 million people living with diabetes in 2024 generated AUD 3.9 billion in direct health spending aihw.gov.au. Three-quarters of adults were dispensed at least one PBS medicine, and more than 85% of those with chronic conditions required ongoing pharmacotherapy.[1]Australian Bureau of Statistics, “Health Conditions and Risks,” abs.gov.auAge-related physiological changes alter drug absorption and clearance, heightening demand for delivery formats that optimise dosing precision and safety. Manufacturers that tailor devices to geriatric needs—larger buttons, audible cues, and connected adherence alerts—stand to gain as the senior cohort expands.
Government and Market Players Support for At-home Care & Remote Drug Delivery
Victoria’s Better at Home program channels AUD 698 million into virtual and in-home healthcare, serving more than 15,000 people a year.[2]Victorian Department of Health, “Better at Home Initiative,” health.vic.gov.au Queensland added AUD 27 million for similar services in its 2024-25 budget. Hospital-at-home models have lowered care costs by 30% while maintaining or improving outcomes, leading payers to reimburse home episodes at inpatient rates commonwealthfund.org. These policies create fertile ground for self-use injectors, wearable pumps, and connected inhalers that help patients manage therapy outside acute facilities.
Rising Penetration of Biosimilars and Targeted Therapies Requiring Novel Delivery Formats
Novartis opened a dedicated radioligand-therapy plant in 2024, underscoring demand for precise oncology delivery technologies. Researchers at the University of Sydney advanced an oral insulin tablet that releases drug only in response to blood-glucose changes, potentially displacing subcutaneous injections for many patients.[3]University of Sydney, “Nanotech Opens Door to Future of Insulin Medication,” sydney.edu.au As biologics and conjugated molecules enter late-stage pipelines, innovators are redesigning delivery platforms to maintain molecule stability, handle high viscosity, and improve patient acceptance.
Digital Health Integration with Connected Injectors & Pumps
The National Digital Health Strategy (2023-2028) prioritises FHIR-based data standards and pledges AUD 325.7 million to upgrade e-prescribing, medication management, and device interoperability. Wider use of My Health Record supports real-time adherence tracking and remotely managed dose titration. Technology forums such as the 2025 C3.0 summit place connectivity, cybersecurity, and clinical governance at the centre of drug-device innovation.
Stringent TGA Combination-Product Compliance Costs
Application fees for new chemical entities included in a device run to AUD 18,872, with evaluation charges of AUD 76,055 and annual levies topping AUD 1,500 for Class III devices. These rising costs weigh heavily on start-ups and academic spin-outs, delaying market entry and, in some cases, redirecting R&D overseas.
Needlestick Injury Litigation and Risks Associated with Various Devices
Despite falling numbers of people injecting drugs, incidence of blood-borne infections linked to reused needles has risen, driving higher liability risk for device manufacturers. Government guidelines now demand stricter infection-control protocols and reporting, increasing compliance overhead for hospitals and aged-care facilities.
*Our forecasts treat driver/restraint impacts as directional, not additive. The impact forecasts reflect baseline growth, mix effects, and variable interactions.
Segment Analysis
By Device Type: Injectable Devices Lead While Transdermal Patches Surge
Injectable systems held 31.10% of the Australia drug delivery devices market share in 2025, a position cemented by growing biologics use and rising chronic-disease prevalence. Connected pen injectors that transmit dosage logs to clinician dashboards are gaining traction among endocrinologists and rheumatologists. The Australia drug delivery devices market size attached to transdermal patches is projected to grow at 11.92% CAGR between 2026 and 2031, spurred by microneedle breakthroughs that improve payload capacity without compromising comfort. Collaboration between the Transdermal and Transmucosal Drug Delivery Research Group and Bionyeri Pty Ltd created a microneedle patch for acute pain episodes, illustrating domestic innovation.
Infusion-pump makers are integrating Bluetooth and closed-loop algorithms in anticipation of a national subsidy for insulin pumps proposed to begin mid-2025. Implantables, ocular inserts, and nasal devices round out the portfolio, each targeting niche clinical requirements. A recent health-technology assessment found intrathecal pumps improve quality of life for refractory cancer pain, though upfront costs remain high.



By Route of Administration: Injectables Dominate While Oral Mucosal Delivery Accelerates
Injectables delivered 44.10% of 2025 revenue within the Australia drug delivery devices market. High therapy adherence rates and predictable pharmacokinetics keep parenteral administration the default for many biologics. Inhalation devices account for a sizeable fraction, supported by ongoing upgrades to dry-powder carriers for obstructive-airway disease. The oral-mucosal channel is forecast to post a 10.05% CAGR as developers exploit sublingual routes to bypass first-pass metabolism.
Transdermal technologies continue to benefit from work on novel permeation enhancers and herbal patches that reduce gastrointestinal side effects. Nasal formulations appeal to neurologists for rapid central-nervous-system access; nanoparticle-gel hybrids recently showed 86%-96% encapsulation efficiency, signalling commercial promise.
By Application: Cancer Leads While Diabetes Shows Strongest Growth
Cancer uses generated 28.30% of 2025 revenue, reflecting a need for precise, often multi-modality dosing. Bacterial nanotechnology that steers chemotherapeutics to tumours exemplifies next-generation targeting approaches. The Australia drug delivery devices market size attributed to diabetes therapies is on track for a 10.45% CAGR, driven by automated insulin delivery and continuous-glucose-monitoring integration. Atmospheric-pressure studies confirm device durability during air travel, an important consideration for Australia’s mobile population. Cardiovascular, infectious-disease, and paediatric segments also add incremental demand, with RSV preventives already lowering hospitalisations in pilot states.
By End User: Hospitals Dominate While Home Healthcare Expands Rapidly
Hospitals absorbed 48.60% of total 2025 sales, buoyed by AUD 9.3 billion in fresh state-level hospital funding and nine new facilities slated to open by 2026. Ambulatory surgical centres, known for day-case procedures, are quick to adopt fast-onset anaesthetic patches and programmable infusion pumps to keep discharge times low.
Homecare remains the fastest-growing channel with an 11.05% projected CAGR. The Better at Home program and equivalent telehealth funding streams promote self-managed therapy using connected devices that alert nurses to out-of-range metrics. Victoria’s hospital-at-home scheme demonstrated 30% cost reductions and equal or better outcomes compared with inpatient stays. Specialty clinics and field-based nursing services leverage similar technologies when treating rheumatology and oncology patients outside tertiary centres.
Geography Analysis
Urban states dominate demand for sophisticated platforms, yet regional areas increasingly benefit from digital-health advances. Victoria’s AUD 698 million commitment to remotely delivered care places the state at the forefront of connected treatment models, driving higher per-capita adoption of wearable injectors. Queensland’s AUD 28.9 billion health budget, including AUD 27 million for virtual-care initiatives, underlines northern states’ pursuit of similar tools.
Nationwide, the Australia drug delivery devices market benefits from FHIR-compliant data exchange that enables tele-consultations even in sparsely populated areas. The strategy’s focus on secure pharmacovigilance systems means new devices must integrate seamlessly with My Health Record, a requirement shaping supplier selection criteria for rural pharmacies.
Western Australia and Queensland’s infant RSV programs highlight the growing role of state vaccination policies in shaping device adoption. Long-acting monoclonal injections administered through community clinics reduced hospital admissions costing as much as AUD 17,120 per child. As similar preventive measures roll out nationwide, demand for paediatric-friendly autoinjectors and low-dead-space syringes is rising.
Regulatory Landscape
Drug delivery devices and drug-device combination products in Australia are overseen by the Therapeutic Goods Administration (TGA) under the Therapeutic Goods Act 1989 and related instruments including the Therapeutic Goods (Medical Devices) Regulations 2002. TGA boundary and combination product rules classify products by primary mode of action and intended purpose, so many integral combinations (including prefilled syringes and certain inhalers) can be regulated as medicines while still requiring device evidence aligned to the Essential Principles for safety and performance.
A major compliance shift is the staged implementation of Unique Device Identification (UDI) requirements for medical devices, supported by associated legislative measures and TGA guidance. The TGA also outlined a Consent to Supply process for UDI-related Essential Principles gaps, creating an interim pathway for some sponsors while reinforcing traceability and post-market accountability expectations for higher-risk device categories used in parenteral, infusion, and other delivery settings.
Value Chain Analysis
The value chain spans drug formulation or fill-finish (including prefilled formats), device design and manufacturing (syringes, pens, autoinjectors, pumps, inhalers, patches, implants), sterilization and packaging, and sponsor-led regulatory and quality functions that support ARTG inclusion and ongoing post-market obligations. Australia remains heavily reliant on imported medical technology, so upstream inputs and finished-device availability are exposed to global component constraints (such as electronics and printed circuit boards), longer lead times, and higher inventory buffers, which can be especially relevant for connected injectors, wearable pumps, and electronically enabled inhalation systems.
Downstream, distribution runs through national wholesalers, hospital and health-service procurement channels, community pharmacy (including vaccination and chronic disease dispensing workflows), and home healthcare providers aligned with hospital-at-home and virtual care programs. Market access bottlenecks concentrate around regulatory documentation readiness (technical files, conformity evidence, and combination product classification) and reimbursement and procurement decision cycles. Where domestic capability building reduces supply risk for critical delivery platforms, initiatives such as the National Reconstruction Fund Corporation can shape supplier investment priorities.
Competitive Landscape
The Australia drug delivery devices market comprises multinational pharmaceutical-device hybrids, med-tech specialists, and nimble start-ups. Strategic alliances dominate: Aptar Digital Health’s 2024 tie-up with SHL Medical marries platform software with wearable injectors to streamline self-administration workflows. Domestic universities frequently license nanoformulation breakthroughs to industry partners, shortening the bench-to-bedside pathway.
Nanotechnology for oral biologics, exemplified by the University of Sydney’s glucose-responsive insulin tablet, offers disruptive potential that could erode the long-established injectable segment. At the same time, incumbents defend share by launching smaller, more discreet pumps; Tandem Diabetes Care plans to file for Australian approval of its tubeless Mobi system after successful US debut, banking on CGM integration to sway endocrinologists.
White-space remains in implantables for site-specific chemotherapy and in aerosolised formulations to treat systemic disease via the lung. Companies exploring AI-driven dose timing and patient-behaviour analytics aim to shift competition from hardware attributes toward predictive-care ecosystems, signalling continued evolution of the competitive matrix.
Australia Drug Delivery Devices Industry Leaders
Novartis AG
GlaxoSmithKline Plc
Becton, Dickinson and Company
CSL Limited
Novo Nordisk A/S
- *Disclaimer: Major Players sorted in no particular order

Market Opportunities and Future Outlook
The shift of care from hospitals to the home creates clear whitespace for self-administered and remotely monitored delivery formats, including connected pens, wearable injectors, and infusion systems that can align with national interoperability priorities. Australia has active policy and funding signals that support this direction, including the National Digital Health Strategy (2023-2028) and its focus on FHIR-based standards, along with upgrades to e-prescribing and medication management. This increases the value of devices that can securely share dosing and adherence data with clinical workflows.
On the supply side, traceability and quality system demands are tightening through the UDI rollout, encouraging sponsors and manufacturers to modernize labeling, data governance, and post-market surveillance processes alongside device upgrades. Local manufacturing and translation efforts also present an opportunity where they intersect with oncology and complex therapies. OncoSil Medical reported completing manufacturing validation cycles with partner Cyclotek and investing in specialized production equipment to establish scalable Australian manufacturing capability for its device, highlighting a pathway for device-led therapies that can shorten supply chains while aligning with local health-system procurement and adoption discussions.
Recent Industry Developments
- January 2026: BD expanded its collaboration with Ypsomed to develop a 5.5 mL version of the BD Neopak XtraFlow Glass Prefillable Syringe intended to be compatible with the YpsoMate 5.5 platform. The company’s stated focus is on large-volume, high-viscosity biologics delivery, reinforcing development activity around next-generation self-injection formats relevant to Australia as biologics and GLP-1 use increases.
- November 2025: Bioxyne Limited launched the Que Medical Inhalation Device (QMID) in Australia for medical cannabis liquid inhalants following Therapeutic Goods Administration import approval. This added a new, regulated inhalation device option to the local market and highlighted how TGA access pathways can accelerate commercialization for niche drug-device delivery systems.
- September 2024: Vivani Medical received regulatory approval to initiate a first-in-human clinical trial of its NanoPortal GLP-1 (exenatide) implant in Australia. The trial authorization points to ongoing clinical pipeline activity for implantable delivery platforms and supports longer-duration dosing strategies for chronic therapies.


Research Methodology Framework and Report Scope
Market Definition and Coverage
For this report, the market is defined as revenue earned from commercially sold drug delivery devices in Australia that administer therapeutic agents to the human body, with value captured at the first point of sale within the country.
Scope exclusions: Standalone dosage forms and bulk pharmaceutical ingredients are excluded from this market size.
Segmentation Overview
- By Device Type
- Injectable Delivery Devices
- Inhalation Delivery Devices
- Infusion Pumps
- Transdermal Patches
- Implantable Drug Delivery Systems
- Ocular Inserts & Delivery Implants
- Nasal & Buccal Delivery Devices
- By Route of Administration
- Injectable
- Inhalation
- Transdermal
- Oral Mucosal (Buccal & Sublingual)
- Ocular
- Nasal
- By Application
- Cancer
- Cardiovascular
- Diabetes
- Infectious Diseases
- Other Applications
- By End User
- Hospitals
- Ambulatory Surgical Centres
- Home Healthcare Settings
- Specialty Clinics
- Other End Users
Data Sources, Market Sizing, and Validation
Desk Research
Desk work started by aligning the market definition to how drug delivery devices are regulated and purchased in Australia, then collecting the most consistent public series that reflect demand and usage. We referenced sources such as the Australian Bureau of Statistics for population and age structure, the Australian Institute of Health and Welfare for disease burden and care patterns, and the Therapeutic Goods Administration for device and product registration signals.
To translate demand drivers into an addressable device market, we reviewed Medicare and PBS related publications for treatment setting shifts, alongside peer-reviewed clinical journals that report administration routes and adherence outcomes. Context was supported with company annual reports, investor presentations, association websites, and reputed press coverage. In a limited way, we also used paid subscriptions for company financials and news screening, and to check relevant patent filing activity where device innovation can influence adoption. These desk sources are illustrative and not exhaustive, and many other references were used for data collection, validation, and clarification.
Primary Interviews and Surveys
Primary work focused on validating what the desk sources cannot fully show, specifically the on-ground mix shift across delivery routes and how pricing moves with device features, reimbursement, and care setting. We spoke with a spread of stakeholders, including manufacturers, distributors, hospital procurement, clinicians, and homecare-focused channels, and cross-checked inputs across major Australian states to avoid over-relying on a single demand pocket.
Distribution of primary research fieldwork respondents
| Company type | Respondent position |
|---|---|
| Top tier: 34% | CXOs: 14% |
| Mid tier: 52% | Functional/Unit leaders: 39% |
| Smaller Players: 14% | Managers: 47% |
Market-Sizing & Forecasting
The market size was first built using a top-down approach, reconstructing Australia-level demand pools from care utilization and administration route patterns, then translating that demand into device spending using indicative pricing bands and replacement cycles. For corroboration, we ran selective bottom-up approximations for a few high-weight device groups using sampled volumes and average selling prices, followed by channel checks to confirm that totals remain realistic.
Key inputs used in the model include the treated patient base for major chronic conditions, the share of therapies administered by injection, inhalation, transdermal, or infusion, typical device replacement frequency, public and private care setting split, and observed pricing progression linked to feature upgrades and training needs. Where a variable was not available consistently, we used a conservative proxy first and then adjusted it based on interview feedback and cross-checks against import or availability signals.
For forecasting, scenario analysis was applied around adoption speed and pricing, since policy changes and care shifting to home settings can move demand faster than a simple trendline. Final growth paths were anchored to expert consensus on how quickly route mix changes, and then tested to ensure implied per-capita device spend remains sensible over time.
Data Validation & Update Cycle
Outputs were checked through triangulation across multiple indicators, with the main focus on catching inconsistencies in volume logic, pricing steps, and sudden mix shifts that do not align with clinical practice. Variance checks were run across time series, and outliers were reviewed again by a second analyst before sign-off, which reduces the risk of a single assumption drifting the total.
The model is refreshed annually, and interim updates are triggered when material events occur, such as reimbursement changes, major regulatory actions, or noticeable pricing resets in widely used devices. Before delivery, we complete a fresh pass on the most sensitive inputs so clients receive an updated view grounded in the latest public and interview-backed signals.
Mordor Intelligence's Australia Drug Delivery Devices Market Estimate Compared With Other Published Estimates
Published market values for Australia drug delivery devices can vary widely, even when the topic sounds identical, because the included device list and the counted revenue point are not always the same. Differences also show up when one estimate leans heavily on therapy volumes, while another uses a broader medical devices spend pool.
Mordor Intelligence's scope excludes consumable pharmaceuticals, such as the drug itself inside a prefilled format, which keeps the sizing tied to device revenue at the first point of sale in Australia rather than total therapy spend. The spread also comes from how delivery routes are grouped, whether outpatient and homecare usage is explicitly modeled, and how price progression is handled when smart features and training requirements change the average selling price over time.
Benchmark comparison
| Source | Market Size | Gaps in Research Methodology |
|---|---|---|
| Mordor Intelligence | USD 4.59 B (2025) | |
| Industry Database A | USD 7.39 B (2025) | Uses a wider device universe that appears to bundle additional delivery system categories and related revenue lines, which lifts the 2025 total versus a device-only, first-sale measure. |
| Research Publisher B | USD 1.20 B (2023) | Likely applies a narrower product set and earlier base year, and may not fully capture higher value infusion and inhalation device spending across hospital and homecare settings. |
The table shows that the gap is mainly explained by what is counted as a drug delivery device and whether adjacent revenue lines are included. By keeping the scope device-centric, tying totals to measurable demand indicators, and then checking the outputs with practitioner and channel feedback, the final number stays transparent and repeatable when the same steps are applied again.


Key Questions Answered in the Report
What is the current size of the Australia drug delivery devices market?
The market is worth USD 4.97 billion in 2026 and is forecast to reach USD 7.36 billion by 2031.
Which device category leads in Australia?
Injectable delivery systems hold 31.10% of 2025 revenue, reflecting their pivotal role in chronic-disease management.
How fast is home healthcare demand growing?
Home-use settings are projected to grow at an 11.05% CAGR between 2026 and 2031, supported by programs such as Better at Home.
What is the fastest-growing application?
Diabetes therapies, especially automated insulin-delivery solutions, are expanding at a 10.45% CAGR through 2031.
How are digital health policies affecting the market?
National FHIR standards and AUD 325.7 million in federal funding are accelerating adoption of connected injectors, pumps, and remote-monitoring tools.
What regulatory hurdles do suppliers face?
TGA fees and evaluation charges for combination products exceed AUD 95,000 per submission, elevating cost and time-to-market for innovators.
Page last updated on:





