Nanoclay Reinforcement Market Size and Share
Market Overview
| Study Period | 2021 - 2031 |
|---|---|
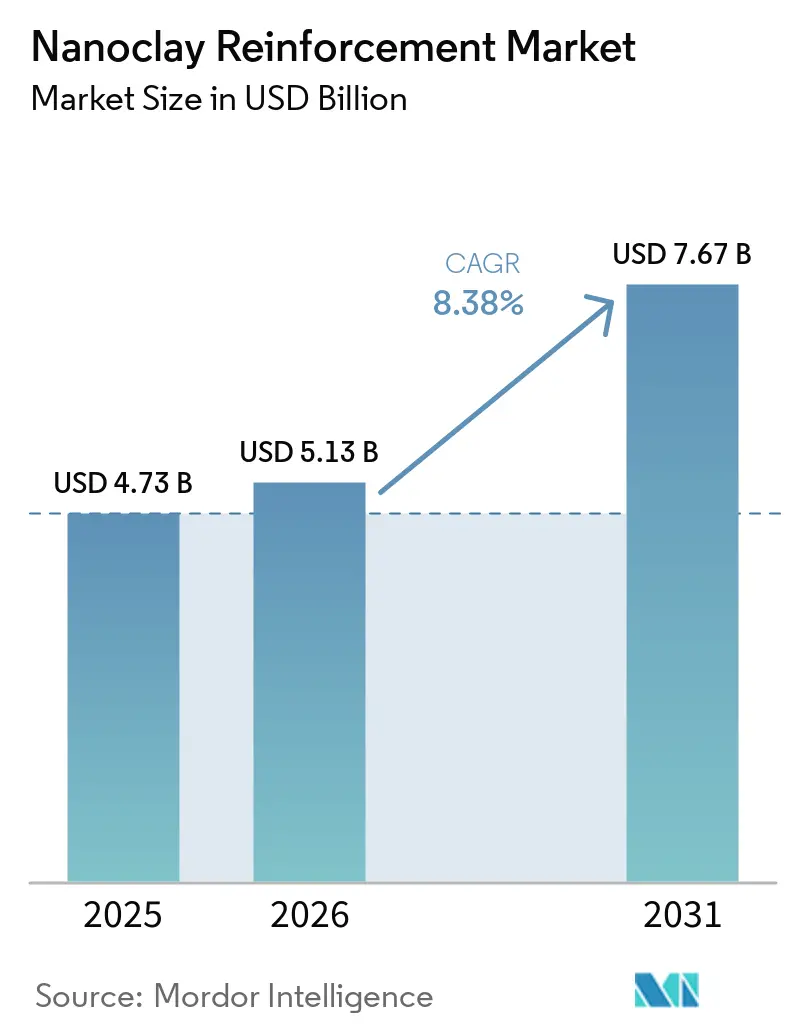
| Market Size (2026) | USD 5.13 Billion |
| Market Size (2031) | USD 7.67 Billion |
| Growth Rate (2026 - 2031) | 8.38% CAGR |
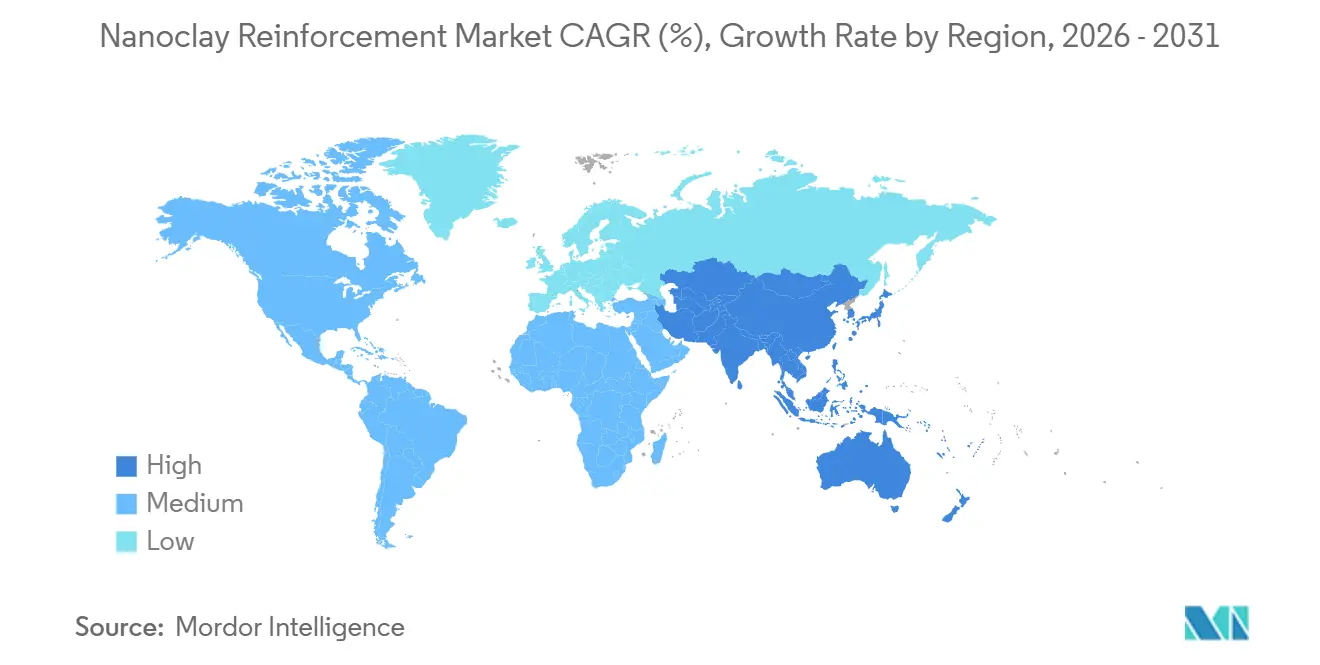
| Fastest Growing Market | Asia-Pacific |
| Largest Market | Asia-Pacific |
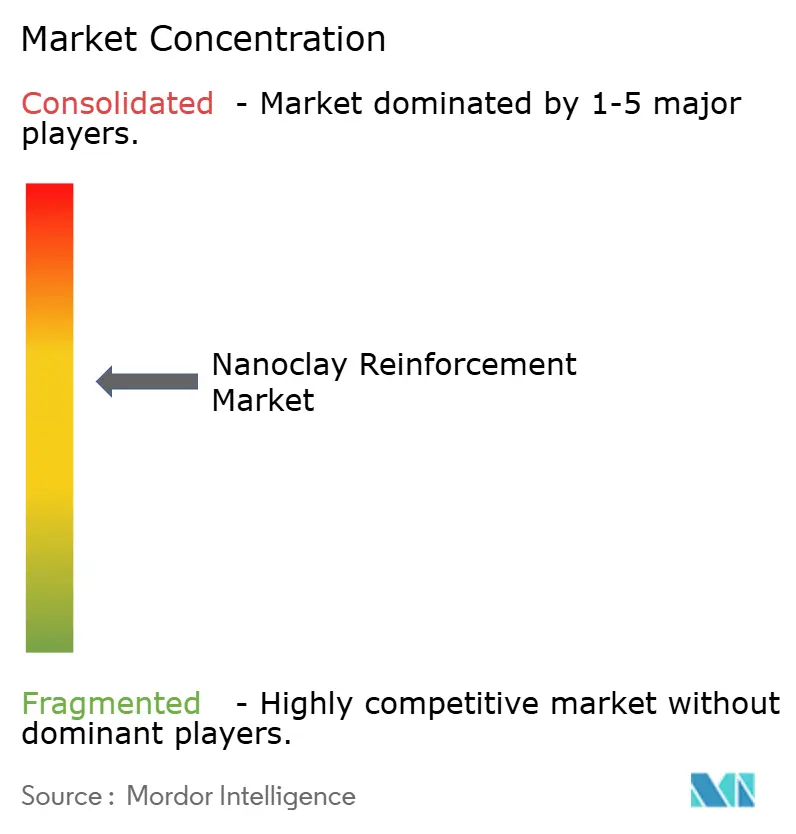
| Market Concentration | Medium |
Major Players *Disclaimer: Major Players sorted in no particular order Image © Mordor Intelligence. Reuse requires attribution under CC BY 4.0. | |
Nanoclay Reinforcement Market Analysis by Mordor Intelligence
The Nanoclay Reinforcement Market size was valued at USD 4.73 billion in 2025 and is estimated to grow from USD 5.13 billion in 2026 to reach USD 7.67 billion by 2031, at a CAGR of 8.38% during the forecast period (2026-2031). Three concurrent shifts are driving demand. First, polymer engineers are enhancing barrier properties, flame resistance, and weight reduction to meet stringent performance standards in electric vehicles, aerospace components, and flexible packaging. Second, regulators in Europe, China, and India are steering brand owners toward recyclable or compostable structures, replacing legacy multilayer films with nanocomposites. Third, processors are seeking ready-to-use concentrates that streamline compounding, reduce scrap, and enable faster line speeds, which strengthens the negotiating position of masterbatch suppliers. Collectively, these dynamics maintain tight capacity and stable pricing, even amidst an abundance of raw clay, positioning the nanoclay reinforcement market for resilient growth during the forecast period of 2026–2031.
Key Report Takeaways
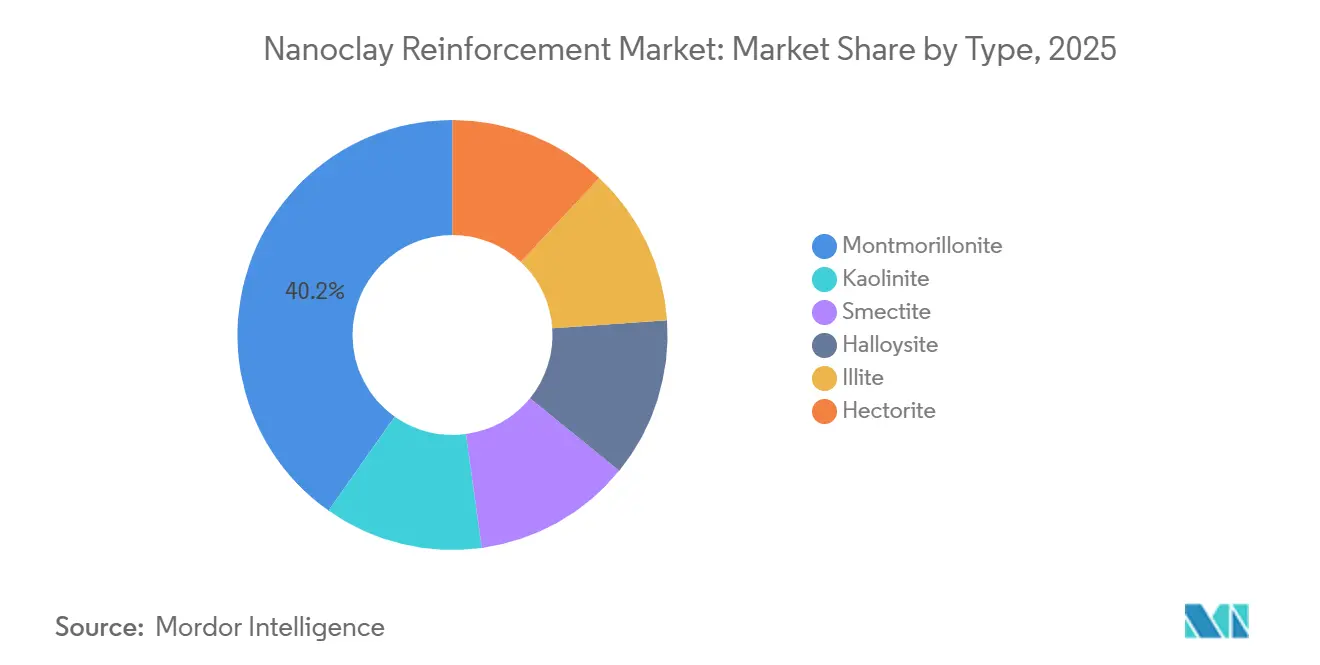
- By type, montmorillonite led with 40.21% of nanoclay reinforcement market share in 2025, while halloysite is expected to post the fastest 8.77% CAGR from 2026 to 2031.
- By form, powder accounted for 47.48% share of the nanoclay reinforcement market size in 2025, and masterbatch is expected to advance at an 8.92% CAGR from 2026 to 2031.
- By reinforcement matrix, thermoplastics captured 45.03% share in 2025, yet biopolymers are expected to grow at a 9.09% CAGR between 2026 and 2031.
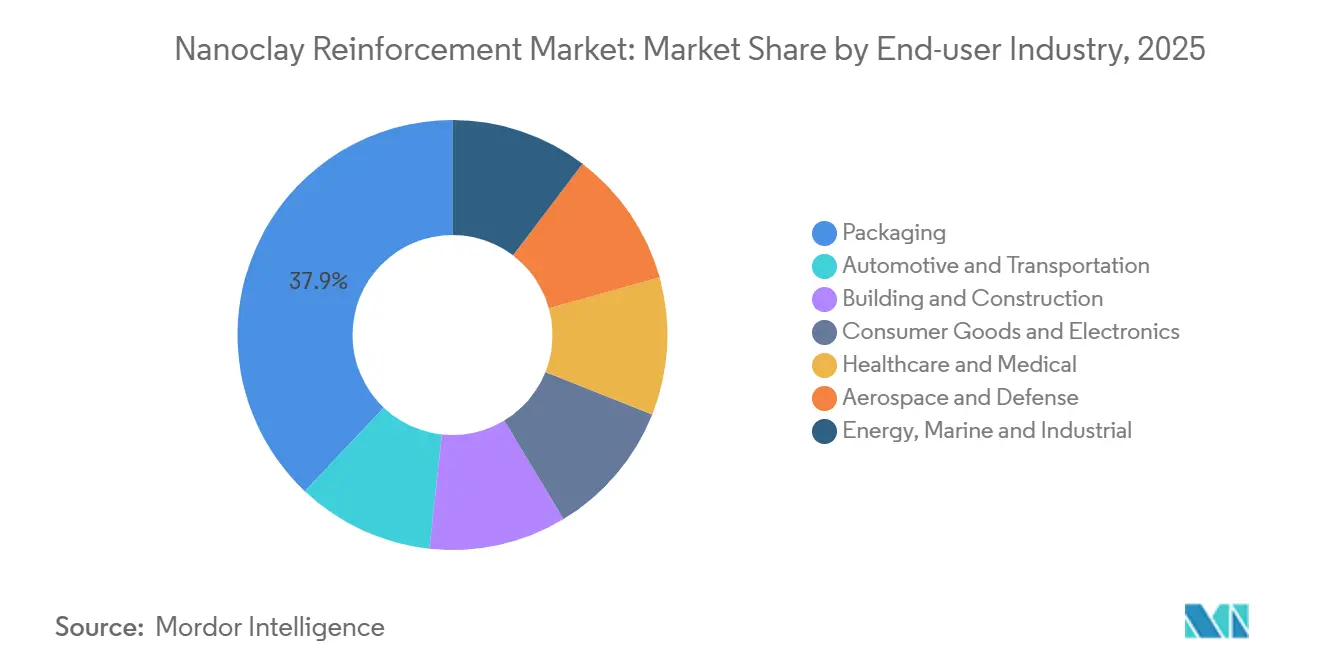
- By end-user industry, packaging held 37.94% revenue share in 2025, whereas healthcare applications are expected to advance at a 9.20% CAGR between 2026 and 2031.
- By geography, Asia-Pacific dominated with a 37.04% share in 2025 and remains the fastest region, and is expected to expand at a 9.18% CAGR between 2026 and 2031.
Note: Market size and forecast figures in this report are generated using Mordor Intelligence’s proprietary estimation framework, updated with the latest available data and insights as of January 2026.
Global Nanoclay Reinforcement Market Trends and Insights
Drivers Impact Analysis*
| Drivers | (~) % Impact on CAGR Forecast | Geographic Relevance | Impact Timeline |
|---|---|---|---|
| Rapid demand for high-performance and lightweight composites | +2.1% | Global, with concentration in North America aerospace and APAC automotive | Medium term (2-4 years) |
| Growing use of nanocomposites in automotive and aerospace | +1.8% | North America, Europe, China, Japan | Medium term (2-4 years) |
| Regulatory push for barrier-enhanced sustainable packaging | +1.5% | Europe (EU PPWR), North America (state-level), APAC emerging | Long term (≥4 years) |
| Cost-effective intercalation and exfoliation breakthroughs | +1.2% | Global, early adoption in China and India manufacturing hubs | Short term (≤2 years) |
| EV battery enclosures needing flame-resistant composites | +1.4% | APAC core (China, South Korea), spill-over to North America and Europe | Medium term (2-4 years) |
| Source: Mordor Intelligence | |||
Rapid Demand for High-Performance and Lightweight Composites
Aerospace original-equipment makers are now choosing montmorillonite-reinforced epoxy prepregs for secondary structures. This weight-reduction choice leads to significant lifetime fuel savings per aircraft. In the automotive sector, tier-1 suppliers are applying the same rationale to battery housings. In this application, nanoclay-modified polyamide 6 not only reduces flame-spread rates to below a critical threshold but also decreases the enclosure's mass. Wind-turbine blade manufacturers are adopting hectorite-based thixotropes, which cut down on scrap and speed up cure cycles, thereby shortening project lead times. These advancements make it costlier for customers to switch suppliers. Each application demands unique surface-modification recipes tailored to its resin, granting established vendors protection against commodity price swings. As a result, the nanoclay reinforcement market is witnessing a surge in new orders, even as crude-oil-linked polymer prices see a downturn.
Growing Nanocomposite Use in Automotive and Aerospace
Battery packs, cabin air-management components, and nacelle panels are increasingly leveraging a synergy of nanoclay and phosphorus. This combination achieves elevated limiting-oxygen-index values with minimal loading[1]Mitsubishi Chemical Corporation, “Sustainability Report 2024,” mitsubishichem.com. Carbon-fiber manufacturers are now providing tows pre-treated with organoclay, which streamlines the process for prepreggers and ensures consistent quality across batches. In the aerospace sector, bismaleimide systems, now enhanced with platelet clays, have seen a reduction in moisture absorption. This advancement extends inspection intervals. Collectively, these advancements not only maintain a high demand for compounders but also highlight a significant shift - the market is moving from sporadic to systematic integration of nanoclay reinforcement products.
Regulatory Push for Barrier-Enhanced Sustainable Packaging
By 2030, the European Union's Packaging and Packaging Waste Regulation mandates recycled content in flexible films. In response, processors are blending polylactic acid or polybutylene adipate terephthalate with montmorillonite, targeting the oxygen-barrier standards of polyethylene-terephthalate, specifically set below 5 cc/m²/day. Meanwhile, India's draft food-safety regulations impose limits on nanoparticle migration in food simulants. Organically modified clays, with covalently bonded surfactants, successfully meet this threshold. In North America, brands are piloting nanoclay-barrier lettuce bags, which extend shelf life and reduce cold-chain waste. These technological advancements collectively expand the market potential for nanoclay reinforcement.
Cost-Effective Intercalation and Exfoliation Breakthroughs
Bio-based quaternary ammonium surfactants, sourced from palm or coconut oil, have successfully lowered organoclay production costs, all while meeting USDA BioPreferred standards. In a notable advancement, solvent-free twin-screw extrusion has rapidly achieved high exfoliation. This not only enhances efficiency but also avoids the aromatic-solvent emissions that have posed challenges for air permits in California and Europe. Concurrently, methods using supercritical carbon dioxide are yielding residue-free platelets, which are ideal for food-contact films. However, the quest for cost parity continues. These technological strides are not isolated achievements; they have catalyzed capacity expansions and thrust the nanoclay reinforcement industry into the spotlight.
Restraints Impact Analysis*
| Restraints | (~) % Impact on CAGR Forecast | Geographic Relevance | Impact Timeline |
|---|---|---|---|
| High processing cost and dispersion complexity | -1.3% | Global, acute in North America and Europe, with high labor costs | Short term (≤2 years) |
| EHS/regulatory uncertainty for food-contact nanoclays | -0.9% | Europe (EFSA), North America (FDA), and emerging in APAC | Medium term (2-4 years) |
| Competition from graphene, CNTs, and other nano-additives | -0.7% | Global, concentrated in electronics and high-performance composites | Long term (≥4 years) |
| Source: Mordor Intelligence | |||
High Processing Cost and Dispersion Complexity
Processors frequently opt for twin-screw extruders with tailored configurations to ensure consistent exfoliation. Yet, inadequate dispersion can create sizable agglomerates, diminishing tensile strength and elevating scrap rates in industries aiming for perfection. Although a nanoclay-infused masterbatch can remedy this challenge, it commands a higher price than the standard organoclay powder. Moreover, while proprietary surfactant packages simplify mixing, they also tether processors to exclusive contracts, limiting competitive bidding. These factors have hindered the expansion of the nanoclay reinforcement market, especially for smaller compounders.
EHS and Regulatory Uncertainty for Food-Contact Nanoclays
EFSA's 2024 guidance mandates migration tests for every conceivable contact, significantly inflating dossier costs per formulation and delaying launches by several months[2]EFSA Panel on Food Contact Materials, “Guidance on Risk Assessment of Nanomaterials,” EFSA Journal 2024, efsa.europa.eu. Meanwhile, the FDA evaluates nanomaterials on a case-by-case basis, offering limited clarity on established thresholds. Even minute detections, such as platelets after a 10-day period at 40 °C, can trigger California's Proposition 65 labeling. These challenges have deterred innovators from food-related ventures, subsequently reducing the immediate addressable volume in the nanoclay reinforcement market.
*Our forecasts treat driver/restraint impacts as directional, not additive. The impact forecasts reflect baseline growth, mix effects, and variable interactions.
Segment Analysis
By Type: Halloysite Tubular Morphology Unlocks Biomedical Premium
In 2025, montmorillonite dominated the nanoclay reinforcement market with a commanding 40.21% share, primarily supporting the mass-market automotive and packaging sectors. Meanwhile, halloysite, although holding a smaller share, experienced significant growth with an 8.77% CAGR during the forecast period of 2026–2031. This growth is attributed to halloysite's advantageous aspect ratio of 10:1 to 30:1, enabling a drug payload of 10 to 15 percent, which significantly outperforms platelet clays.
Wyoming's bentonite and Turkish hectorite mines ensure a steady supply of montmorillonite, reinforcing its dominance in the bulk market. In contrast, hospitals allocate significantly higher budgets for pharmaceutical-grade halloysite coatings, which provide a gradual release of silver ions over weeks, establishing a premium niche in the nanoclay reinforcement market.


By Form: Masterbatch Concentrates Simplify Compounding Economics
In 2025, powder held a dominant 47.48% share of the nanoclay reinforcement market. Meanwhile, revenue from masterbatches is forecast to grow at a CAGR of 8.92% during the forecast period of 2026–2031. This growth is primarily driven by the processors' preference for ready dispersions, steering away from conventional twin-screw capital investments.
RTP's organoclay masterbatch, when applied at a precise let-down ratio, significantly bolsters oxygen barriers in polyethylene films. This advancement not only optimizes operations by minimizing changeover durations but also highlights the superior efficiency of RTP's product. Although dispersion and solution formats face challenges, mainly due to the elevated costs tied to solvent handling, they play pivotal roles in spray-applied coatings, particularly in scenarios with limited equipment shear.
By Reinforcement Matrix: Biopolymers Drive Circular-Economy Transition
In 2025, thermoplastics held a commanding 45.03% share of the nanoclay reinforcement market, with original equipment manufacturers (OEMs) continuing to favor polyamide and polypropylene. Biopolymers, however, are projected to experience the fastest growth, at a CAGR of 9.09% during the forecast period of 2026–2031. This rise was largely attributed to the European Union's restrictions on single-use items. Montmorillonite, when loaded at 3 to 5%, enhanced polylactic acid's (PLA) oxygen-barrier efficiency and heat-deflection properties, enabling the production of compostable trays that match polyethylene terephthalate's (PET) performance. At the same time, thermosets and elastomers, which are critical for the aerospace and tire sectors, experienced steady growth, with a focus on long-term durability over rapid production.
By End-User Industry: Healthcare Antimicrobial Demand Outpaces Legacy Segments
In 2025, packaging claimed 37.94% of the market demand. Meanwhile, the healthcare sector, buoyed by drug-eluting scaffolds and halloysite-rich antimicrobial dressings, is projected to experience a CAGR of 9.20% during the forecast period of 2026–2031.
The automotive sector adopted nanoclay-filled battery shields, and the construction industry utilized platelet sealants, which reduced moisture vapor to below 0.1 g/m²/day, safeguarding facades from mold. Furthermore, niche marine coatings and energy applications expanded the opportunity landscape, ensuring the nanoclay reinforcement market remained diversified and resilient against cyclical downturns.
Geography Analysis
In 2025, the Asia-Pacific region dominated the revenue landscape with a commanding 37.04% share and a robust growth trajectory, boasting a 9.18% CAGR during the forecast period of 2026-2031. China led the charge, rolling out millions of electric vehicles, each outfitted with GB 38031-2020 compliant nanoclay composite battery packs. In India, the food-safety agency's tightening of migration limits catalyzed growth, resulting in a significant uptick in the use of platelet clays for flexible packaging. Japan ramped up halloysite processing to produce high-purity medical grades, while South Korean battery manufacturers, leveraging polyamide housings with precise loading, achieved impressive weight reductions.
North America, with Wyoming as a pivotal player, secured a substantial market share. Wyoming's annual supply of millions of tons of bentonite ensured a steady feedstock for domestic compounders. Aerospace leaders, aligning with NASA's fuel efficiency goals, integrated nanoclay prepregs into nacelles. In 2025, Mexico's auto hubs, benefiting from nearshoring, experienced a surge in demand for under-hood parts.
Europe, despite navigating delays from EFSA, carved out a significant market share and experienced steady growth. In 2024, German OEMs rolled out UL 94 V-0 nanoclay polyamide enclosures across their platforms. French innovations, harnessing platelet-barrier bottles, achieved a remarkable extension of wine shelf life. Spain's adoption of nanoclay mulches led to a significant drop in herbicide run-off. While the United Kingdom's trials with fiber-cement cladding were modest, they gained prominence in the wake of post-Grenfell safety regulations.
South America, alongside the Middle-East and Africa, held a smaller slice of the market. Brazilian petrochemical liners and Saudi sealants ensured steady volumes, while South Africa's mining slurry lines enjoyed a marked reduction in abrasion. Despite their modest market share, these regions consistently met order demands, contributing to the overarching growth of the nanoclay reinforcement market during the forecast period of 2026–2031.

Competitive Landscape
The nanoclay reinforcement market is moderately consolidated. Major players utilize captive mines and surfactant units, managing to keep powder costs low. New entrants are setting their sights on halloysite niches, which command a premium. Chinese vendors of organoclay are underpricing their western counterparts, compelling established players to enhance their offerings with application engineering and masterbatch services. The trend of pre-dispersed concentrates is shifting margins upstream, benefiting firms adept at compounding rather than merely mining. Notably, hybrid nanocomposites, which combine clay with graphene, are gaining traction in pipeline patents, indicating a market tilt towards companies boasting multi-nano capabilities over those with a singular mineral focus.
Nanoclay Reinforcement Industry Leaders
ALTANA (BYK Additives)
Minerals Technologies Inc
Elementis PLC
Imerys
RTP Company
- *Disclaimer: Major Players sorted in no particular order

Recent Industry Developments
- July 2025: Ionic Mineral Technologies secured USD 29 million in Series B funding, aiming to boost the capacity of its Utah facility. The company plans to utilize halloysite clay feedstock to scale its production of nano-materials, targeting an annual output of 1,000 metric tons for reinforcement systems.
- July 2024: Elementis expanded its manufacturing of NiSAT (Non-Ionic Synthetic Associative Thickeners) technology to China. This expansion enables the company to meet the increasing demand for environmentally compatible nanoclay reinforcement applications in automotive and industrial coatings markets.


Global Nanoclay Reinforcement Market Report Scope
Nanoclay reinforcement is defined as the process of dispersing nanoscale layered mineral silicates within a polymer matrix to significantly enhance mechanical strength, thermal stability, and barrier properties. This technique employs high-surface-area platelets to form tortuous paths, curbing gas permeability and bolstering structural rigidity.
The nanoclay reinforcement market is segmented by type, form, reinforcement matrix, end-user industry, and geography. By type, the market is segmented into montmorillonite, kaolinite, smectite, halloysite, illite, and hectorite. By form, the market is segmented into powder, masterbatch, and dispersion/solution. By reinforcement matrix, the market is segmented into thermoplastics, thermosets, elastomers, biopolymers, and other polymer systems. By end-user industry, the market is segmented into packaging, automotive and transportation, building and construction, consumer goods and electronics, healthcare and medical, aerospace and defense, and energy, marine, and industrial. The report also covers the market size and forecasts for the market in 17 countries across major regions. For each segment, the market sizing and forecasts are done based on value (USD).
| Montmorillonite |
| Kaolinite |
| Smectite |
| Halloysite |
| Illite |
| Hectorite |
| Powder |
| Masterbatch |
| Dispersion/Solution |
| Thermoplastics |
| Thermosets |
| Elastomers |
| Biopolymers |
| Other Polymer Systems |
| Packaging |
| Automotive and Transportation |
| Building and Construction |
| Consumer Goods and Electronics |
| Healthcare and Medical |
| Aerospace and Defense |
| Energy, Marine and Industrial |
| Asia-Pacific | China |
| India | |
| Japan | |
| South Korea | |
| ASEAN Countries | |
| Rest of Asia-Pacific | |
| North America | United States |
| Canada | |
| Mexico | |
| Europe | Germany |
| United Kingdom | |
| France | |
| Italy | |
| Spain | |
| Russia | |
| Nordic Countries | |
| Rest of Europe | |
| South America | Brazil |
| Argentina | |
| Rest of South America | |
| Middle-East and Africa | Saudi Arabia |
| South Africa | |
| Rest of Middle-East and Africa |
| By Type | Montmorillonite | |
| Kaolinite | ||
| Smectite | ||
| Halloysite | ||
| Illite | ||
| Hectorite | ||
| By Form | Powder | |
| Masterbatch | ||
| Dispersion/Solution | ||
| By Reinforcement Matrix | Thermoplastics | |
| Thermosets | ||
| Elastomers | ||
| Biopolymers | ||
| Other Polymer Systems | ||
| By End-user Industry | Packaging | |
| Automotive and Transportation | ||
| Building and Construction | ||
| Consumer Goods and Electronics | ||
| Healthcare and Medical | ||
| Aerospace and Defense | ||
| Energy, Marine and Industrial | ||
| By Geography | Asia-Pacific | China |
| India | ||
| Japan | ||
| South Korea | ||
| ASEAN Countries | ||
| Rest of Asia-Pacific | ||
| North America | United States | |
| Canada | ||
| Mexico | ||
| Europe | Germany | |
| United Kingdom | ||
| France | ||
| Italy | ||
| Spain | ||
| Russia | ||
| Nordic Countries | ||
| Rest of Europe | ||
| South America | Brazil | |
| Argentina | ||
| Rest of South America | ||
| Middle-East and Africa | Saudi Arabia | |
| South Africa | ||
| Rest of Middle-East and Africa | ||


Key Questions Answered in the Report
What is the 2026 value outlook for the nanoclay reinforcement market?
The nanoclay reinforcement market size is estimated at USD 5.13 billion in 2026 and is tracking toward USD 7.67 billion by 2031 at an 8.38% CAGR in the 2026-2031 period.
Which nanoclay type grows the fastest?
Halloysite leads growth at an 8.77% CAGR in the 2026-2031 period because its tubular structure suits controlled-release healthcare products.
Why are masterbatch concentrates gaining share?
They remove twin-screw capital requirements, cut scrap, and are growing at an 8.92% CAGR in the 2026-2031 period within the nanoclay reinforcement market.
Which region dominates demand?
Asia-Pacific holds 37.04% of global revenue and continues to lead growth at a 9.18% CAGR in the forecast period of 2026-2031, driven by China and India.
Page last updated on:


