Nanomaterials Market Size and Share
Market Overview
| Study Period | 2021 - 2031 |
|---|---|
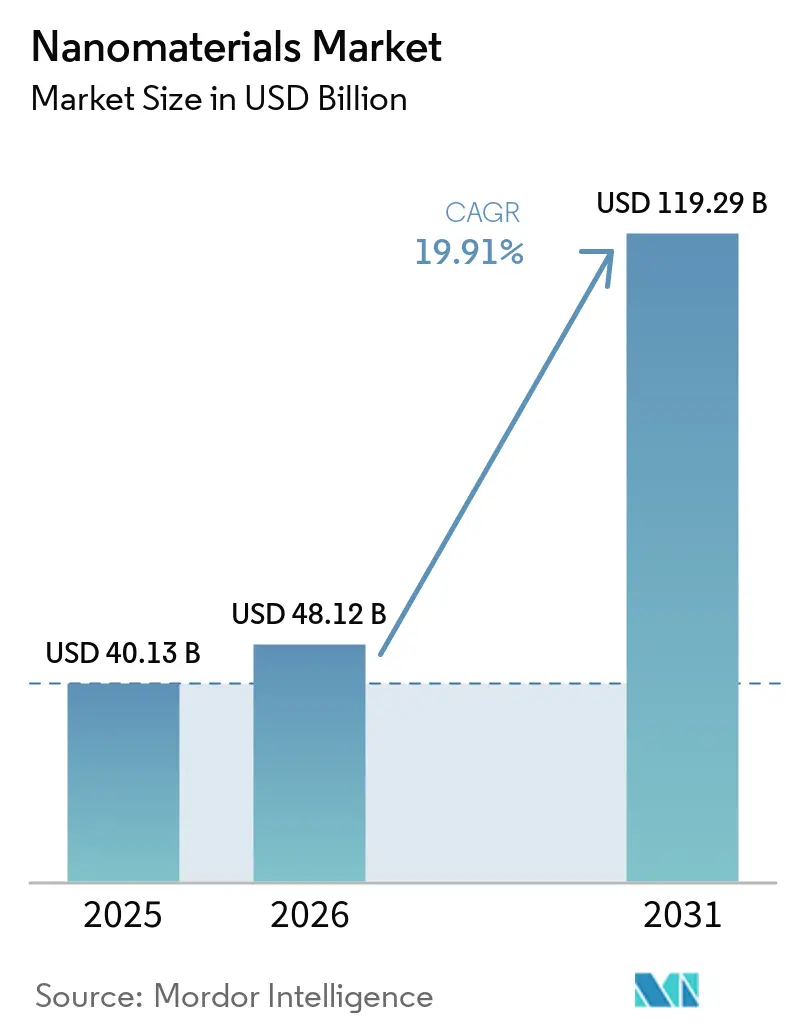
| Market Size (2026) | USD 48.12 Billion |
| Market Size (2031) | USD 119.29 Billion |
| Growth Rate (2026 - 2031) | 19.91% CAGR |
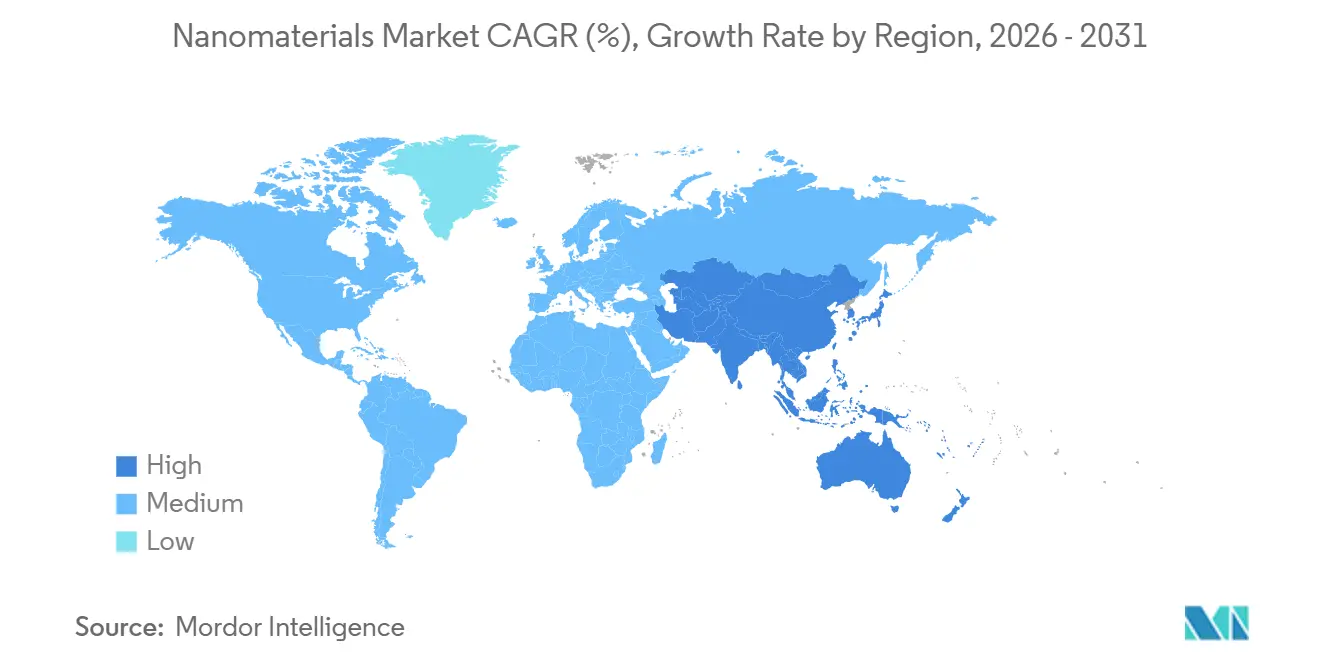
| Fastest Growing Market | Asia Pacific |
| Largest Market | North America |
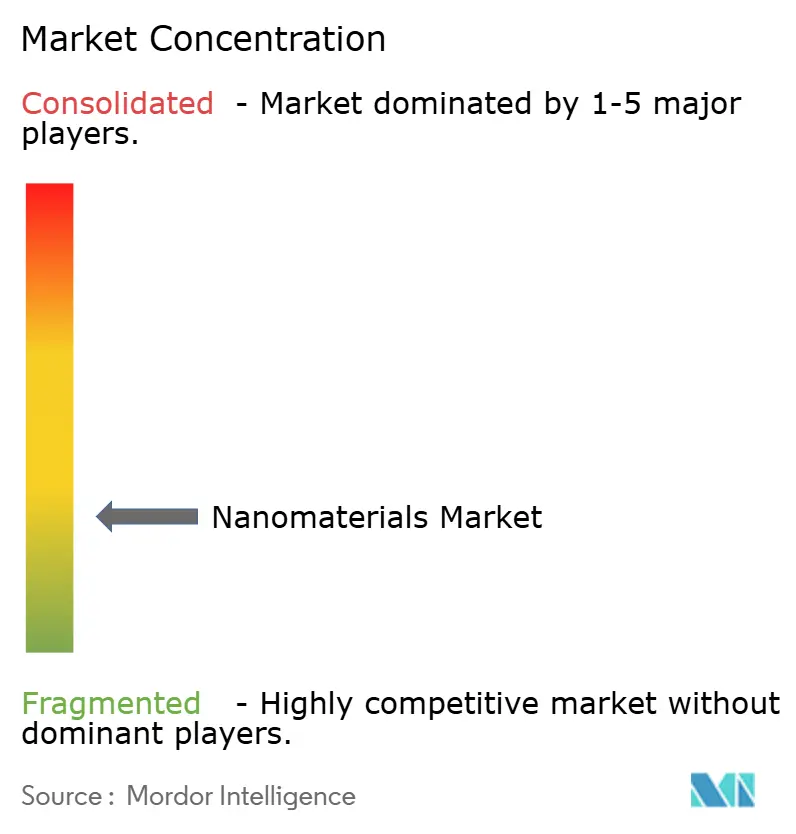
| Market Concentration | Low |
Major Players *Disclaimer: Major Players sorted in no particular order Image © Mordor Intelligence. Reuse requires attribution under CC BY 4.0. | |
Nanomaterials Market Analysis by Mordor Intelligence
The Nanomaterials Market size is projected to be USD 40.13 billion in 2025, USD 48.12 billion in 2026, and reach USD 119.29 billion by 2031, growing at a CAGR of 19.91% from 2026 to 2031. This momentum stems from coordinated investment in sub-3 nm semiconductor fabs that require defect-free CMP slurries, the mass-production of lipid-nanoparticle vaccines, utility-scale deployment of nano-enabled reverse-osmosis membranes, and the commercialization of silicon-nanowire battery anodes. Rising demand for nano-clay cement additives under decarbonization mandates, together with government incentives tied to domestic semiconductor supply chains, is widening the application base. At the same time, suppliers with inline particle-size analytics and ISO 14644 cleanroom capacity are consolidating share because end users impose stringent purity specifications. Capital inflows are therefore shifting from commodity nano-oxides toward engineered, surface-functionalized grades that offer higher margins and longer customer lock-in periods.
Key Report Takeaways
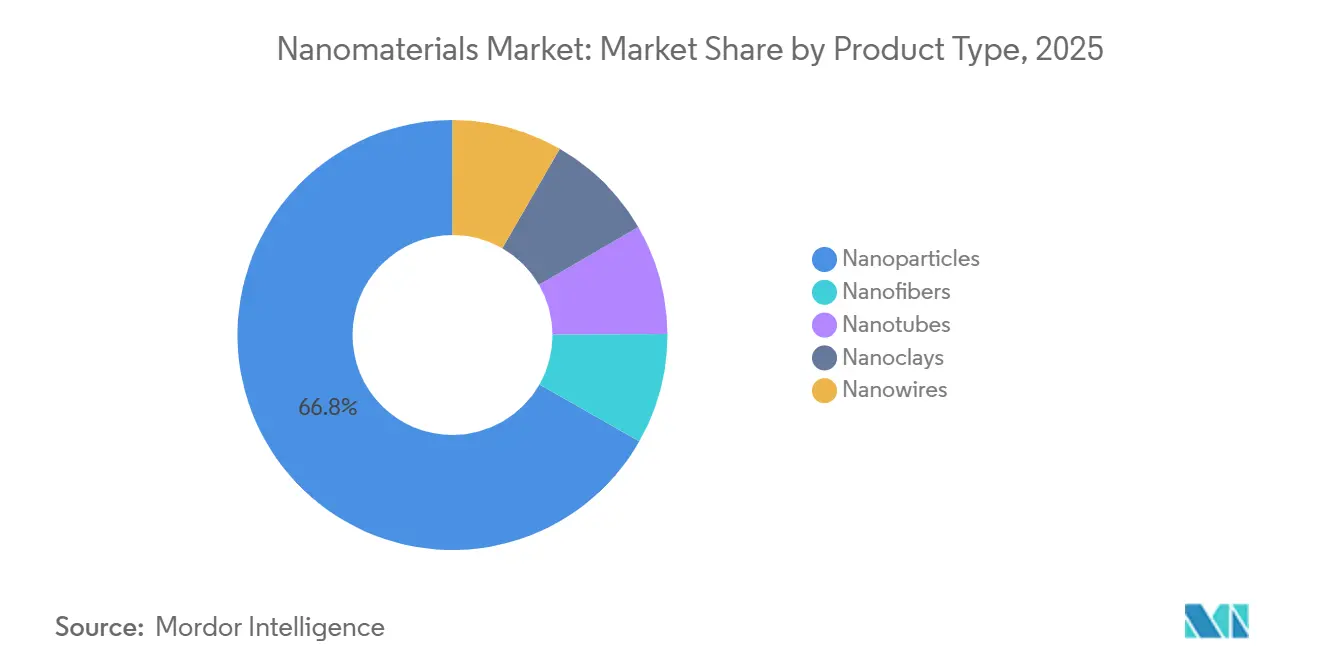
- By product type, nanoparticles captured 66.78% of the nanomaterials market share in 2025. Nanotubes are forecast to expand at a 21.43% CAGR through 2031, the fastest rate among product types.
- By structure type, non-polymer organic nanomaterials accounted for 55.12% of demand in 2025. Polymeric nanomaterials are forecast to register a 20.05% CAGR through 2031.
- By material category, carbon-based grades accounted for 41.08% of demand in 2025. Lipid-based grades are projected to expand at a 21.89% CAGR during 2026-2031.
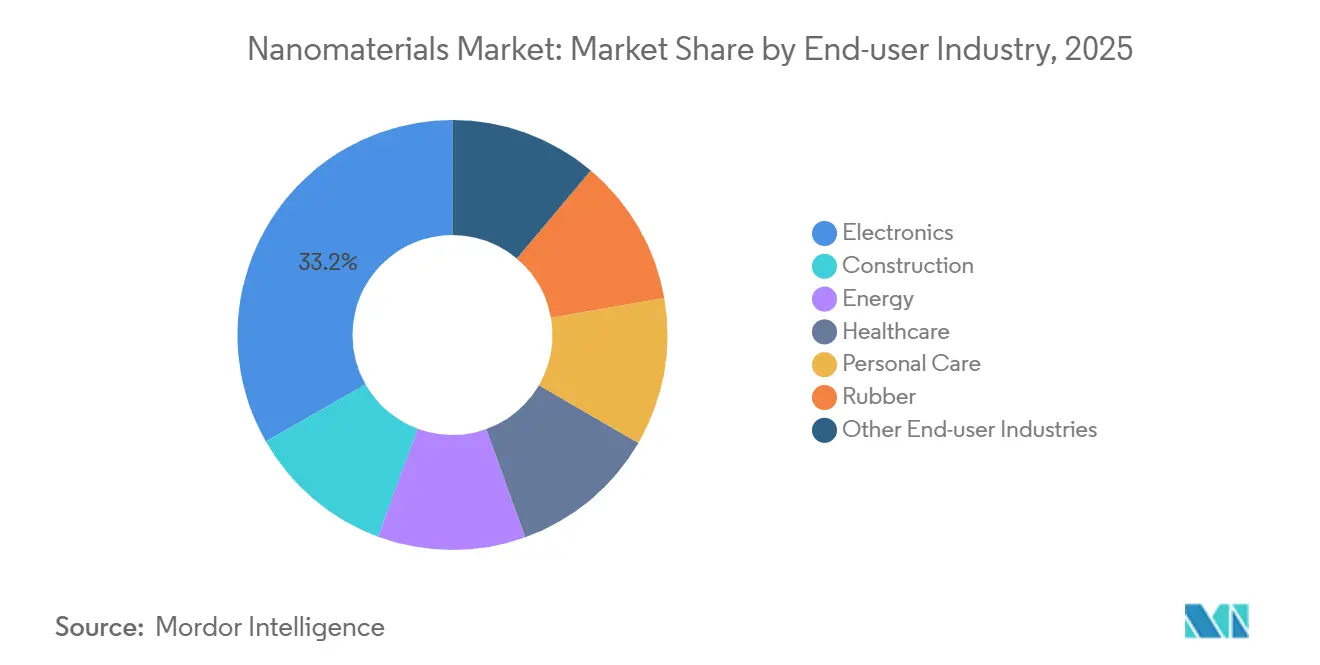
- By end-user industry, electronics commanded 33.25% of the nanomaterials market size in 2025 and is advancing at a 20.18% CAGR through 2031.
- By geography, North America accounted for 38.78% of demand in 2025. Asia-Pacific is expected to expand at a 22.32% CAGR over 2026-2031.
Note: Market size and forecast figures in this report are generated using Mordor Intelligence’s proprietary estimation framework, updated with the latest available data and insights as of January 2026.
Global Nanomaterials Market Trends and Insights
Drivers Impact Analysis*
| Drivers | (~) % Impact on CAGR Forecast | Geographic Relevance | Impact Timeline |
|---|---|---|---|
| Expansion of semiconductor fabs driving high-purity nano-slurries | +4.2% | North America, Asia-Pacific (Taiwan, South Korea, Arizona) | Medium term (2-4 years) |
| Rising integration of nanomaterials in mRNA vaccine platforms | +3.8% | North America, Europe | Short term (≤ 2 years) |
| Rapid adoption of nano-enabled water treatment systems | +3.5% | Global, with concentration in water-stressed regions (California, Singapore, Middle East) | Medium term (2-4 years) |
| Surge in EV battery production using nano-structured electrodes | +4.5% | Asia-Pacific core (China, South Korea), spill-over to Europe and North America | Long term (≥ 4 years) |
| EU CBAM incentivizing nano-clay low-carbon cement | +2.9% | Europe, early adoption in North America and select ASEAN markets | Long term (≥ 4 years) |
| Source: Mordor Intelligence | |||
Semiconductor Fabs Scaling High-Purity Nano-Slurries
TSMC's Arizona and Samsung's Texas fabs are turning to ceria and alumina CMP slurries, specifically those with sub-50 nm particle sizes, to achieve gate-all-around yield targets. Meanwhile, Intel has greenlit Cabot Microelectronics to provide colloidal-silica formulations, which promise a reduction in defect density compared to benchmarks[1]Intel Corporation, “Intel Ohio Fab CMP Contracts,” Intel.com. The U.S. CHIPS Act, with its domestic-content clauses, is steering procurement towards North American producers, effectively fragmenting the previously Asia-centric supply chain. Vendors lacking inline dynamic-light-scattering controls face disqualification, leading to a concentration of orders with integrated suppliers. As fabs shift towards backside-power delivery, the rising complexity of slurries is driving price premiums for application-engineered grades.
Integration of Nanomaterials in mRNA-Vaccine Platforms
In 2025, Moderna ramped up its processing of ionizable and PEGylated lipids to support flu and combination respiratory vaccines. Meanwhile, BioNTech has integrated continuous-flow microfluidic mixers, enabling real-time adjustments of particle sizes to optimize uptake. Pfizer is testing self-amplifying RNA constructs, which utilize less lipid per dose, translating to a cost reduction per vial. The lipid supply chain is now largely governed by take-or-pay contracts, ensuring guaranteed volumes. However, this arrangement poses a risk for suppliers, as they might face margin compression if prices for cholesterol and DSPC remain high. The silver lining? Established vendors gain multi-year visibility, while newcomers face heightened entry barriers.
Rapid Adoption of Nano-Enabled Water Treatment Systems
Singapore’s Public Utilities Board has awarded contracts for titanium-dioxide nanocomposite membranes. These new membranes boast an extended service life compared to the lifespan of legacy films[2]Public Utilities Board Singapore, “Advanced Membrane Technology Contracts,” Pub.gov.sg. In California, the Skinner plant achieved a significant milestone, recording a reduction in energy intensity after piloting graphene-oxide membranes. Nano-enabled membranes are increasingly being adopted in reverse-osmosis capacity. Suppliers like Toray and DuPont are incorporating silver nanoparticles to combat biofouling. However, ISO Technical Committee 282 is in the process of drafting leachate-testing protocols, which could potentially lengthen certification timelines. This dynamic has led to a swift adoption of these technologies in water-stressed regions, even as standards continue to evolve in Europe and North America.
EV Battery Production Using Nano-Structured Electrodes
CATL's third-generation Qilin battery, featuring silicon-nanowire anodes, grants a Zeekr sedan an extended range. At LG Energy Solution's Ochang plant, LFP cathodes, now enhanced with carbon nanotube coatings, see a reduction in internal resistance. Panasonic's Kansas gigafactory integrates OCSiAl nanotubes into the 4680 cell format, boosting thermal conduction and facilitating faster charging times. The shift from graphite-only anodes to silicon-graphite blends is fostering collaborations between natural-graphite miners and chemical-vapor-deposition experts. Simultaneously, battery recyclers are pioneering hydrometallurgical methods to reclaim silicon and nanotubes.
Restraints Impact Analysis*
| Restraints | (~) % Impact on CAGR Forecast | Geographic Relevance | Impact Timeline |
|---|---|---|---|
| Volatile prices of critical nanoscale feedstocks | -1.8% | Global, acute in Asia-Pacific and Europe | Short term (≤ 2 years) |
| High CAPEX for precision synthesis (ALD reactors, etc.) | -1.5% | North America, Europe, select Asia-Pacific hubs | Medium term (2-4 years) |
| Emerging EHS rules delaying approvals (EU and Canada) | -1.2% | Europe, North America | Medium term (2-4 years) |
| Source: Mordor Intelligence | |||
Volatile Prices of Critical Nanoscale Feedstocks
In 2025, cyclone damage at Mozambique's Balama mine disrupted the supply of natural-flake graphite, leading to a sharp rise in graphene-oxide spot prices. Simultaneously, costs for titanium tetrachloride surged as Chinese smelters, responding to tightened environmental quotas, curtailed their output. Additionally, export-license restrictions on rare-earth oxides, commonly used in cerium-oxide slurries, resulted in significant price fluctuations. Converters, lacking long-term offtake agreements, find it challenging to safeguard their margins. In a strategic move, BASF acquired a minority stake in a Canadian graphite developer, aiming to secure a steady feedstock. While such forward-integration strategies mitigate exposure to volatile spot markets, they also come with heightened capital demands.
High CAPEX for Precision Synthesis Equipment
In 2025, atomic-layer-deposition systems, which can coat nanoparticles with sub-nm precision, had an 18-month lead time, as tool makers prioritized semiconductor orders. Evonik retrofitted its Hanau silica plant for OLED-grade output, resulting in an extended payback period. A U.S. contract manufacturer specializing in lipid nanoparticles scrapped plans for a second site after discovering that specialized HVAC and explosion-proof systems pushed bids significantly above initial estimates. This capital intensity is steering the nanomaterials market towards firms with robust balance sheets or those with grant access.
*Our forecasts treat driver/restraint impacts as directional, not additive. The impact forecasts reflect baseline growth, mix effects, and variable interactions.
Segment Analysis
By Product Type: Nanoparticles Anchor, Nanotubes Accelerate
Nanoparticles accounted for 66.78% of 2025 revenue within the nanomaterials market, reflecting entrenched demand for titanium-dioxide sunscreens, silica-reinforced automotive coatings, and alumina fillers. Nanometals such as gold and silver underpin diagnostics that detect biomarkers at picomolar levels. By volume, non-metal oxides lead the market. BASF's Ludwigshafen complex showcased its scale economies by producing fumed silica, primarily for tire reinforcement. Meanwhile, complex oxides, such as lithium titanate, are making strides in solid-state batteries, enabling bus charges in both Shenzhen and Seoul.
Nanotubes are poised for a 21.43% CAGR to 2031 as EV thermal-management systems and 5G antenna arrays embed multi-walled carbon nanotubes for EMI shielding. OCSiAl ramped up its production of single-walled nanotubes, providing battery additives that enhance cycle life. While nanofibers, nanoclays, and nanowires find applications in filtration, packaging, and as transparent conductors, respectively, each remains a niche in terms of value. Compliance with ISO 10808 particle characterization is emerging as a standard entry requirement, giving an edge to vendors equipped with advanced analytics.


By Structure Type: Polymeric Materials Gain Momentum
Non-polymer organic nanomaterials held 55.12% share in 2025, led by carbon black for low-rolling-resistance tires and carbon-nanotube conductive additives. Aptamers advanced in point-of-care diagnostics, with CE-marked COVID-19 detection kits launched in early 2025. Flagship smartphones now boast small-molecule OLED emitters, harnessing iridium complexes, achieving high quantum efficiencies.
Polymeric grades are set to expand at a 20.05% CAGR, riding demand for nano-silica scratch-resistant coatings and high-efficiency CRISPR-Cas9 transfection reagents. In 2024, diagnostic reagents leveraging quantum dots achieved a milestone, facilitating 12-plex immunoassays from just one serum sample. The pharmaceutical industry has increasingly focused on liposomal and dendrimer drug-delivery vehicles, with Doxil and Abraxane leading the charge. Amidst emerging European biocide proposals, fabric treatments previously reliant on silver nanoparticles are now shifting focus to zinc oxide alternatives. Meanwhile, in the realm of optical and dielectric films, a high-margin niche, securing an ISO 14001 certification has become a strategic procurement advantage.
By Material Category: Carbon Dominates, Lipids Surge
Carbon-based materials captured 41.08% of 2025 revenue in the nanomaterials market. Tires, batteries, and composite parts rely on carbon black, graphene, and nanotubes. Metal-based nanomaterials—silver, gold, copper, platinum—serve catalytic, conductive-ink, and antimicrobial roles, with silver nanoparticle usage in medical devices playing a significant role. Metal-oxide and ceramic grades such as titanium dioxide and zinc oxide underpin sunscreens and multilayer ceramic capacitors.
Lipid-based nanomaterials form the fastest-growing subcategory, registering a CAGR of 21.89% during 2026-2031, propelled by vaccine platforms and siRNA programs. Acuitas Therapeutics announced that its proprietary ionizable lipids are featured in over 30 clinical projects. Polymeric carriers, such as PLGA nanoparticles and chitosan complexes, are extending drug half-lives and enhancing patient compliance. Meanwhile, hybrid constructs—lipid-coated polymer cores—are merging adjustable release with precise delivery, challenging traditional material distinctions.
By End-User Industry: Electronics Leads, Healthcare Accelerates
Electronics held 33.25% of 2025 demand and is forecast to post a 20.18% CAGR, reflecting the adoption of copper-nanowire interposers, quantum-dot displays, and nanotube EMI shields. Samsung Display's QD-OLED panels utilize cadmium-free quantum dots, with a target of reaching an annual production of millions of units by 2027. As infrastructure bills emphasize low-carbon materials, construction is turning to innovations like nano-clay cement and self-cleaning coatings. In the energy sector, silicon-nanowire anodes are gaining traction.
Healthcare, the second-fastest-growing segment, is driven by innovations such as lipid-nanoparticle vaccines, gold-nanoparticle lateral-flow tests, and silver-nanoparticle wound dressings, the latter of which have demonstrated a reduction in infection rates during trials. In personal care, titanium dioxide and zinc oxide nanoparticles were used, yet ongoing debates about labeling have sparked a growing interest in organic UV filters. The rubber sector remains stable, with Cabot and Orion holding a dominant position in performance grades.
Geography Analysis
North America contributed 38.78% of 2025 sales, anchored by Arizona’s TSMC and Intel fabs that together use nano-slurries annually and by Pfizer-Moderna lipid networks supported by the CHIPS Act and BARDA incentives. Canada’s NanoXplore plans to scale graphene output for automotive and construction composites, while Mexico’s Monterrey corridor attracts nano-coating lines serving Gigafactory Texas. The U.S. Environmental Protection Agency expects to finalize a nanomaterial reporting rule in mid-2026, mandating disclosure, which may burden smaller producers but increase market transparency.
Asia-Pacific is projected to deliver a 22.32% CAGR, fueled by China's aggressive expansions in graphene and nanotubes. Notably, Jiangsu Cnano is on track to boost its multi-walled nanotube output by 2026. Meanwhile, Japan solidifies its dominance in OLED emitters, thanks to key players like Mitsubishi Chemical and Sumitomo Chemical. South Korea's giants, LG Chem and Samsung SDI, are integrating silicon-nanowire anodes into next-gen batteries. In India, producers of nano-titanium dioxide are ramping up production to cater to the surging demand in paints and sunscreens. ASEAN nations, with Vietnam at the forefront, are piloting graphene-oxide membranes for municipal water, bolstered by foreign direct investment in electronics.
Europe reaps the rewards of stringent REACH pre-registration, a move that benefits established players like BASF, Evonik, and Wacker, who together account for a significant share of the specialty-nanomaterial revenue. In the UK, Versarien and Italy's Directa Plus are scaling up graphene for composite applications. France's Arkema is making strides by commercializing fullerene-based organic photovoltaic materials. South America is still in its nascent stages, with Brazil experimenting with nano-clay cement for the metro expansion in São Paulo. The Middle East, spearheaded by Saudi Arabia's Yanbu titanium dioxide complex, is carving out a niche as a cost-effective precursor hub, capitalizing on gas-based titanium tetrachloride production routes.

Competitive Landscape
The nanomaterials market is fragmented. Strategic themes include vertical integration, geographic diversification, and circular value chains. LG Chem’s 2025 joint venture with a European recycler targets the recovery of silicon nanowires and nanotubes from spent EV packs. Nanocyl and Solvay co-develop epoxy prepregs that meet aircraft flame-smoke-toxicity standards. Suppliers with REACH registrations and ISO 10808 analytics extract pricing premiums, creating a regulatory moat. University spin-outs exploring DNA-origami drug carriers and MOF gas sieves remain pre-revenue but are potential acquisition targets for incumbents seeking technology differentiation.
Nanomaterials Industry Leaders
BASF SE
Evonik Industries AG
Cabot Corporation
LG Chem
OCSiAl
- *Disclaimer: Major Players sorted in no particular order

Recent Industry Developments
- April 2026: Researchers from Kerala secured an Indian patent for a biocompatible nanofiber scaffold designed to enhance bone regeneration and tissue repair. Developed through advanced electrospinning, this technology offered increased strength and high compatibility, making it suitable for orthopedic care, guided bone healing, and regenerative medicine.
- March 2026: Researchers at The University of Texas at Dallas developed an advanced electrolyte system that enhanced the energy-harvesting efficiency of twistrons, which are carbon nanotube yarns that produce electricity when stretched repeatedly. These findings had potential applications in the production of smart textiles, including fabrics for spacesuits, enabling wearable electronic devices or sensors to be powered by energy harvested from human motion.


Research Methodology Framework and Report Scope
Market Definitions and Key Coverage
Mordor Intelligence defines the nanomaterials market as the value generated from the sale of engineered substances whose primary dimension lies between 1 nm and 100 nm, covering carbon-based, metal-based, metal-oxide, ceramic, polymeric, and hybrid forms used across construction, electronics, energy, healthcare, personal care, rubber, and allied industries worldwide.
We include only commercially produced, additive-grade, and device-grade nanomaterials sold in bulk or as masterbatches; research samples and in-house captive production kept for internal use are excluded.
Scope Exclusion: Natural nanoscale particulates formed unintentionally during combustion or erosion fall outside our study.
Segmentation Overview
- By Product Type
- Nanoparticles
- Nanometals
- Gold
- Silver
- Platinum
- Titanium
- Aluminium
- Non-metal Oxides
- Alumina
- Iron Oxide
- Titanium Oxide
- Silica
- Zinc Oxide
- Complex Oxides
- Calcium Phosphate
- Rare-earth Metal Oxides
- Lithium Titanate
- Silica Hydride
- Nanometals
- Nanofibers
- Nanotubes
- Nanoclays
- Nanowires
- Nanoparticles
- By Structure Type
- Non-polymer Organic Nanomaterials
- Carbon Black
- Carbon Nanotubes
- Aptamers
- Small-molecule OLED Materials
- Activated Carbon
- Carbon Nanotube Composites
- Polymeric Nanomaterials
- Coatings and Adhesives
- Transfection Reagents
- Diagnostic Reagents
- Drug-delivery Vehicles
- Fabric Treatments
- Optical Coatings
- Nano-porous Filtration Membranes
- Dielectric Films
- OLED Films
- Non-polymer Organic Nanomaterials
- By Material Category
- Carbon-based
- Metal-based
- Metal-oxide and Ceramic-based
- Polymeric and Lipid-based
- By End-user Industry
- Construction
- Electronics
- Energy
- Healthcare
- Personal Care
- Rubber
- Other End-user Industries
- By Geography
- Asia-Pacific
- China
- India
- Japan
- South Korea
- ASEAN
- Rest of Asia-Pacific
- North America
- United States
- Canada
- Mexico
- Europe
- Germany
- United Kingdom
- Italy
- France
- Rest of Europe
- South America
- Brazil
- Argentina
- Rest of South America
- Middle-East and Africa
- Saudi Arabia
- South Africa
- Rest of Middle-East and Africa
- Asia-Pacific
Detailed Research Methodology and Data Validation
Primary Research
Subsequently, we speak with procurement heads at specialty chemical converters, R & D leads at battery and chip firms, nanotoxicology scholars, and regulators across North America, Europe, Asia-Pacific, and the Gulf.
The conversations validate pricing corridors, gauge adoption hurdles, and align forecast drivers that secondary sources hint at but rarely quantify.
Desk Research
Our team begins with publicly available cornerstones, such as the US National Nanotechnology Initiative dashboard, Eurostat PRODCOM nano codes, UN Comtrade trade flows, OECD patent statistics, and peer-reviewed work in ACS Nano, followed by company filings, investor decks, and industry position papers. Production capacities, import ratios, and healthcare trial pipelines drawn from those sources shape the first demand-supply frame. D&B Hoovers and Dow Jones Factiva enrich revenue splits and competitive moves. This list is illustrative; many other credible outlets buttress the evidence base we compile.
Market-Sizing & Forecasting
The initial top-down construct rebuilds global demand from production and trade statistics, which is then pressure-tested with selective bottom-up roll-ups of sampled average selling price times output from major suppliers. Key variables like nano-powder tonnage, electronics penetration rates, NIH nanomedicine funding, solar paste loading ratios, and regional carbon-price trajectories feed a multivariate regression forecast that projects values to 2030. Gaps in bottom-up supplier counts, especially in China and ASEAN, are bridged by calibrated utilization factors validated during expert interviews.
Data Validation & Update Cycle
Before sign-off, Mordor analysts benchmark model outputs against independent price indices and end-use growth signals, re-running anomaly checks as needed. Reports refresh every twelve months, with interim updates triggered by material events such as regulatory shifts or capacity additions, so clients receive our most current view.
Why Mordor's Nanomaterials Baseline Inspires Confidence
Published estimates often diverge because analysts pick differing particle sets, price blends, and forecast cadences.
We openly acknowledge these moving parts up front and explain how each one affects the final dollar figure our clients see.
Key gap drivers include narrower scope (some publishers omit carbon allotropes), older base years rolled forward without fresh trade audits, single-region price averaging, and slower refresh cycles that miss rapid capacity additions in Asia.
Benchmark comparison
| Market Size | Anonymized source | Primary gap driver |
|---|---|---|
| USD 47.63 B | Mordor Intelligence | - |
| USD 19.45 B | Global Consultancy A | Excludes polymeric nanomaterials; limited primary validation |
| USD 18.87 B | Industry Association B | Uses 2023 prices inflated by CPI, not nano-specific ASP shifts |
| USD 16.40 B | Regional Consultancy C | Omits healthcare usage and China trade corrections |
Taken together, the comparison shows that our disciplined scope selection, live price tracking, and annual refresh produce a balanced, transparent baseline that decision-makers can retrace and replicate with confidence.


Key Questions Answered in the Report
How large is the nanomaterials market in 2026?
The nanomaterials market size reached USD 48.12 billion in 2026 and is projected to reach USD 119.29 billion by 2031 at a 19.91% CAGR.
Which product type currently dominates demand?
Nanoparticles hold 66.78% of 2025 revenue, driven by titanium dioxide and silica grades used in personal-care and coating applications.
What application area is expanding the fastest?
Electronics is advancing at a 20.18% CAGR through 2031 as quantum-dot displays, copper-nanowire interposers, and nanotube shields enter mass production.
Why are lipid-based nanomaterials growing so quickly?
Global vaccine programs and a pipeline of siRNA and mRNA therapeutics require ionizable and PEGylated lipids for delivery, lifting lipid-based grades at a 21.89% CAGR.
Which region offers the highest growth outlook?
Asia-Pacific is forecast to register a 22.32% CAGR to 2031, backed by large-scale graphene and nanotube capacity expansions and strong EV battery investment.
What is the main barrier to new entrants?
High CAPEX for precision synthesis tools such as atomic-layer-deposition reactors, coupled with stringent regulatory testing under REACH and ISO standards, limits market entry.
Page last updated on:


