Nano Zinc Oxide Market Size and Share
Market Overview
| Study Period | 2021 - 2031 |
|---|---|
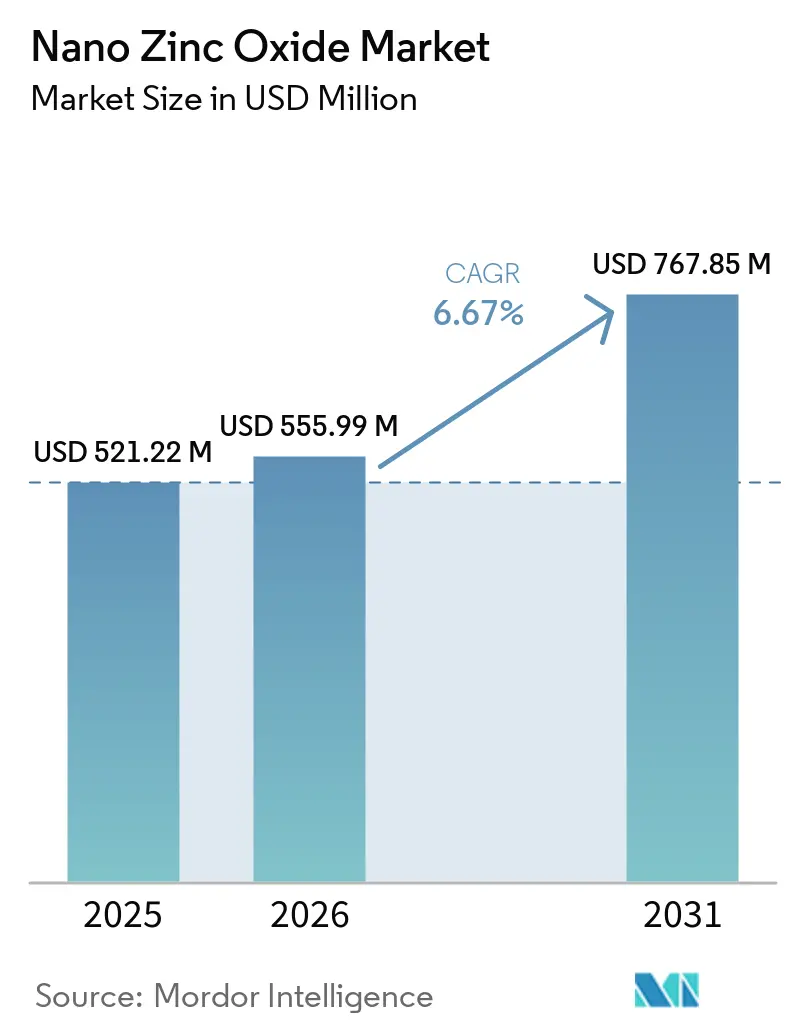
| Market Size (2026) | USD 555.99 Million |
| Market Size (2031) | USD 767.85 Million |
| Growth Rate (2026 - 2031) | 6.67% CAGR |
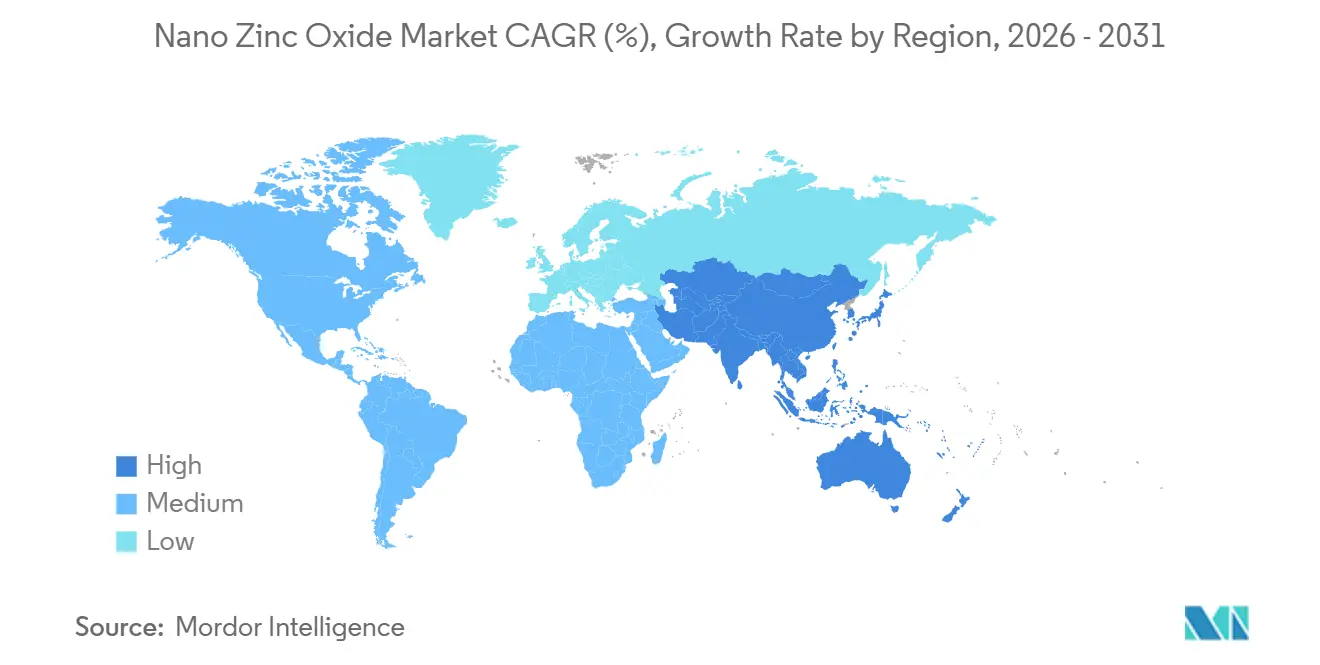
| Fastest Growing Market | Asia-Pacific |
| Largest Market | Asia-Pacific |
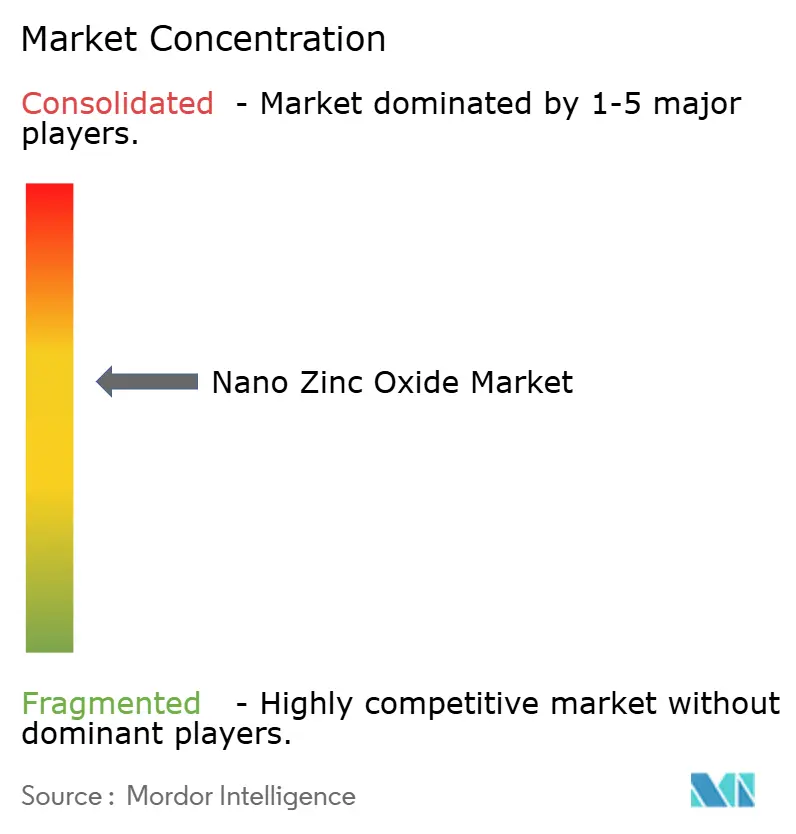
| Market Concentration | Medium |
Major Players *Disclaimer: Major Players sorted in no particular order Image © Mordor Intelligence. Reuse requires attribution under CC BY 4.0. | |
Nano Zinc Oxide Market Analysis by Mordor Intelligence
The Nano Zinc Oxide Market size is projected to expand from USD 521.22 million in 2025 and USD 555.99 million in 2026 to USD 767.85 million by 2031, registering a CAGR of 6.67% between 2026 and 2031. Regulatory momentum favoring mineral UV filters, fast-growing display-panel demand, and rising adoption of antimicrobial coatings are reshaping competitive priorities. Formulators in Europe and North America have accelerated the shift from titanium dioxide toward surface-engineered zinc oxide to avoid nano-specific labeling while maintaining product transparency. In Asia-Pacific, China’s large-scale flame-spray plants and Japan’s transparent-conductor requirements give the region a structural cost and technology edge. Raw-material volatility and tightening worker-exposure limits temper margins but also motivate integrated supply strategies. Together, these forces reinforce a medium-term outlook in which innovation around coating chemistry, dispersion stability, and pharmaceutical bioavailability underpins above-GDP growth for the Nano Zinc Oxide market.
Key Report Takeaways
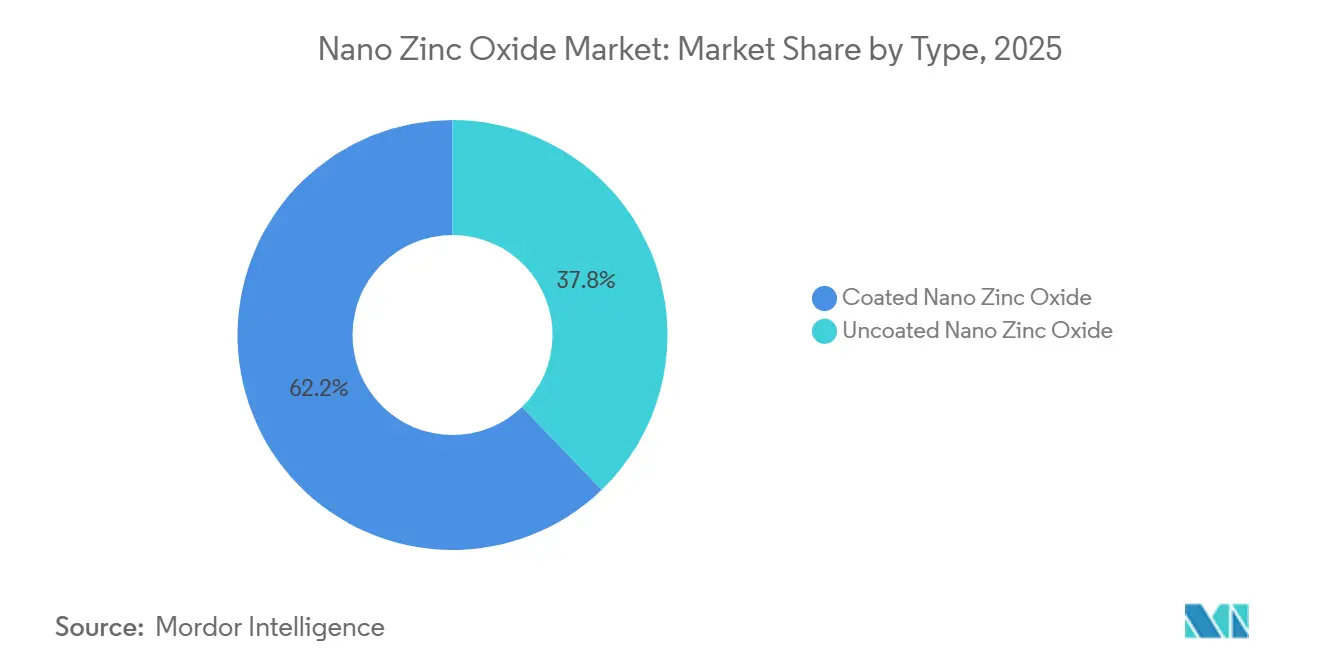
- By type, coated nano zinc oxide led with 62.21% of the Nano Zinc Oxide market share in 2025, whereas Uncoated nano zinc oxide is projected to post the fastest 6.88% CAGR during the forecast period (2026-2031).
- By form, powders accounted for 73.46% share of the Nano Zinc Oxide market size in 2025, while dispersion/slurry formats are set to advance at a 7.01% CAGR during the forecast period (2026-2031).
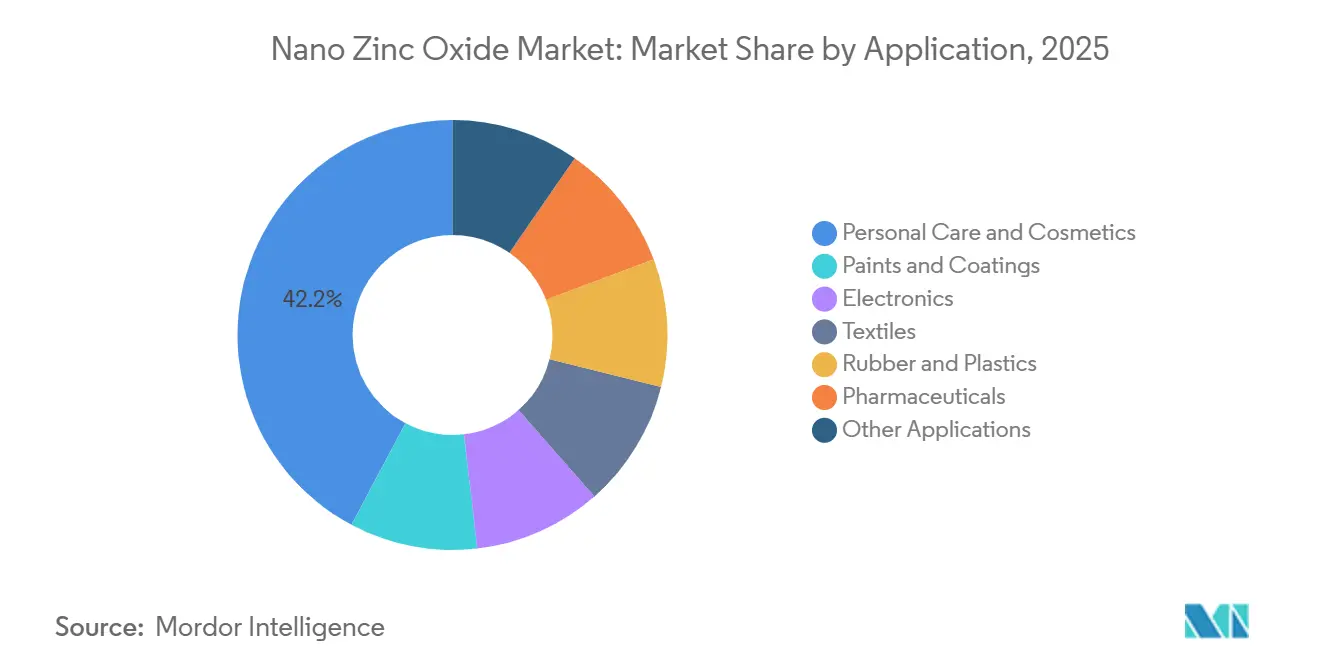
- By application, personal-care products captured 42.21% revenue share in 2025; pharmaceuticals represent the fastest-growing use, accelerating at a 7.88% CAGR during the forecast period (2026-2031).
- By geography, Asia-Pacific dominated with 48.11% share in 2025 and is expected to expand at a 7.74% CAGR during the forecast period (2026-2031).
Note: Market size and forecast figures in this report are generated using Mordor Intelligence’s proprietary estimation framework, updated with the latest available data and insights as of January 2026.
Global Nano Zinc Oxide Market Trends and Insights
Driver Impact Analysis*
| Driver | (~) % Impact on CAGR Forecast | Geographic Relevance | Impact Timeline |
|---|---|---|---|
| Regulatory shift toward non-nano TiO₂ alternatives in sunscreens | +1.2% | Global, with strongest influence in EU and North America | Medium term (2-4 years) |
| Rising use in mini-LED/µ-LED backplane electronics | +0.9% | Asia-Pacific core (Japan, South Korea, China), spill-over to North America | Medium term (2-4 years) |
| Antibacterial surface coatings for high-touch public assets | +0.7% | Global, with early adoption in healthcare facilities across North America, EU, and APAC | Short term (≤ 2 years) |
| EU micro-plastics ban spurring bio-degradable UV-packaging inks | +0.5% | EU primary, expanding to North America and select APAC markets | Long term (≥ 4 years) |
| ZnO varistor ceramics for EV fast-charging surge protection | +0.8% | Global, concentrated in China, EU, and North America EV corridors | Medium term (2-4 years) |
| Source: Mordor Intelligence | |||
Regulatory Shift Toward Non-Nano TiO₂ Alternatives in Sunscreens
Expanded scrutiny of titanium dioxide has redirected sunscreen innovation. The Scientific Committee on Consumer Safety (SCCS) intensified its review of nano-TiO₂ during 2024, prompting formulators to prioritize zinc oxide that stays just above the 100-nm threshold, thereby avoiding nano labeling while preserving transparency. Concurrently, the US Food and Drug Administration (FDA)’s unresolved monograph leaves 12 organic filters in limbo, whereas zinc oxide retains Category I status, reinforcing its safe-harbor advantage[1]U.S. Food and Drug Administration, “Sunscreen Proposed Rule,” fda.gov. Suppliers such as Solésence apply aluminum-oxide and organosilane shells that deliver high SPF with minimal whitening, a capability validated by its Australian TGA site clearance. Market inquiries rose sharply after the May 2025 SCCS ban on 4-methylbenzylidene camphor, consolidating zinc oxide’s position as one of the few globally harmonized UV filters. These converging regulations are forecast to keep mineral actives at the forefront of premium sun-care launches across developed economies.
Rising Use in Mini-LED/µ-LED Backplane Electronics
Display manufacturers are transitioning to aluminum- or gallium-doped zinc oxide as a cost-efficient transparent conductor. Peer-reviewed 2024 studies showed atomic-layer-deposited AZO films achieving sheet resistance below 10 Ω/sq with over 85% visible-light transmittance, meeting 4K and 8K panel specifications. Japan and South Korea integrated these films into premium televisions that shipped in excess of 2 million units in 2025. China’s rapid capacity build-out for mini-LED backlights further elevates regional demand. Because zinc oxide can be solution-processed at low temperatures, the material also aligns with flexible and wearable electronics, positioning the nano zinc oxide market for continued expansion as micro-LED architectures scale commercially.
Antibacterial Surface Coatings for High-Touch Public Assets
Healthcare systems and transit authorities now specify zinc-oxide-embedded paints that achieve 99.9% reductions in Staphylococcus aureus and Escherichia coli within two hours at 0.5 wt% loading. Hospitals in North America and Europe began rollouts in 2024 as silver-ion coatings lost efficacy through leaching. Singapore Mass Rapid Transit reported durable antimicrobial performance after 12 months of heavy ridership exposure in 2025. Because zinc oxide qualifies as a passive antimicrobial in several jurisdictions, formulators avoid annual pesticide reregistration. The push for LEED (Leadership in Energy and Environmental Design) and WELL certifications, which emphasize low-VOC (Volatile Organic Compound) materials, further accelerates adoption.
EU Micro-Plastics Ban Spurring Bio-Degradable UV-Packaging Inks
The European Union (EU) restriction on intentionally added microplastics, effective October 2023, eliminates many polymer-encapsulated organic UV absorbers. Inorganic zinc oxide is exempt, enabling flexographic and gravure printers to maintain UV protection without breaching the ban. Studies published in 2024 demonstrated that 2-3 wt% nano zinc oxide in PET (Polyethylene Terephthalate films increased UV-blocking longevity by 40% while remaining compostable under EN 13432. German and Dutch consumer-goods brands mandated microplastics-free packaging from 2025 onward, creating a captive downstream pull. Dispersion stability remains a cost barrier, yet end-user compliance requirements outweighed the 10-15% raw-material premium during most 2025 tenders.
Restraints Impact Analysis*
| Restraint | (~) % Impact on CAGR Forecast | Geographic Relevance | Impact Timeline |
|---|---|---|---|
| High CAPEX/OPEX for vapor-phase flame-spray synthesis routes | -0.6% | Global, with acute pressure on North American and European producers | Short term (≤ 2 years) |
| Stricter occupational exposure limits for nano-metals | -0.4% | EU and North America primary, with emerging scrutiny in Japan and South Korea | Medium term (2-4 years) |
| Volatile availability-pricing of ≥99.9% purity Zn feedstock | -0.5% | Global, with supply concentration risk in China and Peru | Short term (≤ 2 years) |
| Source: Mordor Intelligence | |||
High CAPEX/OPEX for Vapor-Phase Flame-Spray Synthesis Routes
Building a 10,000 tons per year flame-spray plant requires USD 4-7 million for reactors, precipitators, and pollution controls. Operating costs of USD 800-1,200 per ton, driven by natural-gas flames and exhaust scrubbing, squeeze Western margins, especially with EU carbon allowances exceeding EUR 80 (~USD 93.20) per ton in 2025. Pilot hydrothermal projects achieved cost parity but face scalability challenges due to nucleation kinetics. Until continuous hydrothermal processing matures, Chinese producers with lower utility tariffs retain a structural cost edge, restraining price realization across the nano zinc oxide market.
Stricter Occupational Exposure Limits for Nano-Metals
Human inhalation studies in 2024 recorded systemic cytokine elevation at 1-2 mg/m³ zinc-oxide dust, well below OSHA (Occupational Safety and Health Administration)’s 5 mg/m³ PEL (Permissible Exposure Limit), prompting Denmark to propose a 0.05 mg/m³ limit[2]Occupational Safety and Health Administration, “Zinc Oxide Exposure Limits,” osha.gov. Compliance retrofits, enclosed lines, HEPA (high efficiency particulate air) filtration, and real-time aerosol monitors range from USD 0.5-2 million per line, disproportionately impacting small and mid-size producers. Multinationals with diversified portfolios can amortize upgrades, but fragmented Asian suppliers may underinvest, creating uneven enforcement and potential market disruptions as standards converge globally.
*Our forecasts treat driver/restraint impacts as directional, not additive. The impact forecasts reflect baseline growth, mix effects, and variable interactions.
Segment Analysis
By Type: Coated Grades Dominate for Aesthetics and Stability
Coated variants secured 62.21% nano zinc oxide market share in 2025, owing to surface treatments that reduce photocatalysis and deliver an invisible finish in sunscreens. The premium added cost of USD 2-5/kg is absorbed by personal-care brands that prioritize consumer aesthetics and reef safety. Uncoated grades, though smaller, are predicted to outpace with a 6.88% CAGR as drug-delivery developers need pristine surfaces for optimal cell uptake. Pharmaceutical trials published in 2024 showed 60% bioavailability for uncoated nanoparticles versus 35-40% for coated ones. Regulatory nuance is pivotal: coated grades often require separate EU REACH (Registration, Evaluation, Authorisation and Restriction of Chemicals) dossiers, posing a hurdle for new entrants. Advance ZincTek invested early in REACH and TGA (Therapeutic Goods Administration) compliance, positioning itself for post-4-MBC demand spikes in Europe.
Second-order effects include competitive protection for firms holding coating IP portfolios. Solésence lists 10 US patents and over 100 foreign filings, leveraging exclusivity to negotiate long-term supply agreements with BASF. As consumer brands consolidate suppliers for transparency, the coated segment will remain the pricing anchor of the nano zinc oxide market, while uncoated growth taps higher-margin pharmaceutical channels.


By Form: Powder Retains Scale, Dispersions Capture Growth
Powder accounted for 73.46% of 2025 sales, reflecting entrenched use in dry-blend cosmetics, plastics masterbatch, and varistor ceramics, where existing extrusion and sintering lines rely on solid feedstock. Dispersions/slurry, however, are forecast to grow 7.01% CAGR during the forecast period (2026-2031) on the back of water-based architectural paints that eliminate onsite milling. A field study in Singapore public transit showed 99% bacterial reduction after 12 months when using dispersion-integrated topcoats. The challenge remains pH-triggered agglomeration; Rubamin partnered with Distil in March 2026 to co-develop phosphate-stabilized dispersions for North America, confirming market appetite for plug-and-play intermediates.
Future share shifts hinge on supply-chain efficiencies. Powder bulk logistics favor large-volume commodity grades, yet shipping costs rise for hazardous classifications. Dispersions, shipped as non-dusty liquids, reduce workplace exposure liabilities and align with stricter nano-metal Occupational Exposure Limits (OELs). As coatings makers lock in low-VOC, antimicrobial specs, dispersion suppliers that guarantee lot-to-lot consistency, and Food and Drug Administration (FDA) cosmetic GMP (good manufacturing practice) documentation will secure premium channels within the Nano Zinc Oxide market size landscape.
By Application: Personal Care Leads, Pharmaceuticals Accelerate
Personal care captured 42.21% of 2025 revenue, underlined by consumers’ move toward mineral sunscreens following the Scientific Committee on Consumer Safety (SCCS) and FDA scrutiny over organic filters. Branded finished goods sold by Solésence yielded 3-5 times ingredient margins in 2024, validating downstream integration. Pharmaceuticals are forecasted to advance at a 7.88% CAGR during the forecast period (2026-2031), supported by pulmonary lipid encapsulations showing 60% bioavailability and topical acne formulations entering late-stage trials.
Industrial triad applications, coatings, electronics, and textiles, provide diversification. Paints leverage antimicrobial and UV protection, electronics rely on transparent conductivity in mini-LED backplanes, and textiles demand wash-durable antimicrobial finishes. Stable rubber and plastics usage as vulcanization activators rounds out demand, ensuring the nano zinc oxide market maintains balanced end-use exposure while awaiting pharmaceutical inflection.

Geography Analysis
Asia-Pacific held 48.11% of 2025 revenue, with a forecast of 7.74% CAGR during the forecast period (2026-2031), led by China’s low-cost flame-spray plants and Japan’s electronics demand. Chinese suppliers such as Huzheng and SAT NANO sell commodity powder at USD 1.50-2.13/kg, undercutting Western prices by up to 40%. Quality variability limits penetration in high-value pharma grades, allowing Japanese and Australian players to serve premium niches. India’s cosmetics boom under the PLI scheme and Rubamin’s 50,000 tons per year capacity extension reinforce South Asia’s emerging influence over nano zinc oxide market dynamics.
North America's 2025 market share was buoyed by clean-beauty preferences and EV infrastructure investment. Solésence booked USD 52.3 million revenue in 2024, with finished consumer products representing 85% of sales, demonstrating value capture closer to the brand front line. The December 2025 U.S.-Korea Zinc deal to build a USD 6.7-7.4 billion smelter in Tennessee secures domestic Super Special High Grade (SHG) zinc supply by 2029, mitigating feedstock risk for regional nano zinc oxide market participants.
In Europe, REACH dossier costs and SCCS vigilance create high compliance barriers, favoring incumbents such as BASF and Merck KGaA. The May 2025 4-MBC ban catalyzed mineral UV filter demand, yet Advance ZincTek’s interim report showed flat European sales at AUD 0.41 million, illustrating long formulary qualification cycles. Supply tightness persists for more than or equal to 99.99% purity zinc, prompting EU manufacturers to diversify sourcing via off-take agreements with Kazakhstan and Norway smelters.

Competitive Landscape
The Nano Zinc Oxide market is moderately concentrated. Chinese toll manufacturers, numbering in the dozens, supply price-focused commodities but struggle with global audits. Varistor ceramics and antimicrobial coatings buy large volumes, yet personal care and pharma customers increasingly audit for cGMP and ISO 22716, slicing off high-margin demand. As exposure limits tighten and bioavailability studies expand, suppliers owning surface-engineering IP or vertically integrated zinc refining will consolidate share, steering the nano zinc oxide market toward a balanced mix of scale and specialization.
Nano Zinc Oxide Industry Leaders
ALTANA
EverZinc
Umicore
Merck KGaA
BASF
- *Disclaimer: Major Players sorted in no particular order

Recent Industry Developments
- March 2026: Distil, a platform specializing in specialty chemicals, forged a strategic alliance with Rubamin Private Limited, a producer of zinc compounds. Under this partnership, Distil took on the role of exclusive co-developer, marketer, and distributor for Rubamin's zinc oxide powders, dispersions, and derivatives, focusing on the North American market.
- July 2025: University of Texas at El Paso researchers increased microalgae lipid production to 48% of cell mass using zinc oxide nanoparticles, opening renewable-energy applications.


Global Nano Zinc Oxide Market Report Scope
Nano zinc oxide (ZnO) refers to zinc oxide particles engineered to a size of 1-100 nanometers. Due to this nanoscale size, they exhibit unique properties compared to bulk zinc oxide, including high surface area, high UV absorption, antimicrobial activity, and enhanced transparency. They are widely used in sunscreens, cosmetics, coatings, and medical applications.
The Nano Zinc Oxide market is segmented by type, form, application, and geography. By type, the market is segmented into coated nano zinc oxide and uncoated nano zinc oxide. By form, the market is segmented into powder and dispersion/slurry. By application, the market is segmented into Personal Care and Cosmetics, Paints and Coatings, Electronics, Textiles, Rubber and Plastics, Pharmaceuticals, and Other Applications (Textiles, Rubber, and More). The report also covers the market size and forecasts for nano zinc oxide in 17 countries across major regions in value (USD).
| Coated Nano Zinc Oxide |
| Uncoated Nano Zinc Oxide |
| Powder |
| Dispersion/Slurry |
| Personal Care and Cosmetics |
| Paints and Coatings |
| Electronics |
| Textiles |
| Rubber and Plastics |
| Pharmaceuticals |
| Other Applications (Textiles, Rubber, and More) |
| Asia-Pacific | China |
| Japan | |
| India | |
| South Korea | |
| ASEAN Countries | |
| Rest of Asia-Pacific | |
| North America | United States |
| Canada | |
| Mexico | |
| Europe | Germany |
| United Kingdom | |
| France | |
| Italy | |
| Spain | |
| Russia | |
| NORDIC Countries | |
| Rest of Europe | |
| South America | Brazil |
| Argentina | |
| Rest of South America | |
| Middle-East and Africa | Saudi Arabia |
| South Africa | |
| Rest of Middle-East and Africa |
| By Type | Coated Nano Zinc Oxide | |
| Uncoated Nano Zinc Oxide | ||
| By Form | Powder | |
| Dispersion/Slurry | ||
| By Application | Personal Care and Cosmetics | |
| Paints and Coatings | ||
| Electronics | ||
| Textiles | ||
| Rubber and Plastics | ||
| Pharmaceuticals | ||
| Other Applications (Textiles, Rubber, and More) | ||
| By Geography | Asia-Pacific | China |
| Japan | ||
| India | ||
| South Korea | ||
| ASEAN Countries | ||
| Rest of Asia-Pacific | ||
| North America | United States | |
| Canada | ||
| Mexico | ||
| Europe | Germany | |
| United Kingdom | ||
| France | ||
| Italy | ||
| Spain | ||
| Russia | ||
| NORDIC Countries | ||
| Rest of Europe | ||
| South America | Brazil | |
| Argentina | ||
| Rest of South America | ||
| Middle-East and Africa | Saudi Arabia | |
| South Africa | ||
| Rest of Middle-East and Africa | ||


Key Questions Answered in the Report
What is the projected revenue for Nano Zinc Oxide in 2031?
The Nano Zinc Oxide market is forecast to reach USD 767.85 million by 2031 from USD 555.99 million in 2026 growing at CAGR of 6.67% during the forecast period (2026-2031).
Which region will grow fastest through 2031?
Asia-Pacific is expected to expand at a 7.74% CAGR during the forecast period (2026-2031), driven by China’s capacity scale and Japan’s electronics demand.
Why are coated grades dominant in commercial sunscreens?
Coated zinc oxide delivers transparent finish, reduced photocatalysis, and regulatory compliance, capturing 62.21% share in 2025.
How will new occupational exposure limits affect producers?
Stricter nano-metal limits require enclosed processes and filtration upgrades costing USD 0.5-2 million per line, favoring integrated players.
Page last updated on:


