Gold Nanoparticles Market Size and Share
Market Overview
| Study Period | 2020 - 2031 |
|---|---|
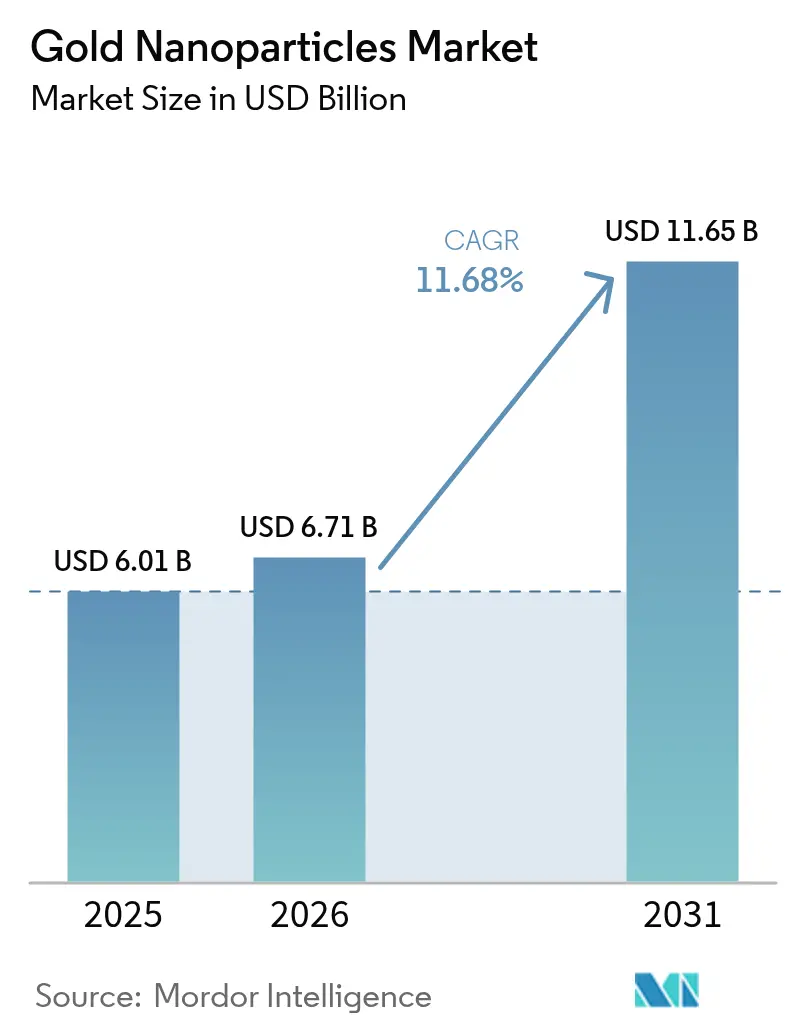
| Market Size (2026) | USD 6.71 Billion |
| Market Size (2031) | USD 11.65 Billion |
| Growth Rate (2026 - 2031) | 11.68% CAGR |
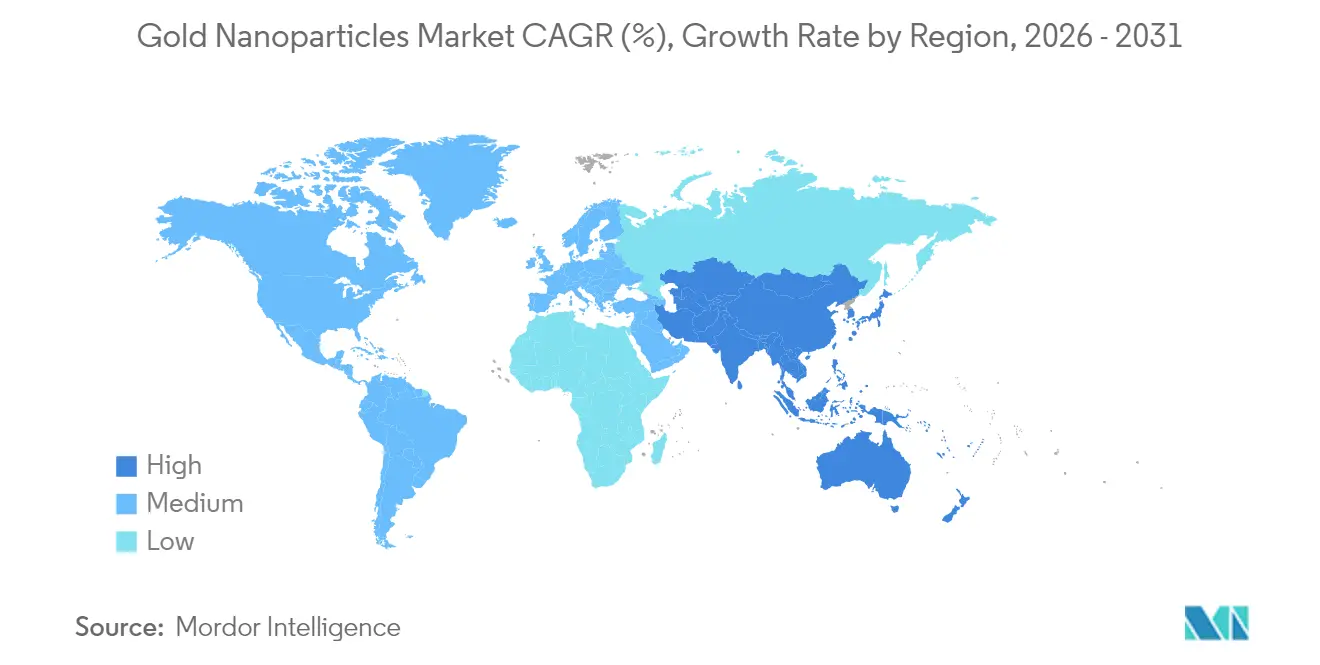
| Fastest Growing Market | Asia Pacific |
| Largest Market | North America |
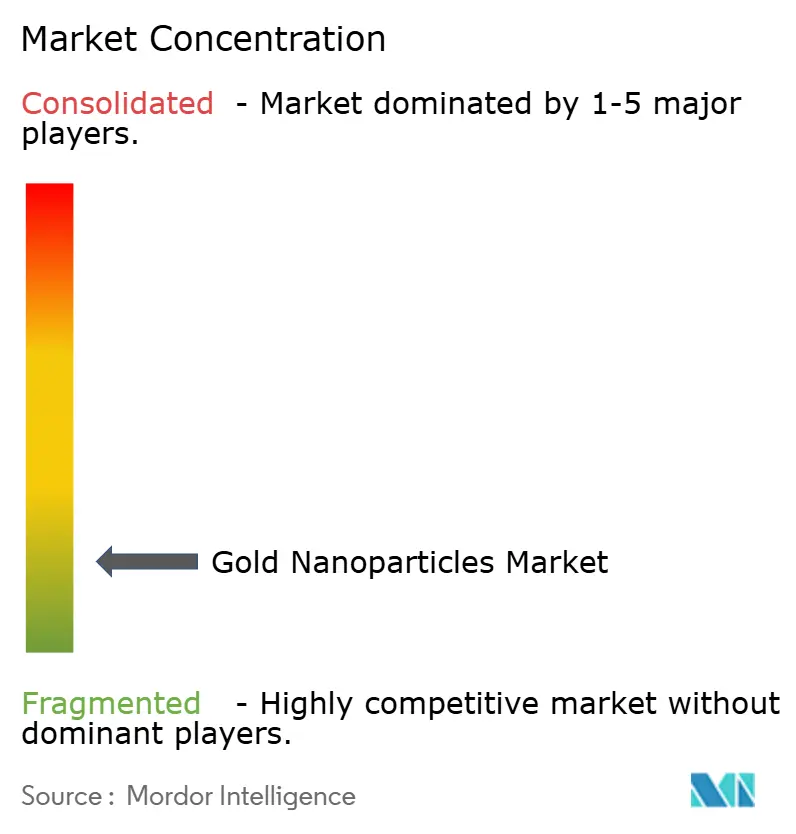
| Market Concentration | Low |
Major Players *Disclaimer: Major Players sorted in no particular order Image © Mordor Intelligence. Reuse requires attribution under CC BY 4.0. | |
Gold Nanoparticles Market Analysis by Mordor Intelligence
Gold Nanoparticles market size in 2026 is estimated at USD 6.71 billion, growing from 2025 value of USD 6.01 billion with 2031 projections showing USD 11.65 billion, growing at 11.68% CAGR over 2026-2031. Escalating precision-medicine programs, persistent electronics miniaturization, and progress in continuous-flow green synthesis collectively lift demand for high-purity nanoparticles across healthcare, semiconductor, energy, and environmental use cases. Targeted drug-delivery platforms already account for 26.11% of current revenue and continue to attract investment as regulators approve more theranostic trials. Continuous-flow and microfluidic synthesis lines are scaling rapidly, lowering batch variability and hazardous-waste volumes while cutting operating expenses for producers. On the demand side, healthcare commands the largest uptake, yet the electronics segment registers the highest growth velocity as flexible and printed sensors migrate from lab to mass production. Gold-price volatility remains an operational risk, but coatings that reduce precious-metal loading per unit and recycling initiatives buffer near-term margin swings.
Key Report Takeaways
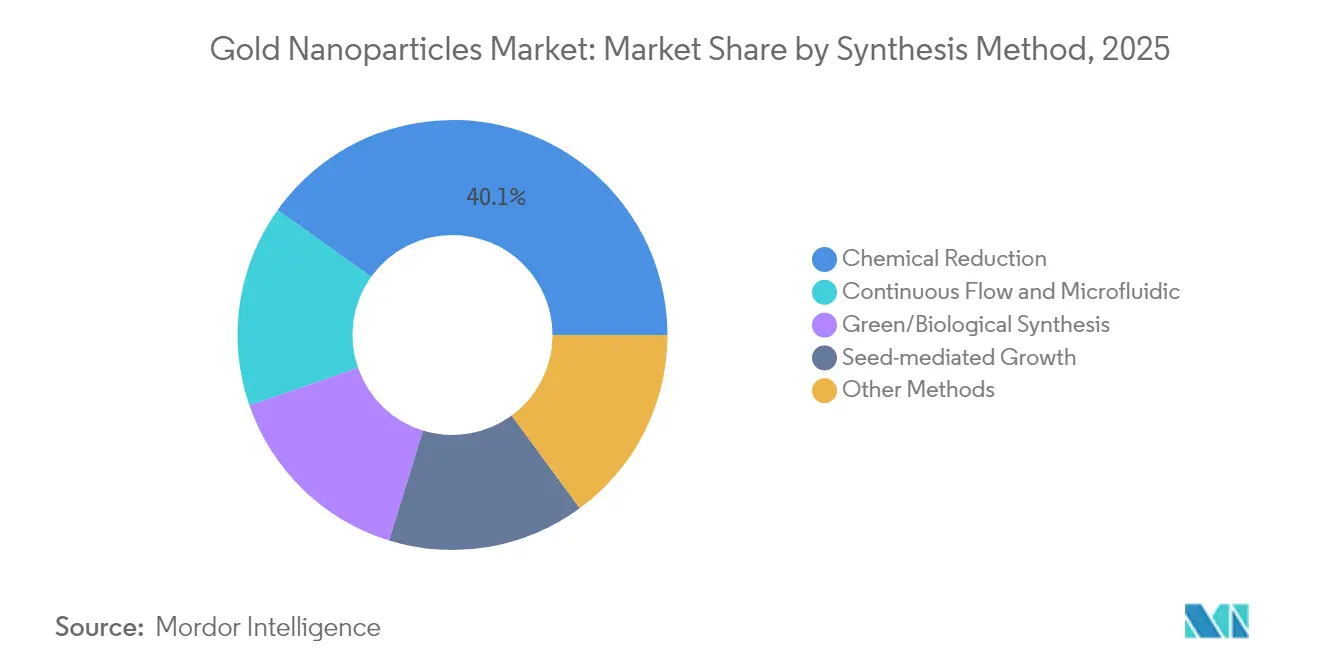
- By synthesis method, chemical reduction held 40.12% of the gold nanoparticles market size in 2025, whereas continuous-flow reactors are advancing at a 12.02% CAGR over the same horizon.
- By application, targeted drug delivery captured 25.76% of the gold nanoparticles market share in 2025, while imaging platforms are expanding at a 12.74% CAGR through 2031.
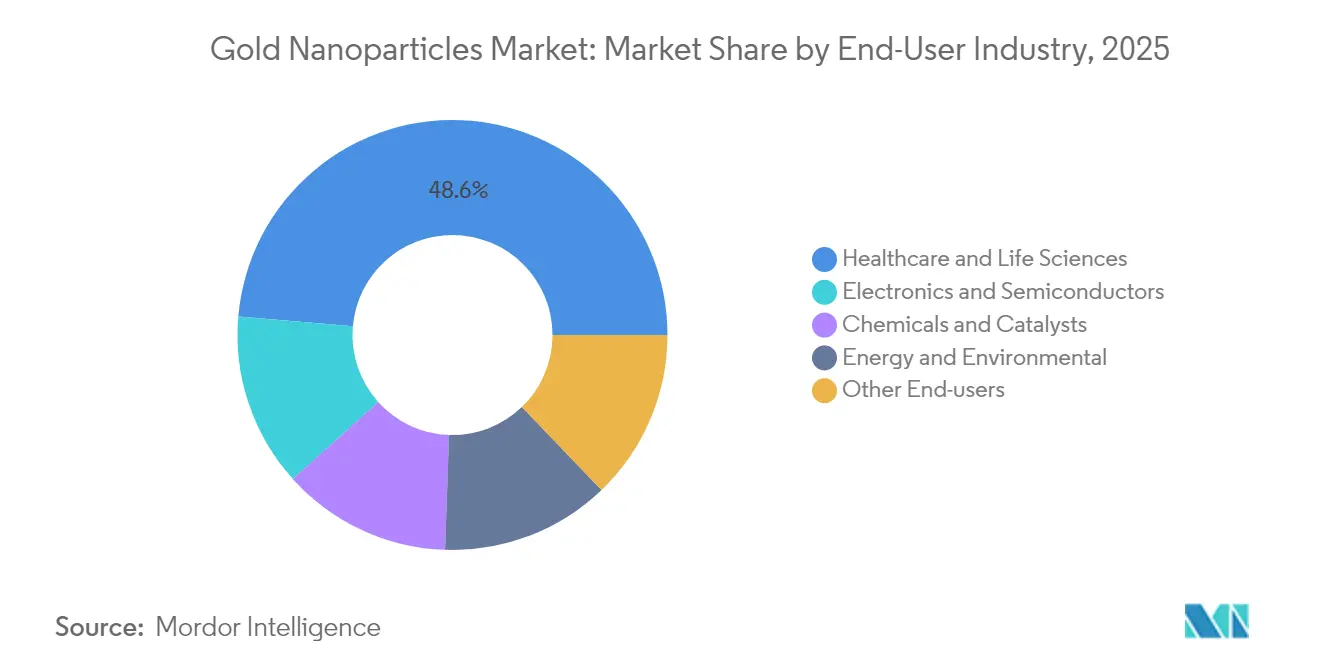
- By end-user industry, healthcare and life sciences controlled 48.62% revenue share in 2025; electronics and semiconductors exhibit the fastest 12.30% CAGR to 2031.
- By geography, North America led with 36.02% market share in 2025, while Asia-Pacific is forecast to post a 12.62% CAGR through 2031.
Note: Market size and forecast figures in this report are generated using Mordor Intelligence’s proprietary estimation framework, updated with the latest available data and insights as of 2026.
Global Gold Nanoparticles Market Trends and Insights
Drivers Impact Analysis*
| Driver | (~) % Impact on CAGR Forecast | Geographic Relevance | Impact Timeline |
|---|---|---|---|
| Rising nanotechnology applications in medical industry | +3.2% | Global; North America & EU core | Medium term (2-4 years) |
| Growing adoption in high-end electronics & photonics | +2.8% | APAC core; spill-over to North America | Short term (≤ 2 years) |
| Sustainable green synthesis methods lowering regulatory risk | +2.1% | Global; early EU & North America adoption | Long term (≥ 4 years) |
| Precision oncology demand for theranostic agents | +1.9% | North America & EU; expanding to APAC | Medium term (2-4 years) |
| Next-gen flexible/printed sensors for IoT devices | +1.5% | APAC manufacturing hubs; global deployment | Short term (≤ 2 years) |
| Source: Mordor Intelligence | |||
Rising Nanotechnology Applications in Medical Industry
Hospitals, contract research organizations, and device makers are moving beyond passive drug carriers to multifunction theranostic constructs that combine imaging and therapy on a single gold core, enabling clinicians to destroy tumors via photothermal heating while concurrently tracking treatment in real time. DNA-barcoded nanoparticle libraries now let oncologists screen several payload combinations inside one patient sample, cutting preclinical timelines and raising response rates for hard-to-treat malignancies. Regulatory agencies have accelerated review pathways for nanomedicines that demonstrate clear biocompatibility, helping three US clinical programs move into Phase II during 2025. Research teams are also probing neural-interface coatings that could translate the same plasmonic heating principle to minimally invasive brain stimulation. As datasets validate long-term safety profiles, hospital purchasing groups are earmarking budget for nanoparticle-guided ablation systems that integrate with standard imaging consoles. These transitions collectively add 3.2 percentage points to the gold nanoparticles market CAGR through mid-decade.
Growing Adoption in High-End Electronics & Photonics
Smart-watch, e-textile, and implantable sensor makers insert gold nanowires into ultrathin circuitry to raise conductivity while keeping bending radii below 1 mm, a key threshold for comfortable skin-mounted patches. Photonics research shows that embedding 10 nm spheres inside organic solar-cell photo-absorbers can lift power-conversion efficiency by more than 30% through localized surface-plasmon amplification[1].Rui Zhu et al., “Plasmonic Enhancement in Organic Solar Cells,” Nature Communications, nature.com RFID developers leverage gold seeds to boost antenna gain at gigahertz frequencies, widening read ranges without increasing tag size. Production readiness is high thanks to inkjet-printable nanoparticle inks that sinter at temperatures below 120 °C, compatible with PET and TPU films used in wearables. The electronics driver injects 2.8 points into forecast CAGR, with commercial shipments already ramping at factories in Japan, South Korea, and Taiwan that supply the global notebook, smartphone, and IoT modules sectors.
Sustainable Green Synthesis Methods Lowering Regulatory Risk
Botanical extracts from eucalyptus leaves and neem bark now replace sodium citrate and hydrazine in pilot-scale reactors, eliminating toxic residuals and trimming wastewater treatment fees by 40%. Vortex-fluidic devices mounted on continuous-flow skids yield uniform 15 nm particles in pure water, co-producing hydrogen gas that plants feed into boilers for on-site heat, enhancing overall process economics. Lifecycle assessments indicate that green routes can cut energy use by almost one-third compared with classical batch reduction, easing compliance under tightening European chemicals legislation. Industry councils in Germany and the US have begun drafting voluntary eco-labels that reward verified green nanoparticles, allowing downstream brands to market low-carbon diagnostics and sensors. Artificial-intelligence controllers further refine feed rates and residence times to hold standard deviation below 1.5 nm, rivalling pharmaceutical manufacturing precision. These advances lift adoption for high-volume diagnostics and electronics lines, contributing 2.1 points to long-term growth.
Precision Oncology Demand for Theranostic Agents
Gold nano-shells functionalized with folic-acid ligands steer chemotherapeutics directly to ovarian tumor sites, cutting systemic dosage by 70% in preclinical runs while doubling survival in murine models. Concurrent CT and fluorescence imaging from the same particle allows surgeons to delineate margins more accurately, slashing recurrence rates after resection. Radio-nuclide enabled particles deliver beta radiation at the cell membrane, complementing photothermal killing for multi-modal attack vectors. As reimbursement frameworks start to recognize combined diagnostic-therapy packages, oncology centers project double-digit procurement growth. Medium-term impact sits at +1.9 points to CAGR, contingent on FDA and EMA progression of current Phase II pipelines into pivotal trials by 2027.
Restraints Impact Analysis*
| Restraint | (~) % Impact on CAGR Forecast | Geographic Relevance | Impact Timeline |
|---|---|---|---|
| Volatility in gold prices | -2.3% | Global; highest in cost-sensitive markets | Short term (≤ 2 years) |
| Safety & long-term toxicity concerns | -1.8% | Global; stricter in EU & North America | Medium term (2-4 years) |
| Emerging nano-material substitutes (quantum dots, etc.) | -1.2% | Technology-advanced regions; gradual global spread | Long term (≥ 4 years) |
| Source: Mordor Intelligence | |||
Volatility in Gold Prices
Benchmark bullion prices climbed almost 25% during the first half of 2025 as investors sought havens amid geopolitical shocks, pushing nanoparticle producers’ raw-material spend to multi-year highs. Exchange-traded funds added more than 160 tonnes during the same window, siphoning supply from industrial channels. Many device OEMs lock quarterly contracts, yet spot spikes feed through to specialty ink and reagent catalogs within weeks, delaying project launches in diagnostics and printed-electronics niches. Hedging offers partial relief but raises working-capital needs, squeezing small firms that lack scale. Protective coatings that enable 30% metal-content reduction per chip are mitigating the blow, though adoption is uneven in medical segments that demand thicker biocompatible shells. The restraint subtracts 2.3 points from near-term CAGR until bullion prices stabilize or recycling yields improve.
Safety & Long-Term Toxicity Concerns
Although gold is generally inert, studies reveal reactive-oxygen-species generation in specific size ranges and under certain light exposures, calling for strict dosage control in photothermal therapy protocols. Regulators in the EU introduced additional nanotoxicology dossier requirements in 2025, extending approval timelines by eight to 12 months for new contrast agents. Researchers have observed differential accumulation in liver and spleen tissues beyond 180 days in rodent models, prompting calls for longer follow-up in human trials. Companies are investing in PEGylation and zwitterionic surface chemistries that speed renal clearance, yet those modifications add cost and lengthen formulation cycles. This caution dampens roll-outs of next-gen theranostic platforms, lowering CAGR contribution by 1.8 points pending clearer long-term human data.
*Our forecasts treat driver/restraint impacts as directional, not additive. The impact forecasts reflect baseline growth, mix effects, and variable interactions.
Segment Analysis
By Synthesis Method: Continuous-Flow Reactors Reshape Production
Chemical reduction accounted for 40.12% of the gold nanoparticles market size in 2025, a legacy position rooted in established batch infrastructure across North America and Europe. Yet downstream users now demand tighter particle-size distributions and lower solvent footprints, tipping procurement decisions toward continuous-flow lines that log a robust 12.02% CAGR to 2031. Plant operators retrofit vortex-fluidic modules that shear precursor streams into micron-thick films, promoting uniform nucleation while capturing hydrogen coproduct for on-site boiler fuel. AI-guided sensors adjust residence-time loops in real time, holding polydispersity indexes below 0.08 and elevating lot-to-lot reproducibility for pharmaceutical customers.
The shift also intersects with green-chemistry imperatives because flow reactors use aqueous media and ambient pressure, slashing energy intensity by nearly one-third versus citrate batch routes. Seed-mediated growth schemes layered onto the same skid allow production of rods, prisms, and core–shell configurations without opening the system, minimizing contamination risk. Developers of high-resolution biosensors increasingly embed bespoke shapes generated via flow-switch programming, capturing margin premiums well above commodity colloids. As validation batches scale, analysts expect continuous-flow capacity share to pass 30% by 2028, cementing its status as the new reference standard for regulated therapeutic and diagnostic end uses.


By Application: Targeted Drug Delivery Anchors Medical Revenues
Targeted drug-delivery systems commanded 25.76% of the gold nanoparticles market share in 2025 owing to superior payload-to-carrier ratios and multi-modal imaging options. Early 2025 trial readouts confirm that folic-acid capped 20 nm spheres achieve tumor-to-blood concentration ratios exceeding 8:1, surpassing liposomal baselines by a wide berth. Clinical chemistry labs exploit identical plasmonic peaks to build real-time in-vivo monitoring modules, closing feedback loops between dose and response. Imaging applications follow closely, integrating nanoparticles into computed-tomography contrast kits that reach fivefold X-ray attenuation relative to iodine formulations at equivalent dosage.
Sensors, in vitro diagnostics, and catalysis provide diversified revenue, each leaning on the same localized-surface-plasmon effect to improve detection thresholds or reaction rates. Catalysis researchers have encapsulated gold nanoparticle clusters within oxide nanocages that withstand 600 °C, unlocking stable CO-oxidation performance for automotive after-treatment lines. Emerging segments such as retinal-vision restoration use infrared-triggered nano-rods to stimulate ganglion cells, suggesting fresh therapeutic horizons once ocular-toxicity studies conclude. Altogether, pharmaceutical and diagnostic innovators plan to boost volume commitments by double digits annually, reinforcing medical dominance throughout the decade.
By End-User Industry: Healthcare Dominance Amid Electronics Surge
Hospitals, biopharma firms, and diagnostic kit makers absorbed 48.62% of total shipments in 2025, confirming healthcare’s anchor role in the gold nanoparticles market. Regulatory approvals for nanoparticle-enabled photothermal ablation devices in the US and Japan corroborate confidence in safety profiles when purity exceeds 99.9%. Healthcare buyers also favor suppliers that certify ISO 13485 production lines, a credential now required in many tenders for in-vitro-diagnostic reagents.
Electronics remains the fastest-growing end-use at 12.30% CAGR to 2031 as printed and flexible circuits adopt plasmonic inks that maintain conductivity under repeated bending cycles. Semiconductor foundries in Taiwan and South Korea have begun experimenting with sub-10 nm seeds to replace platinum in certain barrier layers, trimming cost and improving electromigration resistance. Chemical-process industries deploy gold-based catalysts in low-temperature CO-oxidation and green-ethylene epoxidation streams, expanding their share of catalyst budgets. Energy researchers are coupling nanoparticles with perovskite layers in tandem solar cells, eyeing commercial module launches beyond 2027 once encapsulation hurdles resolve.
Geography Analysis
North America retained 36.02% of global revenue in 2025, underpinned by deep R&D budgets, FDA oversight that standardizes quality, and integrated supply chains bridging academic labs with contract manufacturers. Academic–industry consortia in Boston and San Diego help spin off start-ups that license nanoparticle IP for oncology, cardiology, and neurology applications. Stimulus grants channeled through the National Institutes of Health in 2025 further enlarge domestic pilot capacities, ensuring short lead times for clinical-grade material.
Asia-Pacific posts the swiftest 12.62% CAGR, reflecting China’s large-scale colloid reactors, India’s expanding generics sector, and Japan’s sensor innovation ecosystem. Policy incentives in Guangdong and Zhejiang provinces reimburse up to 20% of capital outlays for continuous-flow lines that meet ISO 14001 benchmarks, fast-tracking green production footprints. Semiconductor companies headquartered in Seoul and Hsinchu consume rising nanoparticle volumes for high-density interposers and thermal-interface pads, while ASEAN electronics exporters use printed antennas in logistics trackers and smart-package labels.
Europe balances regulatory rigour with sustainability leadership, supporting market development through Horizon Europe grants that prioritize green-chemistry upgrades and circular-economy pilot trials. German automotive suppliers validate gold-catalyzed NOx-reduction modules engineered for next-generation fuel-cell vehicles. Meanwhile, Nordic med-tech clusters incorporate nanoparticle tags into rapid-sepsis tests aimed at point-of-care settings, addressing public-health priorities under the EU’s Beating Cancer Plan.

Competitive Landscape
The gold nanoparticles market sits in a highly fragmented zone, leaving ample room for specialist firms. Johnson Matthey leverages its precious-metal refinery network and spends heavily on low-loading catalyst technology to stabilize earnings during bullion swings. TANAKA Holdings scales colloidal lines at its Shonan facility to serve Japanese optics and sensor accounts that demand sub-5 nm dispersion. Merck KGaA combines off-the-shelf colloids with customizable surface chemistries inside its M Lab Collaboration Centers, accelerating co-development with biopharma partners.
Niche suppliers such as Cytodiagnostics and Sona Nanotech focus on high-purity, endotoxin-free formulations certified for clinical trials, carving out premium segments where lot traceability is paramount. New entrants emphasize machine-learning-guided synthesis, claiming 50% faster process-development cycles and lower scrap ratios. Strategic collaborations abound: in 2025, a Taiwanese foundry signed a multiyear exclusivity pact with a Canadian nanoparticle formulator to co-engineer conductive inks for fan-out packaging lines. Meanwhile, venture capital funds are backing start-ups that integrate nanoparticle antennas into low-orbit satellite payloads, signalling wider market horizons.
Overall, competitive strategy hinges on securing intellectual property around shape-controlled synthesis, vertical integration from powder to functional ink, and data-rich application know-how. Players that blend materials science with AI and sustainability credentials stand positioned to capture outsized share as downstream industries pivot toward greener, smarter, smaller products.
Gold Nanoparticles Industry Leaders
Merck KGaA
nanoComposix
BBI Solutions
TANAKA Holdings Co., Ltd.
Johnson Matthey Plc
- *Disclaimer: Major Players sorted in no particular order

Recent Industry Developments
- January 2025: Researchers at the National University of Singapore (NUS) introduced a method using DNA-barcoded gold nanoparticles to enhance cancer treatment precision. The study demonstrated the effectiveness of triangular nanoparticles in delivering nucleic acids and heating tumor cells during photothermal therapy.
- February 2024: Researchers at Goa University have achieved a notable advancement in the development of gold nanoparticles, significantly improving their efficiency in transporting medicines throughout the human body. This innovation holds potential for enhancing drug delivery systems in healthcare.


Global Gold Nanoparticles Market Report Scope
Gold nanoparticles are small gold particles with a diameter of 1-100 nanometers that, once dispersed in water, are known as colloidal gold. Gold nanoparticles are widely used in electronics, photodynamic therapy, therapeutic agent delivery, sensors, probes, diagnostics, and as catalysts in a number of chemical reactions. The market is segmented by application, end-user industry, and geography. By application, the market is segmented into imaging, targeted drug delivery, sensors, in vitro diagnostics, probes, catalysis, and other applications. By end-user industry, the market is segmented into electronics, healthcare, chemicals, and other end-user industries. The report also covers the market size and forecasts for the gold nanoparticles market in 11 countries across major regions. For each segment, the market sizing and forecasts have been done on the basis of revenue (USD million).
| Chemical Reduction |
| Green/Biological Synthesis |
| Seed-mediated Growth |
| Continuous Flow and Microfluidic |
| Other Methods |
| Imaging |
| Targeted Drug Delivery |
| Sensors |
| In Vitro Diagnostics |
| Probes |
| Catalysis |
| Other Applications |
| Electronics and Semiconductors |
| Healthcare and Life Sciences |
| Chemicals and Catalysts |
| Energy and Environmental |
| Other End-User Industries |
| Asia-Pacific | China |
| India | |
| Japan | |
| South Korea | |
| ASEAN | |
| Rest of Asia-Pacific | |
| North America | United States |
| Canada | |
| Mexico | |
| Europe | Germany |
| United Kingdom | |
| France | |
| Italy | |
| NORDIAC | |
| Russia | |
| Rest of Europe | |
| South America | Brazil |
| Argentina | |
| Rest of South America | |
| Middle East and Africa | Saudi Arabia |
| United Arab Emirates | |
| South Africa | |
| Rest of Middle East and Africa |
| By Synthesis Method | Chemical Reduction | |
| Green/Biological Synthesis | ||
| Seed-mediated Growth | ||
| Continuous Flow and Microfluidic | ||
| Other Methods | ||
| By Application | Imaging | |
| Targeted Drug Delivery | ||
| Sensors | ||
| In Vitro Diagnostics | ||
| Probes | ||
| Catalysis | ||
| Other Applications | ||
| By End-user Industry | Electronics and Semiconductors | |
| Healthcare and Life Sciences | ||
| Chemicals and Catalysts | ||
| Energy and Environmental | ||
| Other End-User Industries | ||
| By Geography | Asia-Pacific | China |
| India | ||
| Japan | ||
| South Korea | ||
| ASEAN | ||
| Rest of Asia-Pacific | ||
| North America | United States | |
| Canada | ||
| Mexico | ||
| Europe | Germany | |
| United Kingdom | ||
| France | ||
| Italy | ||
| NORDIAC | ||
| Russia | ||
| Rest of Europe | ||
| South America | Brazil | |
| Argentina | ||
| Rest of South America | ||
| Middle East and Africa | Saudi Arabia | |
| United Arab Emirates | ||
| South Africa | ||
| Rest of Middle East and Africa | ||


Key Questions Answered in the Report
What is the projected revenue for the gold nanoparticles market in 2031?
The gold nanoparticles market is expected to reach USD 11.65 billion by 2031, growing at an 11.68% CAGR from its 2026 base.
Which application segment currently represents the largest revenue share?
Targeted drug-delivery systems lead with 25.76% of 2025 sales, reflecting strong clinical momentum for nanoparticle-enabled oncology therapies.
Why are continuous-flow reactors gaining popularity in gold nanoparticle manufacturing?
Continuous-flow lines deliver tighter particle-size control, cut solvent use, and integrate green-chemistry principles, explaining their forecast 12.02% CAGR through 2031.
Which region is expected to record the fastest demand growth?
Asia-Pacific registers the highest 12.62% CAGR, driven by large-scale manufacturing capacity, rising healthcare investments, and rapid IoT sensor adoption.
Page last updated on:


