
Market Overview
| Study Period | 2020 - 2031 |
|---|---|
| Market Size (2026) | USD 1.9 Billion |
| Market Size (2031) | USD 4.74 Billion |
| Growth Rate (2026 - 2031) | 20.07 % |
| Fastest Growing Market | Asia-Pacific |
| Largest Market | Asia-Pacific |
| Market Concentration | Medium |
Major Players *Disclaimer: Major Players sorted in no particular order Image © Mordor Intelligence. Reuse requires attribution under CC BY 4.0. | |
Nanofiber Market Analysis by Mordor Intelligence
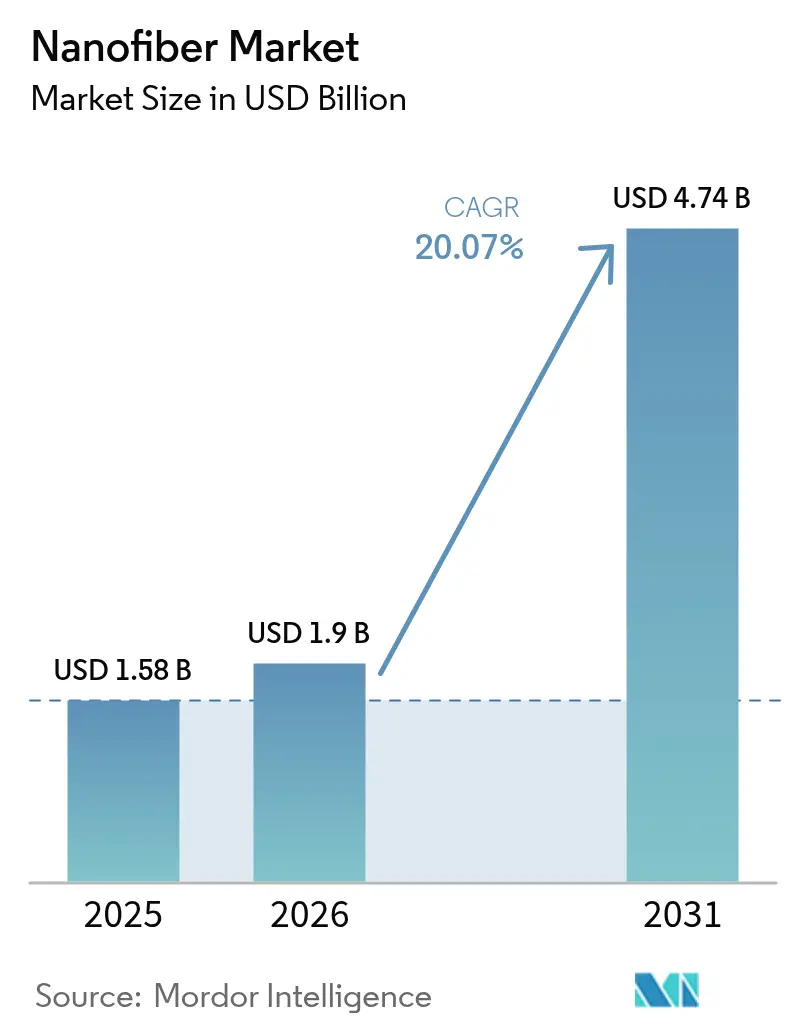
The Nanofiber Market size was valued at USD 1.58 billion in 2025 and estimated to grow from USD 1.9 billion in 2026 to reach USD 4.74 billion by 2031, at a CAGR of 20.07% during the forecast period (2026-2031). Heightened demand for high-surface-area materials in medical, filtration, energy storage, and advanced textile applications anchors this outlook. Asia-Pacific, with an existing 38% revenue lead, benefits from strong manufacturing ecosystems and is expected to expand at 22% CAGR through 2030, reinforcing its dual role as both the largest and fastest-growing regional base. The polymeric product category holds 42% of 2024 revenue, supported by mature electrospinning capacity, while carbohydrate-based grades set the growth tempo at 27% CAGR, reflecting a wider sustainability shift. Global incumbents such as Toray Industries and DuPont maintain volume leadership while innovators like NanoLayr deploy proprietary manufacturing to capture high-margin medical and energy niches. Persistent scale-up hurdles for carbon nanofibers, coupled with price volatility in polyacrylonitrile (PAN) feedstock, temper the near-term supply outlook.
Key Report Takeaways
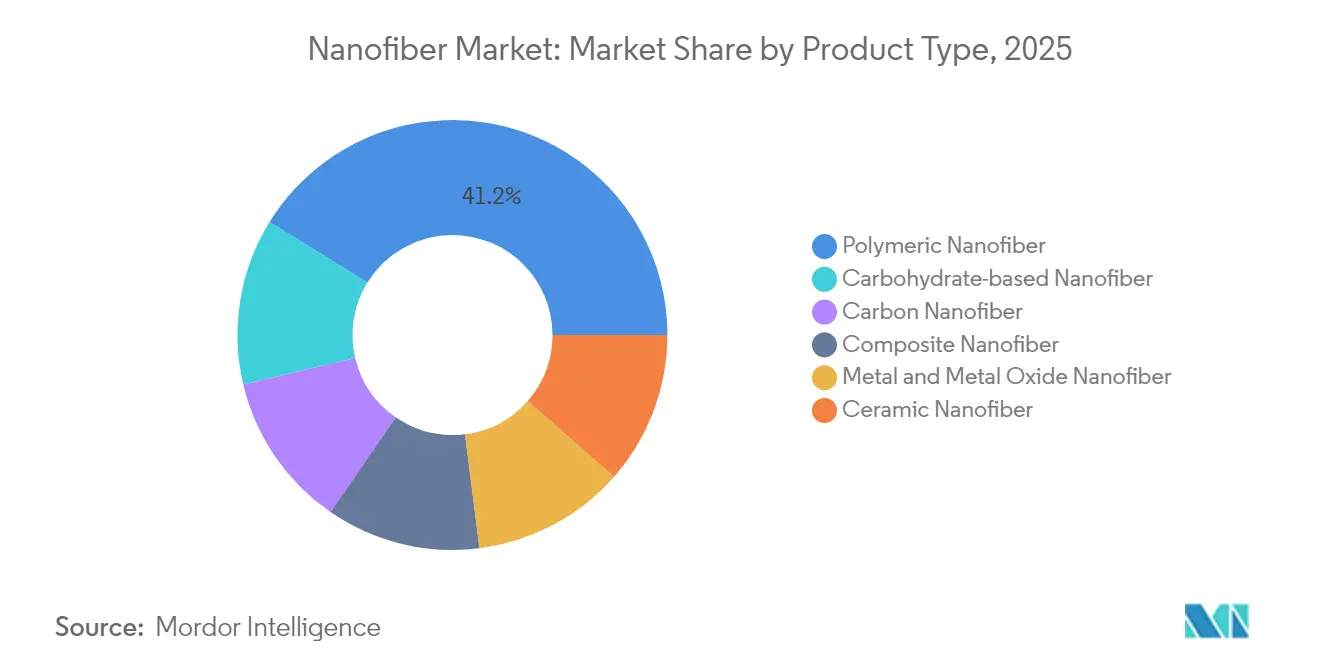
- By product type, polymeric grades led with 41.20% revenue share in 2025, whereas carbohydrate-based nanofibers are projected to clock a 26.2% CAGR to 2031 .
- By application, water and air filtration commanded 39.30% of the nanofiber market share in 2025; energy storage applications are expected to register the fastest growth at 27.1%-plus CAGR through 2031.
- By manufacturing technology, electrospinning retained a 57.20% revenue share in 2025, while forcespinning is forecast to expand at 22.1% CAGR to 2031.
- By geography, Asia-Pacific captured 37.60% of 2025 revenue; the region is also set to post the highest regional CAGR of 21.4% during 2026-2031.
Note: Market size and forecast figures in this report are generated using Mordor Intelligence’s proprietary estimation framework, updated with the latest available data and insights as of 2026.
Market Trends and Insights
Drivers Impact Analysis of Nanofiber Market*
| Driver | (~) % Impact on CAGR Forecast | Geographic Relevance | Impact Timeline |
|---|---|---|---|
| Increasing Demand from the Medical and Pharmaceutical Industries | +5.20% | North America, Europe, Asia-Pacific | Medium term (2-4 years) |
| Demand for High-Surface-Area Battery Separators in EV Gigafactories | +4.80% | Asia-Pacific, North America, Europe | Medium term (2-4 years) |
| Demand for High-Efficiency Filtration Materials | +3.50% | Global, most acute in urban Asia-Pacific | Short term (≤ 2 years) |
| Growth in the Automotive Industry | +2.80% | Asia-Pacific, North America, Europe | Medium term (2-4 years) |
| Expansion in the Textile Industry | +2.40% | Asia-Pacific, with growth in North America | Medium term (2-4 years) |
| Source: Mordor Intelligence | |||
Increasing Demand from Medical and Pharmaceutical Industries
Nanofiber-based drug delivery platforms now achieve 85%-plus drug loading and sustained release for up to 96 hours, sharply improving therapeutic adherence and lowering systemic toxicity. Their extracellular-matrix-like architecture supports superior cell attachment, enabling next-generation tissue scaffolds that cut healing time and minimize scarring[1]Deepanjan Datta et al., “Cellulose-Based Nanofibers for Wound Healing,” pubs.acs.org . Hospitals adopting advanced wound dressings cite patient-turnover gains that translate to reduced care costs, strengthening procurement appetite. Regulatory pathways for nanofiber scaffolds in orthopedics continue to clarify, lowering time-to-market risk for developers. Collectively, these medical breakthroughs elevate reimbursement prospects and reinforce recurring demand across high-value healthcare channels.
Demand for High-Surface-Area Battery Separators in EV Gigafactories
Electrospun nanofiber separators now withstand 150 °C thermal excursions without dimensional loss, addressing critical EV safety standards. Enhancements in ion conductivity are extending fast-charge capability by up to 40% while preserving cycle life, a gain attracting procurement from Asian and US gigafactories. Automated roll-to-roll lines scale output beyond 3 million m² annually, narrowing cost gaps with conventional polyolefin films. Capital deployment by major cell producers is locking in multiyear supply contracts, providing predictable volume visibility for nanofiber vendors. National clean-mobility incentives in China and the United States further amplify separator adoption in new cell chemistries.
Demand for High-Efficiency Filtration Materials
Multilayer nanofiber media capture 0.3 µm particulates at more than 99% efficiency while keeping the pressure drop to 48 Pa, exceeding WHO indoor-air guidelines. HVAC system retrofits in dense Asian cities adopt these filters to curb smog-related morbidity. In automotive fuel systems, nanofiber layers remove 4 µm contaminants at 99.9% efficiency, lengthening injector life and lowering maintenance costs. Water-treatment plants integrate nanofibrous membranes to remove pathogens at the nanoscale without chlorine dosing, slashing disinfection by-products. Pandemic-era consumer awareness of air quality pushes adoption of high-end respirators, solidifying retail demand.
Growth in the Automotive Industry
Nanofiber-reinforced composites reduce vehicle component weight by up to 30%, driving fleet fuel-economy gains and emission compliance. Cabin-air filters integrating nanofiber layers achieve PM2.5 removal above 99.5%, enhancing occupant health metrics and adding premium features in mid-range models. Acoustic nanofiber mats offer broadband noise dampening, allowing automakers to lighten structural dampers and improve passenger comfort. In-situ functional nanofibers provide electromagnetic shielding for electric drivetrains, preventing signal interference. Collectively, these features raise material uptake per vehicle, reinforcing long-term demand from OEMs and Tier-1 suppliers.
Restraints Impact Analysis of Nanofiber Market*
| Restraint | (~) % Impact on CAGR Forecast | Geographic Relevance | Impact Timeline |
|---|---|---|---|
| Volatile PAN Feedstock Prices | -3.60% | Global, highest exposure in emerging markets | Short term (≤ 2 years) |
| Difficulty in Shift of Carbon Nanofibers from Lab Scale to Plant Scale due to Small Size and Complexity | -4.20% | Global, acute in high-tech manufacturing hubs | Long term (≥ 4 years) |
| Health and Safety Concerns | -2.10% | North America, Europe | Medium term (2-4 years) |
| Source: Mordor Intelligence | |||
Volatile PAN Feedstock Prices
PAN constitutes about 90% of carbon nanofiber precursors, and its spot price fluctuates by up to 20% annually, eroding margin stability for downstream suppliers. Supply disruptions linked to acrylonitrile feed shortages intensify inventory risk, prompting producers to pursue petroleum-asphaltene or lignin alternatives that can cut raw-material cost below USD 9 per kg while raising sustainability credentials. Transition timeframes remain lengthy due to impurity management and variable mechanical performance, prolonging exposure to PAN volatility. Buyers hedge through index-linked contracts, but long-term pricing visibility is still limited, dampening aggressive capacity expansion.
Difficulty in Shifting Carbon Nanofibers from Lab to Plant Scale
Commercial lines must maintain fiber diameters within ±50 nm tolerance and crystallinity above 90% to meet electronic and battery specifications, yet lab-to-plant transfers often widen these ranges, degrading product performance. Capital-intensive spinneret arrays and stringent environmental controls lift project payback periods, curbing investor appetite. Regulatory scrutiny is tightening; Massachusetts proposes classifying carbon nanofibers as Higher Hazard Substances under TURA, adding compliance overhead[2]Massachusetts Government, “Draft Carbon Nanotube and Nanofiber Policy,” mass.gov . Modular production platforms under federal grants show promise, but broad rollout will hinge on demonstrated reliability and cost parity with established microfibers.
*Our forecasts treat driver/restraint impacts as directional, not additive. The impact forecasts reflect baseline growth, mix effects, and variable interactions.
Nanofiber Market Segment Analysis
By Product Type:
Carbohydrate-Based Nanofibers Lead Sustainability ShiftThe polymeric category anchors 41.20% of 2025 revenue, driven by well-established electrospinning lines and broad chemical versatility across packaging, filtration and biomedical devices. Carbohydrate-based grades, while smaller in volume, accelerate at a 26.2% CAGR as end-users pursue biodegradable, bio-sourced alternatives aligned with global circular-economy mandates. Cellulose nanofibers rival aramid tensile strength yet biodegrade under ambient conditions, compelling packaging suppliers to adopt them in single-use applications. Chitin nanofibers attract wound-care producers due to inherent antimicrobial traits, spurring investment in shellfish-waste valorization. Carbon nanofibers find significant use in specialty energy and electronics applications; however, production scale and cost challenges are restraining immediate growth.
Momentum for carbohydrate-based products is amplified by brand-owner commitments to cut fossil plastic use. Legislative bans on single-use synthetic fibers in several EU states compound this pull. Composite nanofibers, which blend polymer and ceramic phases, play a significant role in high-temperature filtration niches. Metal and metal-oxide grades serve catalytic and sensing applications where elevated conductivity or photocatalytic activity is critical. Ceramic nanofibers retain demand for thermal insulation in aerospace and furnace linings. As raw-material R&D migrates toward forestry and agricultural waste streams, cost curves are expected to converge, bolstering the broader nanofiber market.



By Application:
Energy Storage Disrupts Traditional DominanceWater and air filtration maintain a commanding 39.30% share in 2025 as urban air-quality mandates and safe-drinking-water regulations intensify. Nonetheless, battery components for EV and stationary storage are capturing disproportionate investor attention, with early-adopter cell manufacturers integrating nanofiber separators and electrodes to raise energy density and fast-charge capability. This sub-segment is projected to outpace others, expanding above 27.1% CAGR through 2031, and is set to elevate the nanofiber market size for energy storage from a mid-single-digit revenue slice today to a high-teen contribution by 2031.
Medical applications generate significant revenue, driven by electrospun scaffolds and premium-priced drug delivery patches. The automotive sector sees substantial contributions through composite weight reductions and enhanced interior filtration. Electronics play a key role with the integration of conductive nanofiber paths in flexible displays and micro-sensors. Advanced textile applications, though currently niche, are gaining traction with innovations in wearable health monitors and antimicrobial sportswear. Additionally, industrial and environmental sectors, including oil-water separation and food packaging, provide notable contributions. Performance advancements in one segment, such as moisture management in apparel, frequently inspire similar innovations in others, like thermal regulation in batteries.
By Manufacturing Technology:
Innovations Beyond Traditional ElectrospinningElectrospinning still owns 57.20% of 2025 production thanks to proven scalability for polymeric feedstocks and the availability of turnkey pilot lines. Continuous upgrades, including tri-axial needle arrays, raise throughput to 1 kg/h, though energy intensity and high-voltage requirements remain cost concerns. Forcespinning accelerates throughput to 50-100 g/h without high voltage, advancing at 22.1% CAGR as automotive and filtration users pilot industrial runs.
Needle-less electrospinning eliminates clogging issues and produces uniform webs ideal for HEPA-grade filtration. Solution blow spinning enables rapid fiber formation for thermally sensitive polymers and supports aqueous spins, reducing solvent emissions. Melt blowing remains a preferred choice for mask and HVAC filter manufacturers due to the simplicity of thermoplastic extrusion. Advancements in instrumentation, such as laser-controlled jet monitoring and AI-driven quality assurance, are bridging the gap between laboratory research and industrial production, ensuring consistent fiber morphology critical for regulated applications. Additionally, advanced textiles and sectors like oil-water separation and food packaging contribute to market growth, with innovations in one area often driving advancements in others.

Geography Analysis
APAC Nanofiber Market
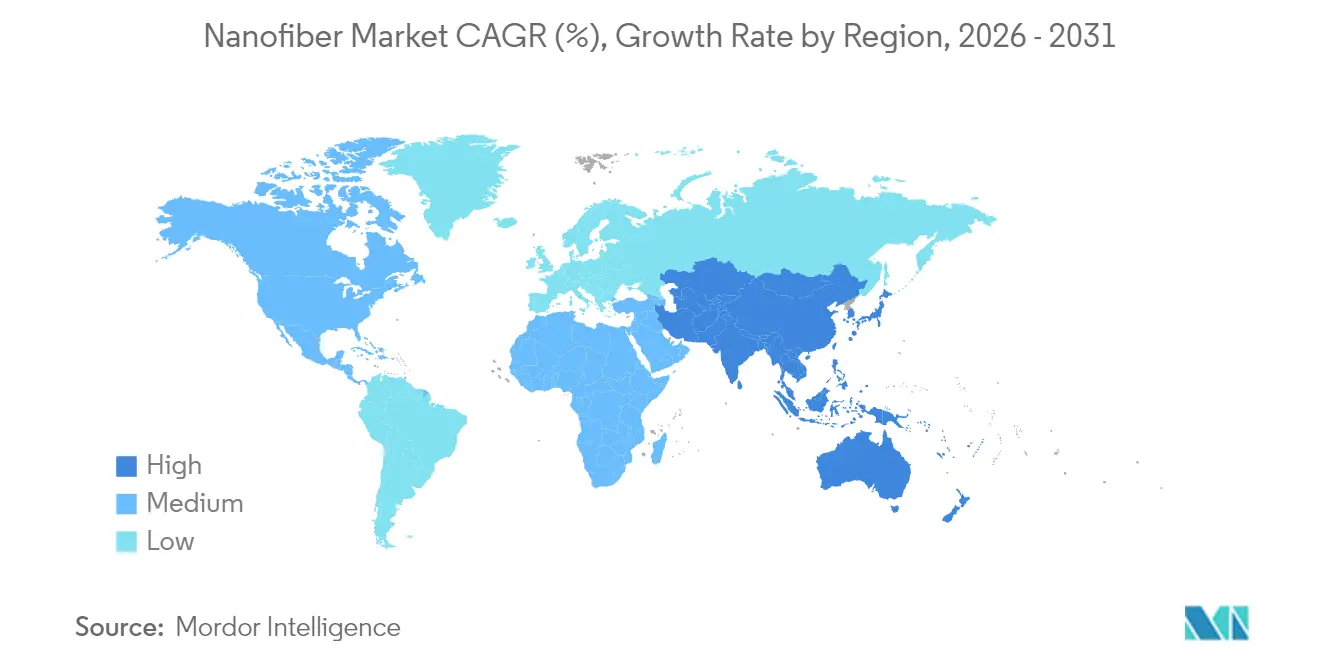
Asia-Pacific commands 37.60% of 2025 revenue, with China, Japan and South Korea benefitting from deep electronic supply chains and government-backed nanotech initiatives. Robust EV production bases in China elevate local demand for nanofiber separators, while strict environmental guidelines accelerate uptake in air-filtration retrofits. Regional stimulus funds earmarked for sustainable materials further de-risk investment in lignin-derived nanofiber plants. This ecosystem underpins a 21.4% regional CAGR, ensuring Asia-Pacific continues to anchor global volume growth.
The Americas and EMEA Nanofiber Market
North America, driven by the U.S. with its USD 2.2 billion FY-25 National Nanotechnology Initiative budget, which allocates grants to medical, defense, and energy sectors, plays a significant role in global revenue generation. High-value healthcare projects dominate demand; clinical trials for nanofiber-based regenerative implants secure FDA fast-track status, accelerating commercialization. Defense agencies sponsor filtration and protective-wear R&D, fortifying domestic supply chains. Canada’s clean-technology incentives and proximity to automotive hubs kindle cross-border collaboration in battery materials. Europe, driven by Germany and France's stringent sustainability frameworks, leads in the market for biodegradable nanofiber packaging and HVAC solutions. Horizon Europe grants foster university-industry clusters that fast-track scale-up and standardization, while REACH compliance guidelines supply regulatory certainty. Although growth rates trail Asia-Pacific, EU directives banning select single-use plastics are opening replacement opportunities in food-service and personal-care products. In South America, the Middle East, and Africa, where programs addressing potable-water scarcity and enhancing agricultural efficiency are gaining traction, revenue is driven by the early adoption of nanofiber membranes in desalination and controlled-release fertilizers.

Value Chain Analysis
The nanofiber value chain starts with upstream feedstocks and additives, with polymeric grades relying on polymers and solvents, and carbon nanofibers relying on PAN, where price volatility can flow into converter costs. Production then shifts to nanofiber web formation using platforms such as needle-based electrospinning and, increasingly, needle-less systems. Equipment suppliers influence throughput, uniformity, and operating costs, with Elmarco and its Nanospider technology as an example. The key bottlenecks are scaling from pilot to steady industrial runs while holding tight specifications for diameter distribution, contamination control, and batch-to-batch consistency, particularly for medical and battery-grade materials.
Downstream, nanofiber producers sell rolls, membranes, and nonwovens to converters and integrators that laminate, coat, functionalize, or composite the webs into application-ready media. End markets include water and air filtration, medical products, energy storage components, automotive filtration and lightweighting composites, electronics, and advanced textiles. Industry organizations and consortia, including the Nanotechnology Industries Association (NIA), Nanocellulose Japan (NCJ), and Manufacturing USA institutes such as AFFOA, support commercialization by convening qualification workflows and pre-competitive collaboration that reduces friction between lab-scale innovation and volume adoption.
Competitive Landscape
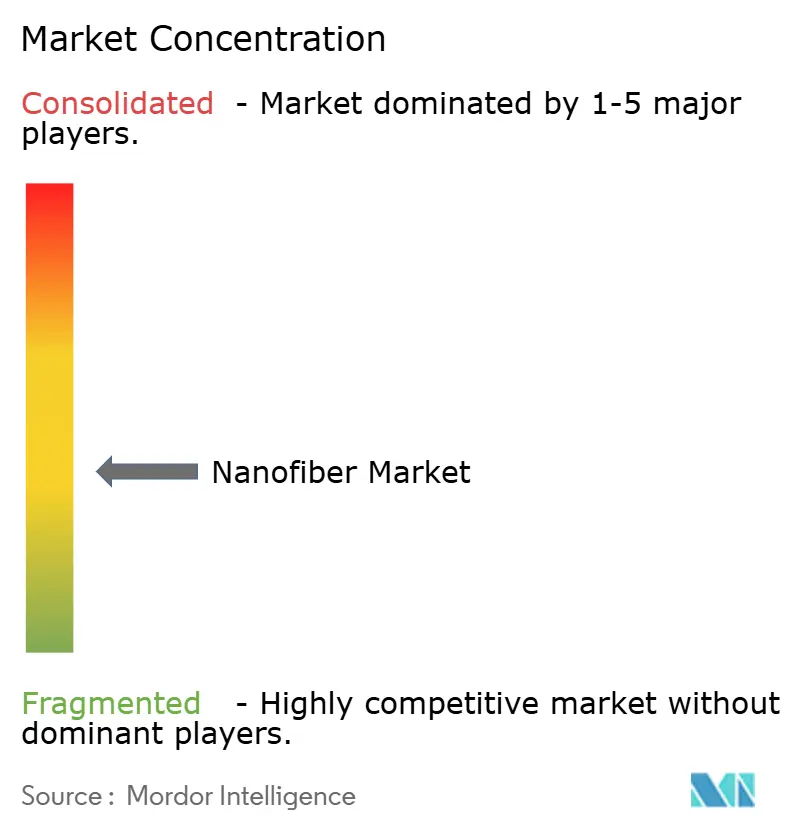
The nanofiber market features a moderately fragmented profile. Toray Industries fortifies its portfolio via steady capacity upgrades at its Japanese and Thai sites, focusing on high-temperature filtration grades. DuPont leverages extensive polymer chemistry know-how to introduce medical-grade electrospun scaffolds with validated biocompatibility. Teijin integrates nanofibers into carbon-fiber composites, capturing synergies in aerospace and sporting goods.
Specialist firms mount technology-led offensives. NanoLayr refines sonic-spinning techniques for sub-200 nm fibers that deliver enhanced barrier films to wound-care OEMs. Hollingsworth & Vose scales patented multiscale filtration media that balance pressure drop and efficiency, winning contracts for premium home-appliance filters. Start-ups in Europe champion lignin-based lines, aiming to disrupt the PAN cost base while advancing ESG credentials.
Strategic collaborations accelerate innovation. Asahi Kasei’s 2024 agreement with Aquafil merges cellulose nanofibers with ECONYL regenerated nylon for additive-manufactured components, highlighting cross-industry convergence. Chuetsu Pulp’s partnership with Marubeni introduces agricultural pest-control films made from cellulose nanofibers, validating new revenue channels. Intellectual-property activity intensifies: patents for non-woven nanofiber membranes in lateral-flow diagnostics forecast encroachment into point-of-care devices. Overall, differentiation hinges on production economics, functional performance and sustainability credentials.
Nanofiber Industry Leaders
Toray Industries Inc.
Donaldson Company Inc.
DuPont
Teijin Limited
Hollingsworth & Vose
- *Disclaimer: Major Players sorted in no particular order
Nanofiber Market Companies Covered in this Report
- Applied Sciences Inc.
- Argonide Corporation
- Asahi Kasei Corporation
- Chuetsu Pulp & Paper Co. Ltd.
- Donaldson Company Inc.
- DuPont
- Esfil Tehno AS
- eSpin Technologies Inc.
- FibeRio Technology Corp.
- Hollingsworth & Vose
- IREMA-Filter GmbH
- Japan Vilene Company Ltd.
- NanoLayr Ltd
- Nanoval GmbH & Co. KG
- NIPPON PAPER INDUSTRIES CO., LTD.
- Pardam SRO
- Rengo Co., Ltd.
- Sappi Ltd.
- SNC Fiber
- Spur AS
- Teijin Limited
- Toray Industries Inc.
- US Global Nanospace Inc.

Market Opportunities and Future Outlook
Air and water filtration is the most direct scale opportunity because qualification increasingly ties to codified performance definitions and repeatable manufacturing controls. China implemented GB/T 44793-2024 in May 2025, specifying technical requirements for nanofiber media for air filtration, including an average fiber diameter threshold of 300 nm or less, which gives suppliers a clearer pathway to sell standardized media into OEM and retrofit channels rather than one-off bespoke formats. In parallel, product upgrades that lower energy and pressure losses in water treatment strengthen the value proposition for municipal buyers, supporting adoption of nanofiber-enabled membranes and elements where total operating cost is a procurement criterion.
Clinical-grade and regulated-use manufacturing capacity also represents a more visible whitespace, since many nanofiber applications require controlled production environments and documented biocompatibility. Matregenix expanded into a new 10,000 square foot manufacturing facility in Mission Viejo, California (May 2024), positioned for clinical-grade manufacturing and industrial-scale production, which points to continued investment in compliant scale-up rather than laboratory output. On the risk side, evolving scrutiny of carbon nanotubes and nanofibers, reflected in Massachusetts releasing a draft policy analysis in January 2026, reinforces the need for robust EHS practices and defensible material characterization. That dynamic creates an opening for suppliers to package performance data, exposure controls, and traceability as part of the product offer.
Recent Industry Developments in Nanofiber Market
- April 2026: DuPont completed the sale of its aramids business, including the Kevlar and Nomex brands, to Arclin, Inc. for USD 1.8 billion. The transaction sharpens DuPont's portfolio focus and capital allocation, which affects how it prioritizes advanced materials and separation technologies that overlap with nanofiber-adjacent filtration and membrane value chains.
- March 2026: Toray Industries Inc. announced development of an ultra-thin wetlaid nonwoven fabric using PET nanofibers, cited at 3 micrometers thickness, as a substrate aimed at solid-state battery applications. The development targets higher-performance battery component architectures and signals continued R&D investment into nanofiber structures for next-generation energy storage.
- October 2024: Asahi Kasei and Aquafil collaborated to combine cellulose nanofibers with regenerated ECONYL polymer for 3D printing applications. The partnership links bio-based nanofiber reinforcement with circular polymer feedstocks, expanding pathways for nanofiber usage in additive manufacturing and engineered parts.


Nanofiber Market Report Scope and Research Methodology
Market Definition and Coverage
The market is defined as revenue generated from nanofiber materials sold for commercial and industrial use, where the fiber diameter is typically below 1,000 nm and the product is supplied as media, mats, membranes, or related formats.
Scope exclusions: We exclude downstream finished goods where nanofibers are only a minor internal component and the product is primarily priced as the final device or end product.
Segments Covered in This Report
- By Product Type
- Polymeric Nanofiber
- Carbon Nanofiber
- Composite Nanofiber
- Metal and Metal Oxide Nanofiber
- Ceramic Nanofiber
- Carbohydrate-based Nanofiber
- By Application
- Water and Air Filtration
- Medical
- Energy Storage
- Automotive and Transportation
- Electronics
- Textiles
- Other Applications
- By Manufacturing Technology
- Electrospinning (Needle-Based)
- Needle-less Electrospinning
- Solution Blow Spinning
- ForceSpinning/Rotary Jet Spinning
- Melt Blowing
- By Geography
- Asia-Pacific
- China
- India
- Japan
- South Korea
- Rest of Asia-Pacific
- North America
- United States
- Canada
- Mexico
- Europe
- Germany
- United Kingdom
- France
- Italy
- Rest of Europe
- South America
- Brazil
- Argentina
- Rest of South America
- Middle East and Africa
- Saudi Arabia
- South Africa
- Rest of Middle East and Africa
- Asia-Pacific
Data Sources, Market Sizing, and Validation
Desk Research
Desk research was used to set the base structure for the model and to keep assumptions grounded in production and demand patterns. We referenced public sources such as the USGS for materials context, the US International Trade Commission and UN Comtrade for trade cues in relevant polymer and fiber categories, and sources such as the US Patent and Trademark Office and the European Patent Office to understand technology direction and adoption.
We also reviewed peer reviewed journals for application level signals, plus standards and technical publications from bodies such as ISO and ASTM where they helped clarify definitions used by buyers and suppliers. In parallel, we reviewed company filings, investor presentations, association websites, and reputable press to confirm plant expansions, product launches, and end use demand indicators. Where needed, paid subscriptions already available internally were used for company financials and news screening, patent analytics, and selective shipment level import or export checks, and this desk source list is illustrative rather than exhaustive.
Primary Interviews and Surveys
Primary work focused on interviews and surveys with material suppliers, nanofiber technology providers, converters, and end users who purchase filtration, medical, energy, and textile solutions. Respondent input helped confirm what is counted as nanofiber revenue, how selling prices typically move, utilization patterns, and the share of sales routed through direct contracts versus channel partners across APAC, EMEA, and the Americas.
Distribution of primary research fieldwork respondents
| Company type | Respondent position | Region |
|---|---|---|
| Top tier: 35% | CXOs: 14% | APAC: 51% |
| Mid tier: 45% | Functional/Unit leaders: 35% | EMEA: 29% |
| Smaller Players: 20% | Managers: 51% | Americas: 20% |
Market-Sizing & Forecasting
Sizing started with a top-down build where application demand pools were reconstructed using adoption rates for nanofiber media across filtration, medical and biomedical use, energy storage components, textiles, and electronics, then linked back to selling price ranges validated in interviews. Once that logic was set, we used selective bottom-up approximations as a check, mainly by rolling up revenues for a sampled set of suppliers and converters and then scaling for coverage gaps by region and product type.
Key inputs (illustrative) included electrospinning capacity additions and utilization, average selling prices by polymeric versus carbon and ceramic families, share of nanofiber layer content in composite media, regulatory pull for air and water filtration upgrades, and end market indicators such as industrial production and healthcare consumption trends. For forecasting, we ran scenario analysis so the model could reflect different adoption speeds by application, followed by a smoothing step on pricing and capacity ramps to avoid unrealistic jumps. Where bottom-up revenue visibility was limited for smaller suppliers, gaps were handled using validated ranges for capacity and yield, followed by conservative scaling based on known end use demand rather than optimistic nameplate capacity.
Data Validation & Update Cycle
Outputs were validated through multiple checks, including consistency across application demand totals, implied pricing versus interview ranges, and region splits versus known manufacturing concentration and trade signals. When results looked unusual, we rechecked assumptions, revisited the source trail, and recontacted selected respondents to confirm whether a difference was real or caused by a definitional mismatch.
Before sign-off, the model is reviewed in steps so changes in one driver, such as filtration adoption or price progression, do not create hidden distortions elsewhere. Reports are refreshed annually, and interim updates are done when material events occur, such as a major capacity announcement or a sudden change in end market demand. Right before delivery, a final pass is completed so the latest public updates and expert feedback are reflected in the published numbers.
Mordor Intelligence's Nanofiber Market Size Compared Against Other Published Estimates
Published nanofiber market values can vary a lot, even when the topic name looks the same, because the counted revenue pool is not always consistent and the assumed pricing trend can differ. Differences also come from the selected base year, the regions emphasized, and how fast adoption is assumed in filtration and medical use cases.
In practice, the biggest gaps usually come from whether the estimate includes finished filtration products and medical devices, or whether it counts only nanofiber material and intermediate media sales, followed by how electrospinning capacity ramps are translated into sellable output. The spread below is largely explained by keeping scope on nanofiber material and media revenues, and validating price movement and utilization with fresh primary checks, a treatment applied by Mordor Intelligence.
Benchmark comparison
| Source | Market Size | Gaps in Research Methodology |
|---|---|---|
| Mordor Intelligence | USD 1.58 B (2025) | |
| Industry Publisher A | USD 1.08 B (2025) | This estimate appears to apply a narrower realized-sales lens with slower adoption assumptions across high growth applications, which can undercount early commercialization revenue in filtration and energy use cases. |
| Industry Publisher B | USD 2.80 B (2025) | This estimate likely folds in a wider downstream value chain, where finished products that contain nanofiber layers are counted at the end-product price, which inflates totals versus material and intermediate media revenue. |
Looking across the three numbers, the main driver is what gets counted as market revenue, then how quickly adoption and pricing are allowed to move year to year. By keeping the model tied to clear demand pools by application and cross-checking with supplier coverage and realistic capacity utilization, the resulting value stays traceable and can be replicated when new public and interview inputs become available.


Key Questions Answered in the Report
What is the current value of the global nanofiber market?
The nanofiber market is valued at USD 1.9 billion in 2026 and is projected to reach USD 4.74 billion by 2031.
Which region leads the nanofiber market, and how fast is it growing?
Asia-Pacific holds 37.60% of 2025 revenue and is projected to grow at 21.4% CAGR through 2031, maintaining leadership.
What drives nanofiber demand in electric vehicle batteries?
Nanofiber separators deliver superior thermal stability and faster ion transport, enabling 40% quicker charging without sacrificing safety, which is critical for EV gigafactories.
Why are carbohydrate-based nanofibers gaining popularity?
They offer biodegradability and strong mechanical performance, aligning with circular-economy goals and propelling a 26.2% CAGR in this segment.
What are the main hurdles to scaling carbon nanofiber production?
High capital requirements, strict quality tolerances and emerging regulatory scrutiny complicate the transition from lab to industrial scale, slowing commercial rollout.
Page last updated on:


 Your data is secure and never sold or shared.


