Namibia Telecom MNO Market Size and Share
Market Overview
| Study Period | 2019 - 2030 |
|---|---|
| Forecast Data Period | 2025 - 2030 |
| Historical Data Period | 2019 - 2023 |
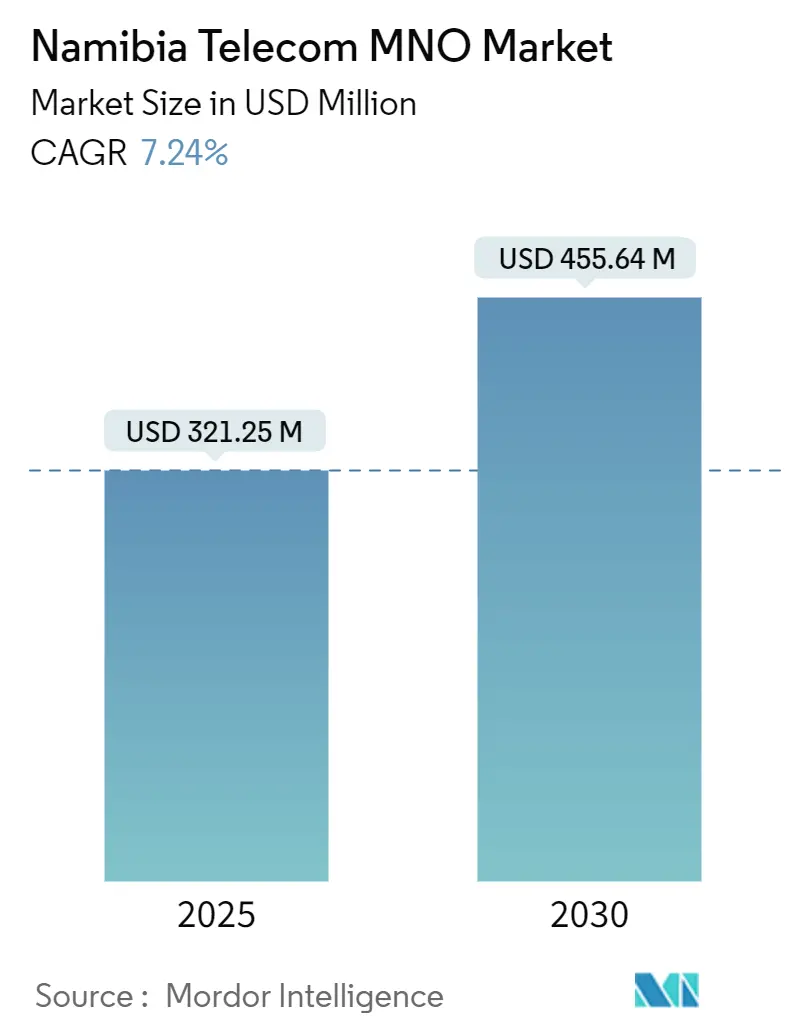
| Market Size (2025) | USD 321.25 Million |
| Market Size (2030) | USD 455.64 Million |
| Growth Rate (2025 - 2030) | 7.24% CAGR |
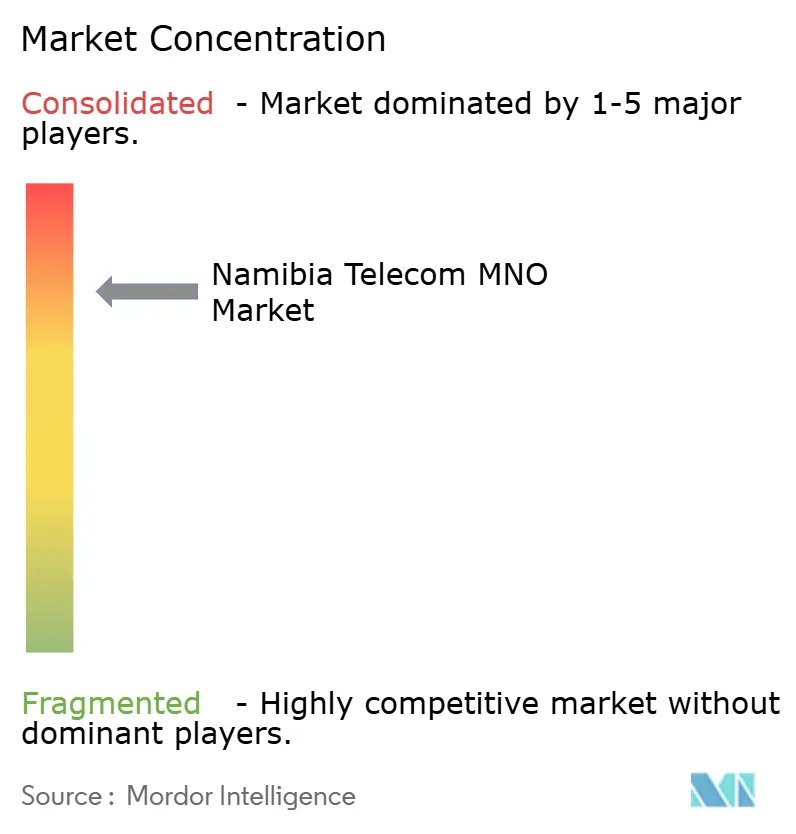
| Market Concentration | High |
Major Players *Disclaimer: Major Players sorted in no particular order Image © Mordor Intelligence. Reuse requires attribution under CC BY 4.0. | |
Namibia Telecom MNO Market Analysis by Mordor Intelligence
The Namibia Telecom MNO Market size is estimated at USD 321.25 million in 2025, and is expected to reach USD 455.64 million by 2030, at a CAGR of 7.24% during the forecast period (2025-2030). In terms of subscriber volume, the market is expected to grow from 2.60 million subscribers in 2025 to 3.60 million subscribers by 2030, at a CAGR of 6.46% during the forecast period (2025-2030).
Mobile data has overtaken voice as the chief growth vector, with mobile data revenue already delivering 70% of total mobile service income. A surge of subsea and terrestrial fiber projects—most visibly the Equiano cable and the West-East Corridor backbone-has multiplied international capacity and positioned operators to monetize higher-bandwidth applications. State-owned incumbents st-ll command most network assets, yet private players such as Paratus are injecting fresh capital, raising competitive intensity and accelerating rural coverage. Meanwhile, the regulatory environment is shifting toward innovation, as 5G licenses awarded in late 2023 end a years-long freeze and open the door to next-generation services.
Key Report Takeaways
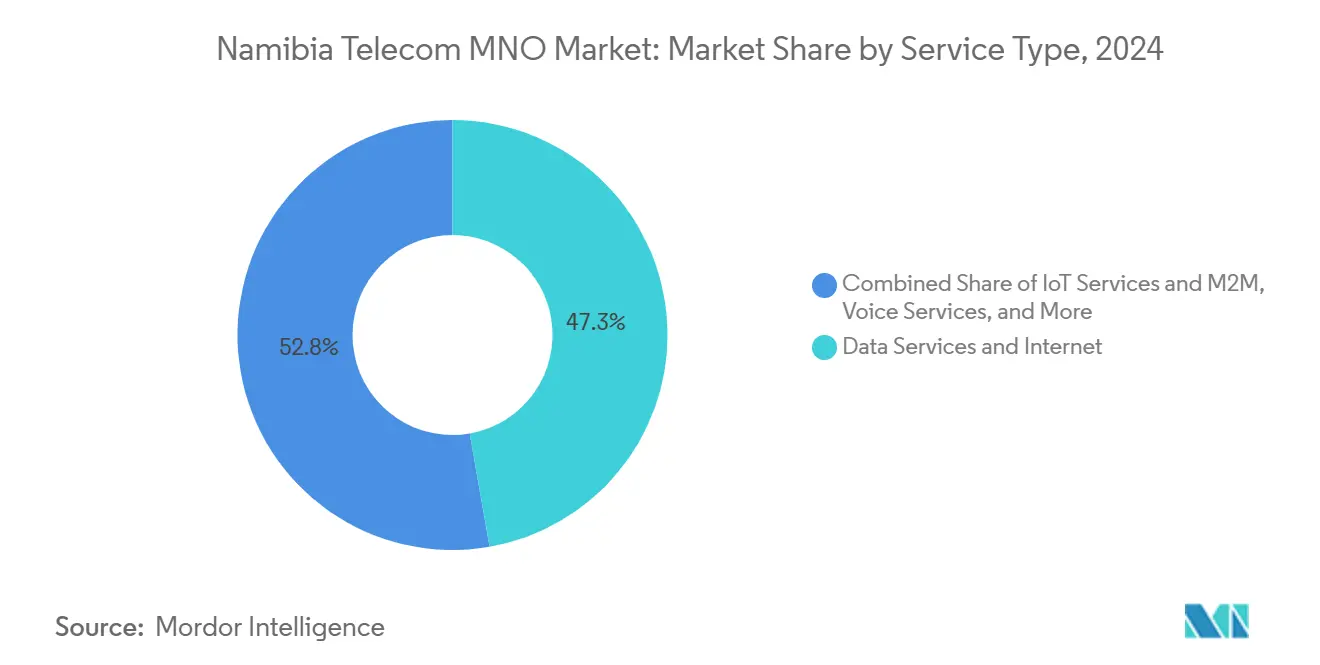
- By service type, data services held 47.25% of Namibia telecom MNO market share in 2024; IoT services are projected to post the fastest 1.18% CAGR through 2030.
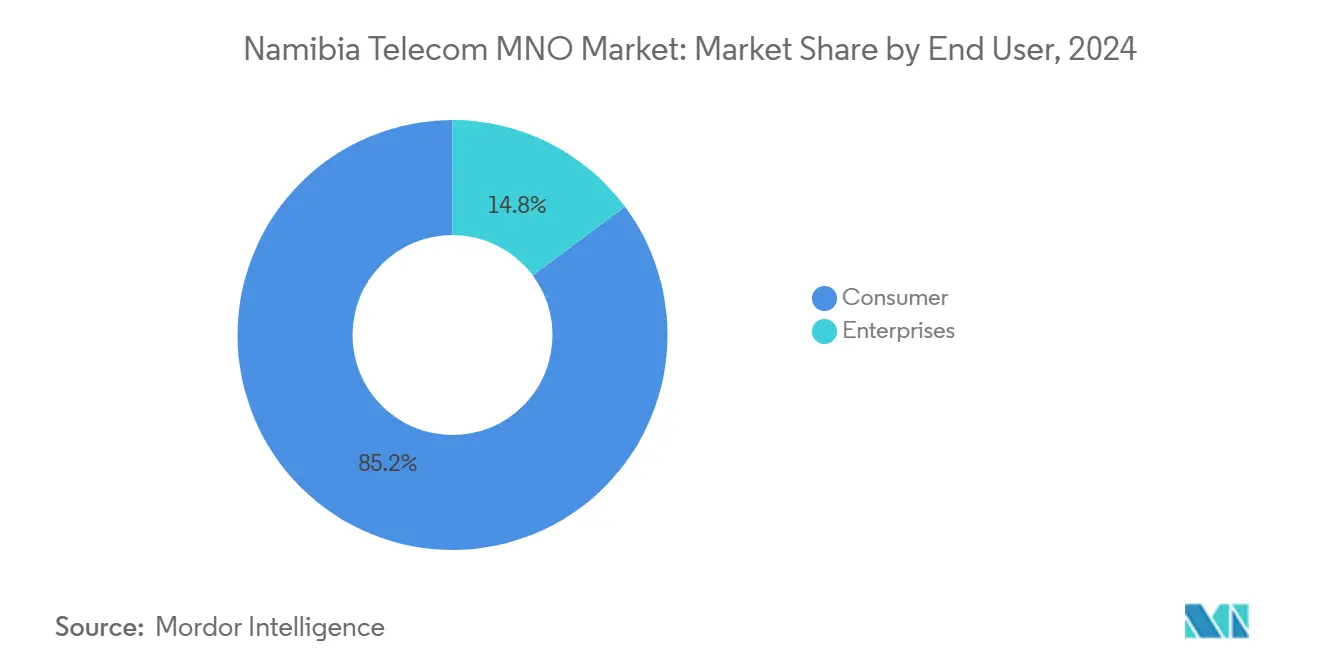
- By end user, the consumer segment accounted for 74.18% of 2024 revenue, while enterprise services recorded a 7.94% CAGR to 2030.
Namibia Telecom MNO Market Trends and Insights
Drivers Impact Analysis*
| Driver | (~) % Impact on CAGR Forecast | Geographic Relevance | Impact Timeline |
|---|---|---|---|
| Expanding 4G/5G Coverage in Rural Regions | +0.3% | National, with concentration in Khomas, Erongo, and Hardap regions | Medium term (2-4 years) |
| Rapid Growth of FinTech and Mobile Money Ecosystem | +0.2% | National, with urban centers leading adoption | Short term (≤ 2 years) |
| Government Fiber-Backbone PPP Projects (West-East Corridor) | +0.1% | National infrastructure backbone connecting major towns | Long term (≥ 4 years) |
| Demand Shift from Voice to High-ARPU Data Bundles | +0.2% | National, with higher impact in urban areas | Short term (≤ 2 years) |
| Namibia-Angola Subsea Cable Landing (2025) | +0.1% | National, with primary benefits for international connectivity | Medium term (2-4 years) |
| Emerging Cross-border IoT Use-cases in Mining and Logistics | +0.1% | Northern regions and mining corridors | Long term (≥ 4 years) |
| Source: Mordor Intelligence | |||
Expanding 4G/5G Coverage in Rural Regions
4G population coverage climbed from 24.7% in 2019 to 76.6% in 2023 as operators responded to universal-service obligations embedded in CRAN’s spectrum licenses. Mandated build-out milestones compel carriers to extend LTE-Advanced sites to the seven regions that still fall below 80% outdoor coverage. MTC’s 4.5G field trials with Huawei demonstrated peak speeds of 1 Gbps, proving the network’s readiness to deliver enhanced mobile broadband even in low-density settlements.[1]Huawei, “MTC and Huawei Complete 4.5G Trial in Namibia,” huawei.com Accelerated rural roll-outs promise new prepaid data uptake, helping offset plateauing usage in saturated urban clusters.
Rapid Growth of FinTech and Mobile Money Ecosystem
More than half of all value-added-service transactions now flow through MobiPay’s digital wallet platform, signaling deep consumer appetite for cash-light payments. MTC secured an e-money license in 2025, enabling airtime resellers and agents to morph into financial-service outlets that drive incremental data traffic. First National Bank’s ChatPay adds banking firepower, intensifying competition yet growing the addressable pool of transactions that traverse mobile networks. For operators, each wallet top-up or funds transfer lifts data consumption and anchors brand loyalty in segments historically prone to SIM churn.
Government Fiber-Backbone PPP Projects (West-East Corridor)
Telecom Namibia invested NAD 35.5 million to lay 233,858 meters of fiber in 2024, connecting 7,838 erven across eight towns.[2]Telecom Namibia, “FTTx Expansion Highlights,” telecom.na The public-private West-East Corridor will add redundant links between coastal landings and inland trade hubs, lowering latency for enterprise VPNs and safeguarding against single-route outages. Fiber-to-Home already accounts for 27% of fixed broadband subscribers, validating household willingness to pay for gigabit-level access that supports streaming, education and remote work. The corridor further unlocks backhaul for mobile base-stations, improving spectral efficiency and bolstering the Namibia telecom MNO market’s data economics.
Demand Shift from Voice to High-ARPU Data Bundles
Mobile data revenue jumped 53% year-on-year in 2024 and now delivers 70% of mobile service turnover. Reflecting the pivot, Telecom Namibia’s Jiva Family plans position voice as a bundled add-on with data quotas ranging from 1 GB to 10 GB. Namibia ranks eighth in Africa for 1 GB affordability, catalyzing OTT adoption for messaging, streaming and gaming. While outgoing call minutes continue to contract, operators sustain average revenue per user by upselling larger data buckets and enabling seamless content partnerships.
Restraints Impact Analysis*
| Restraint | (~) % Impact on CAGR Forecast | Geographic Relevance | Impact Timeline |
|---|---|---|---|
| Delayed 5G Spectrum Auctions and High Reserve Prices | -0.2% | National, affecting all major operators | Short term (≤ 2 years) |
| Currency Depreciation Pressuring Cap-Ex Budgets | -0.1% | National, with higher impact on import-dependent operators | Medium term (2-4 years) |
| Low Fixed-Broadband Affordability Outside Windhoek | -0.1% | Rural and secondary urban centers | Long term (≥ 4 years) |
| Rising Cyber-security and Fraud Incidents | -0.1% | National, with higher impact on enterprise segment | Short term (≤ 2 years) |
| Source: Mordor Intelligence | |||
Delayed 5G Spectrum Auctions and High Reserve Prices
CRAN’s moratorium on 5G spectrum lifted only in October 2023, years after regional peers had launched commercial services. Licenses carry steep reserve prices and require nationwide roll-outs within defined milestones, straining operator cash flow just as they digest earlier LTE and fiber cap-ex commitments.[3]Communications Regulatory Authority of Namibia, “Spectrum Auction Guidelines 2023,” cran.na Compressed timetables force carriers to double-track network modernization, squeezing margins in an already low-growth environment.
Currency Depreciation Pressuring Cap-Ex Budgets
The Namibian dollar’s slide against the USD inflates import costs for radio access gear, fiber optics and cloud licenses denominated in foreign currency. Smaller players have limited hedging capacity, often deferring upgrades or extending equipment lifecycles at the expense of network quality. Vendors demand hard-currency payments, exposing operators to exchange-rate swings that can add double-digit percentage premiums to planned projects, curbing Namibia telecom MNO market expansion potential.
*Our forecasts treat driver/restraint impacts as directional, not additive. The impact forecasts reflect baseline growth, mix effects, and variable interactions.
Segment Analysis
By Service Type: Data and Internet Services Drive Revenue Transformation
Data and internet services generated 47.25% of 2024 industry revenue and remain the pivot of Namibia telecom MNO market growth dynamics. The Namibia telecom MNO market size for data is projected to climb at 7.35% CAGR to 2030, fueled by mobile video, cloud applications and surging IoT deployments in logistics corridors. Voice still outpaces data in absolute dollars, yet its share is falling as consumers gravitate toward OTT communication. Operators counterbalance voice erosion by packaging data-first bundles and layering fintech, content and cloud services that widen average revenue per user.
Emerging IoT use-cases-from RFID-equipped cattle tracking to predictive maintenance in mining-are expected to grow at 7.27% CAGR, contributing meaningful high-margin enterprise revenue. OTT and pay-TV partnerships supply incremental streams, while wholesale and cloud connectivity widen the service-mix canvas. Sustained fiber roll-outs and international capacity additions ensure that quality-of-service scales with demand, protecting the long-run competitiveness of the Namibia telecom MNO market.


By End User: Consumer Segment Dominates While Enterprise Accelerates
Consumers contributed 85.19% of revenue in 2024, a logical outcome of Namibia’s prepaid-centric market structure. The Namibia telecom MNO market size for consumer services will track a steady trajectory as smartphone affordability improves and richer content formats spur data-bundle upgrades. At the same time, enterprise revenue is forecast to climb at 7.94% CAGR, outpacing the headline market as mining, logistics and public-sector users digitalize workflows.
IoT pilots in open-pit mines use low-power wide-area networks to monitor equipment health and worker safety, replacing manual inspections with real-time dashboards. Government e-service portals and school connectivity initiatives push multi-gigabit backhaul orders toward operators with turnkey fiber and cloud expertise. Enterprise contracts carry multi-year tenors and service-level penalties, boosting long-term visibility and diversifying cash flows within the Namibia telecom industry.
Geography Analysis
Namibia’s network asset base is concentrated in Windhoek, Walvis Bay and Swakopmund, yet the most significant uncaptured potential lies in the seven regions where 4G coverage is still below 80%. The Namibia telecom MNO market size for underserved rural districts is forecast to expand at faster than national average rates once Universal Service Fund subsidies and tower-sharing deals narrow coverage gaps. Khomas region remains the revenue engine, propelled by dense urban usage and a high proportion of post-paid contracts.
Erongo and Hardap benefit from industrial activity around ports and agricultural estates, generating traffic spikes that justify early 5G small-cell deployments. Northern regions bordering Angola represent the next frontier for cross-border IoT logistics corridors, as trucking fleets adopt e-freight platforms that require seamless roaming and low latency. Here, Paratus is leveraging its new Angola-Namibia terrestrial fiber route to capture enterprise VPN demand.
Coastal landings at Swakopmund tie Namibia into global traffic corridors through Equiano, positioning the country as a regional transit hub. Operators are marketing backhaul to neighboring Botswana and Zambia, converting geographic proximity into new wholesale revenues. Continued policy support for license-exempt satellite earth stations may introduce disruptive capacity in remoter districts, yet fiber remains the dominant medium for backhaul resiliency, reinforcing the strategic weight of the West-East Corridor.
Competitive Landscape
A duopolistic structure prevails: MTC and Telecom Namibia together control 80% of 2024 industry turnover. Their asset dominance stems from nationwide radio licenses, extensive fiber rings and legacy copper loops. Paratus, the most assertive challenger, secured N$600 million in fresh capital to scale its metro fiber, Express Route international service and enterprise data-center footprint.
Competitive dynamics increasingly pivot on quality rather than coverage as operators race to upgrade packet cores for VoLTE, 5G Non-Standalone and network slicing. MTC’s proof-of-concept 4.5G partnership with Huawei achieved 1 Gbps throughput-an early differentiator in peak capacity. Telecom Namibia, meanwhile, is mid-way through a NAD 327 million OSS/BSS overhaul to automate service assurance and shorten order-to-cash cycles.
Cyber-resilience has emerged as a brand separator after Telecom Namibia suffered an intrusion compromising 400,000 files in December 2024, prompting regulatory scrutiny and government support interventions. Paratus and newcomer Loc8 Mobile are positioning secure-by-design architectures to lure enterprises wary of data breaches. CRAN’s cease-and-desist order against unlicensed Starlink operations demonstrates the regulator’s willingness to protect compliant operators, yet also foreshadows satellite competition once formal frameworks crystallize. The Namibia telecom MNO market therefore faces a twin-track contest: incumbents defending share through scale and challengers carving niches in security, cross-border fiber and latency-sensitive enterprise services.
Namibia Telecom MNO Industry Leaders
Mobile Telecommunications Ltd (MTC)
Telecom Namibia
Paratus Telecom Namibia
- *Disclaimer: Major Players sorted in no particular order

Recent Industry Developments
- February 2025: MTC achieved NAD 2 billion (USD 110 million) in prepaid revenue as total company turnover rose to NAD 3.2 billion.
- December 2024: Telecom Namibia suffered a cyber-attack affecting 400,000 files; government provided technical support to restore services.
- November 2024: Telecom Namibia completed eight FTTx projects covering 233,858 meters of fibre.
- May 2024: Paratus raised NAD 600 million to fund network expansion.


Namibia Telecom MNO Market Report Scope
| Voice Services |
| Data and Internet Services |
| Messaging Services |
| IoT and M2M Services |
| OTT and PayTV Services |
| Other Services (VAS, Roaming and International Services, Enterprise and Wholesale Services, etc.) |
| Enterprises |
| Consumer |
| Service Type | Voice Services |
| Data and Internet Services | |
| Messaging Services | |
| IoT and M2M Services | |
| OTT and PayTV Services | |
| Other Services (VAS, Roaming and International Services, Enterprise and Wholesale Services, etc.) | |
| End-user | Enterprises |
| Consumer |


Key Questions Answered in the Report
What is the current value of the Namibia telecom MNO market?
The industry is worth USD 321.5 million in 2025 and is forecast to reach USD 455.64 million by 2030, growing at a 7.24% CAGR.
Which service type is growing fastest in Namibia telecom?
OTT and PayTV services post the quickest 7.42% CAGR
How dominant are the top operators?
MTC and Telecom Namibia together hold roughly 80% of sector revenue, indicating a highly concentrated market.
When will 5G be widely available?
Commercial rollouts started in late 2023 following license awards; most urban centers are expected to receive coverage by 2026.
How is fiber deployment progressing outside Windhoek?
Eight FTTx projects completed in 2024 connected nearly 7,838 erven, and the West-East Corridor backbone will extend reach to mining and trade hubs over the next four years.
What risks could dampen market growth?
Currency depreciation raises equipment costs, while cybersecurity threats—such as the 2024 Telecom Namibia breach—pose operational and reputational hazards.
Page last updated on:


