Kairomones Market Size and Share
Market Overview
| Study Period | 2021 - 2031 |
|---|---|
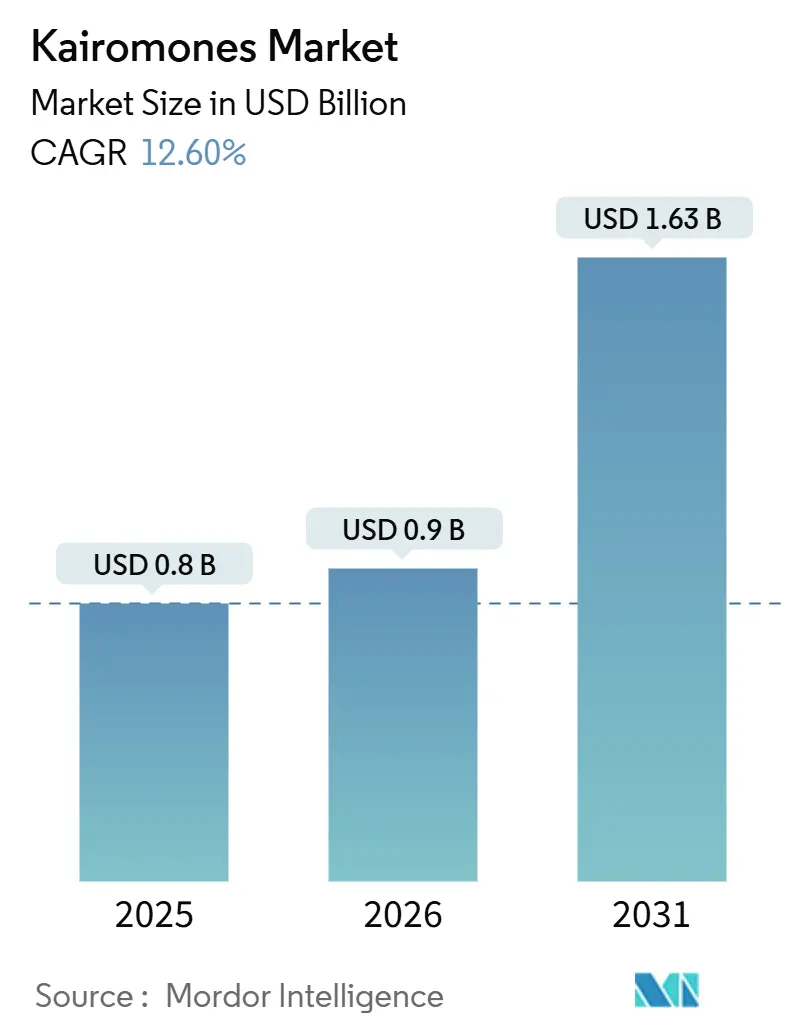
| Market Size (2026) | USD 0.9 Billion |
| Market Size (2031) | USD 1.63 Billion |
| Growth Rate (2026 - 2031) | 12.60% CAGR |
| Fastest Growing Market | Asia Pacific |
| Largest Market | Europe |
| Market Concentration | Medium |
Major Players *Disclaimer: Major Players sorted in no particular order Image © Mordor Intelligence. Reuse requires attribution under CC BY 4.0. | |
Kairomones Market Analysis by Mordor Intelligence
The kairomones market size is projected to grow from USD 0.80 billion in 2025 to USD 0.90 billion in 2026, reaching USD 1.63 billion by 2031, with a CAGR of 12.6% during the 2026-2031 period. This growth is driven by a shift among growers from calendar-based spraying with broad-spectrum insecticides to practices such as mass trapping and mating disruption, which comply with residue-limit regulations. Declining bio-fermentation costs, expedited regulatory approvals for low-risk active ingredients, and the integration of volatile lures with precision agriculture sensors are expanding the market's accessibility, particularly for high-value crops. Europe leads in early adoption due to the Sustainable Use Regulation mandating integrated pest management plans, while countries like China, India, and Brazil contribute to volume growth through subsidy programs and streamlined registration processes. Additionally, advancements such as digital-twin plume models and nano-encapsulation are enhancing the field life of kairomones, enabling suppliers to offer premium products capable of withstanding tropical heat and humidity.
Key Report Takeaways
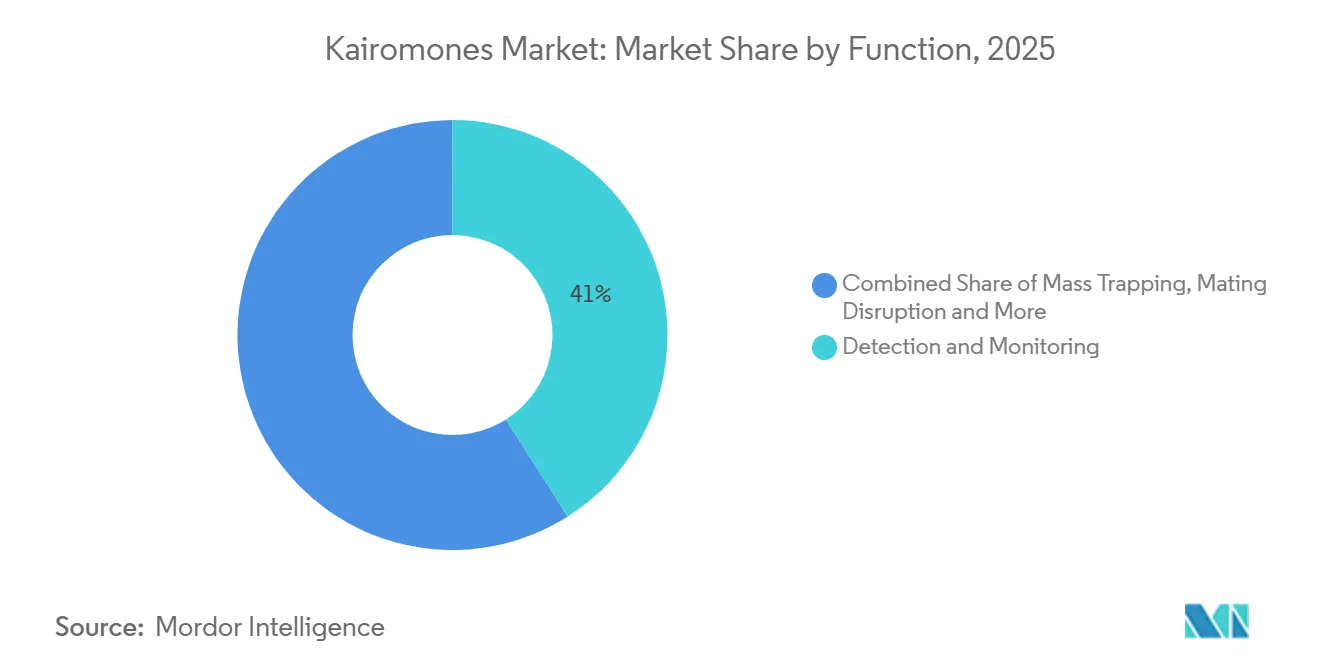
- By function, detection and monitoring held the largest 41% kairomones market share in 2025. whereas the market size for mating disruption is set to grow at the fastest 18% CAGR from 2026 to 2031.
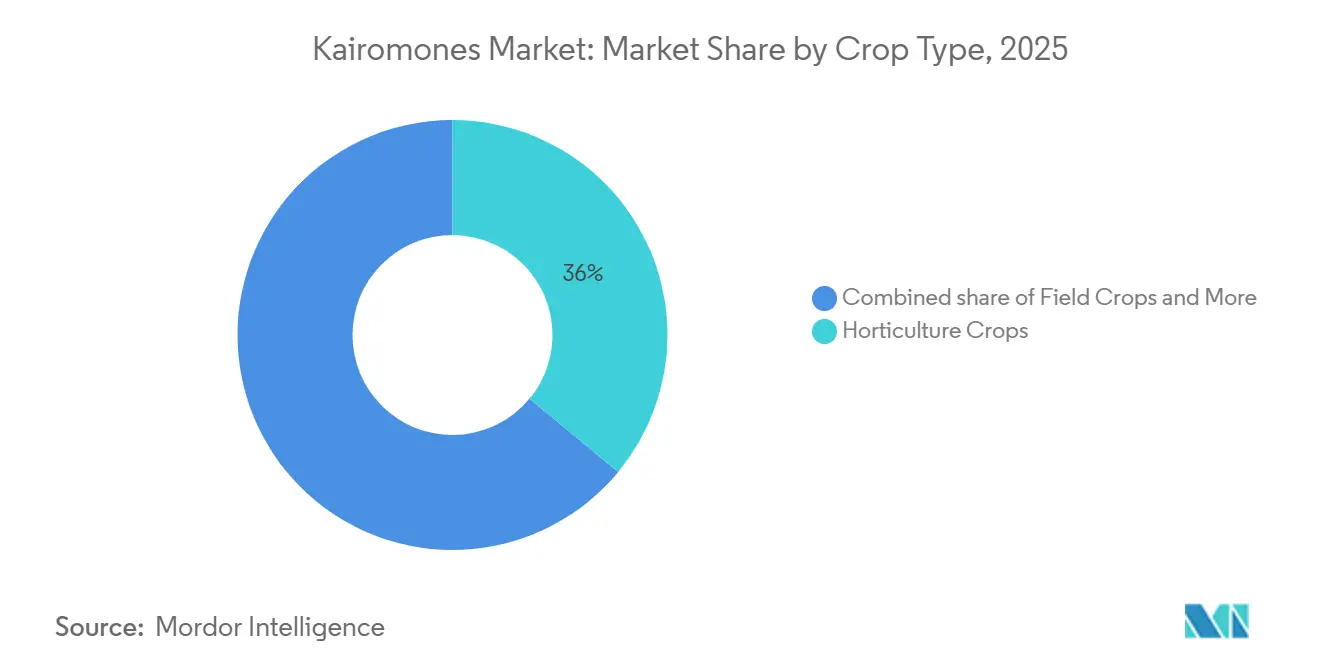
- By crop type, horticulture crops captured the largest 36% kairomones market share in 2025, while the market size for floriculture is set to grow at the fastest 17.5% CAGR during 2026-2031.
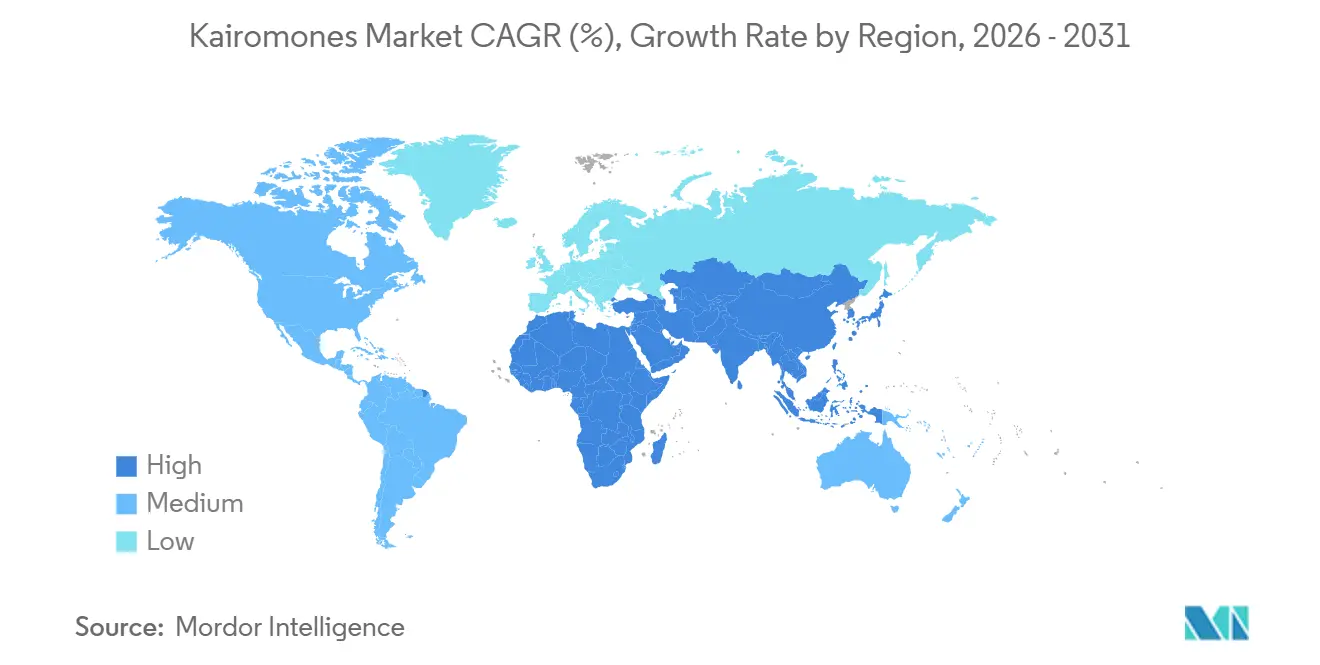
- By geography, Europe accounted for the largest 29% market share in 2025, and the Asia-Pacific market size is projected to post the fastest 15.8% CAGR from 2026 to 2031.
Note: Market size and forecast figures in this report are generated using Mordor Intelligence’s proprietary estimation framework, updated with the latest available data and insights as of January 2026.
Global Kairomones Market Trends and Insights
Drivers Impact Analysis*
| Driver | (~) % Impact on CAGR Forecast | Geographic Relevance | Impact Timeline |
|---|---|---|---|
| Regulatory push to replace broad-spectrum insecticides | +2.5% | Europe, North America, and Asia-Pacific | Medium term (2-4 years) |
| Falling unit-cost of bio-fermented semiochemicals | +2.0% | Global production hubs in Europe, North America, China, and India | Long term (≥ 4 years) |
| Precision-ag adoption of smart kairomone lures | +1.8% | North America and Europe core, and spillover to Asia-Pacific | Medium term (2-4 years) |
| Climate-smart repellent portfolios for heat-stressed regions | +1.5% | Asia-Pacific, Middle East and Africa, and South America | Long term (≥ 4 years) |
| Clustered Regularly Interspaced Short Palindromic (CRISPR)-engineered microbial chassis for volatile synthesis | +1.2% | North America and Europe R and D centers | Long term (≥ 4 years) |
| Digital-twin modeling that optimizes kairomone release | +1.0% | North America and Europe precision-ag clusters | Medium term (2-4 years) |
| Source: Mordor Intelligence | |||
Regulatory Push to Replace Broad-Spectrum Insecticides
Governments are increasingly implementing stricter residue limits, prompting growers to adopt low-risk alternatives. This shift is encouraging the use of kairomone lures within integrated pest management (IPM) frameworks. The Sustainable Use Regulation (SUR), proposed by the European Union in 2022, seeks to enhance the adoption of integrated pest management (IPM) by encouraging the use of non-chemical alternatives and reducing the risk by 50% by 2030[1]Source: European Commission, “Proposal for a Regulation on the Sustainable Use of Plant Protection Products,” food.ec.europa.eu. In Canada, Health Canada's pesticide re-evaluation programs continue to review semiochemical substances, demonstrating ongoing regulatory oversight. These regulatory developments promote reduced insecticide usage and assist growers in meeting certification standards such as GlobalG.A.P. and Rainforest Alliance.
Falling Unit-Cost of Bio-Fermented Semiochemicals
Declining unit costs of bio-fermented semiochemicals are driving increased adoption of kairomone-based solutions in crop protection. Improvements in metabolic engineering and fermentation processes have enhanced production efficiency, enabling scalable and cost-effective manufacturing of complex volatile compounds. For instance, a study published in Bioengineering and Biotechnology in 2021 indicates that engineered Yarrowia lipolytica serves as an effective microbial platform for producing insect pheromones and related semiochemicals. Advances in metabolic engineering have notably enhanced production efficiency compared to previous microbial systems.
Precision-Ag Adoption of Smart Kairomone Lures
Smart trapping systems, incorporating sensors, imaging, and data analytics, facilitate real-time pest surveillance. This allows farmers to implement targeted interventions and minimize unnecessary pesticide use. Research shows that pheromone-based monitoring systems can decrease non-target organism mortality by up to 89% [2]Source: Plant Archives, “Pheromone Traps in Insect Pest Management: Applications and Efficacy,” plantarchives.orgcompared to traditional insecticide methods, emphasizing their importance in sustainable pest management. Additionally, integrating AI-driven platforms and remote sensing tools into semiochemical-based systems enhances site-specific pest control, improving decision-making accuracy and optimizing resource utilization.
Climate-Smart Repellent Portfolios for Heat-Stressed Regions
Field trials conducted in Kenya in 2023 demonstrated that coreid-bug pheromone traps can increase French bean marketable yields by up to five times under field conditions [3]Source: Springer Nature, “Multifunctional Coreid Bug Pheromones for Efficient Bioprotection Against Legume Pests and Enhanced Food Productivity,” Chemical and Biological Technologies in Agriculture, 2024, link.springer.com. Research from the International Centre of Insect Physiology and Ecology and other institutions in 2024-2025 highlights that environmental factors, including elevated temperatures and humidity, significantly impact pheromone release dynamics and field efficacy. Higher temperatures accelerate volatilization and reduce persistence [4]Source: International Centre of Insect Physiology and Ecology, “Performance of Coreid-Bug Pheromone Traps,” icipe.org . According to research in 2021 by the Multidisciplinary Digital Publishing Institute, in date-palm groves across Saudi Arabia, the United Arab Emirates, and Oman, where summer temperatures frequently exceed 45°C, polyamide microcapsules and nano-emulsion systems have been shown to maintain effective concentrations for up to 90 days.
Restraints Impact Analysis*
| Restraint | (~) % Impact on CAGR Forecast | Geographic Relevance | Impact Timeline |
|---|---|---|---|
| High multi-jurisdictional registration fees | -2.8% | Europe, Japan, and Australia | Long term (≥ 4 years) |
| Field instability in hot and humid climates | -2.2% | Asia-Pacific tropics, Middle East and Africa, and South America | Medium term (2-4 years) |
| Patchy last-mile distribution in developing agri-economies | -1.8% | Sub-Saharan Africa, South Asia, and Southeast Asia | Medium term (2-4 years) |
| Brand cannibalization from low-priced synthetic pheromones | -1.5% | China, India, and South America | Short term (≤ 2 years) |
| Source: Mordor Intelligence | |||
High Multi-Jurisdictional Registration Fees
The preparation of identity, purity, efficacy, and environmental fate dossiers incurs high costs per active substance in the European Union, with approval processes taking several years. Comparable regulatory challenges in Japan and Australia provide a competitive edge to well-funded companies like Suterra LLC, while smaller innovators often opt to license formulations instead of pursuing independent registrations. According to the Organisation for Economic Co-operation and Development Biopesticide Steering Group, efforts are being made to establish mutual recognition frameworks, though progress remains slow.
Field Instability in Hot and Humid Climates
Volatile esters degrade quickly when daily temperatures are high, requiring dispenser replacement frequently and increasing per-hectare costs for smallholder farmers. Nano-emulsion carrier systems can increase factory-level costs significantly, restricting adoption in cost-sensitive regions such as Benin, Ghana, and coastal India. Thermo-responsive polymer technologies, designed for controlled release during peak pest activity, are being investigated as a potential solution. However, these systems are currently at the pilot stage and are not anticipated to reach commercialization in the near term.
*Our forecasts treat driver/restraint impacts as directional, not additive. The impact forecasts reflect baseline growth, mix effects, and variable interactions.
Segment Analysis
By Function: Mating Disruption Accelerates as Fermentation Scales
The detection and monitoring segment remains the largest in the kairomones market, accounting for 41% of the market share in 2025. However, this segment is maturing in regions such as Europe and North America, where lure-based scouting methods are already widely adopted. The mating disruption market size is projected to grow at the fastest rate, with a CAGR of 18% from 2026 to 2031, surpassing the overall market growth rate of 12.6%. This growth is driven by declining production costs and increasing adoption in large-scale crop protection strategies. Meanwhile, mass trapping continues to gain steady traction in regions like Kenya and Brazil, supported by advancements in formulation technologies that improve field performance under challenging environmental conditions.
In 2022, Suterra LLC, a global provider of sustainable pheromone pest control solutions, announced that four of its established products are now listed with the Organic Materials Review Institute (OMRI) for use in organic agricultural production. Further, Russell IPM Ltd's artificial intelligence (AI)-enabled trapping systems in Kenya’s floriculture sector, facilitating data-driven pest control decisions in alignment with mating disruption programs. These developments reflect a broader industry trend observed in recent years, transitioning from detection-focused solutions to disruption strategies. This shift is influenced by the integration of digital agriculture tools.


By Crop Type: Floriculture Surges on Zero-Residue Compliance
Horticulture crops held the largest share of the kairomones market, accounting for 36% in 2025. This dominance is attributed to the strong adoption of semiochemical-based solutions in high-value fruits and vegetables. The floriculture market size is projected to grow at the fastest CAGR of 17.5% from 2026 to 2031. Plantation crops are seeing increased use of pheromone-based pest control strategies, particularly in regions with challenging climatic conditions. Field crops exhibit a relatively slower adoption rate due to cost sensitivity among growers, although niche applications are emerging in specific markets.
Kenyan greenhouse rose producers emphasize export-driven demand, where pheromone-based pest control supports compliance with international certification standards. Russell IPM Ltd contributed to these efforts by providing dispenser technologies that helped growers comply with strict retailer requirements. In the Gulf region, plantation operators are increasingly adopting pheromone traps integrated with digital monitoring systems to improve pest control efficiency.
Geography Analysis
Europe remained the largest regional segment in the kairomones market, holding a 29% market share in 2025. This dominance is attributed to robust regulatory frameworks and the widespread adoption of integrated pest management practices in countries such as France, Germany, and the Netherlands. The region benefits from policy-driven transitions toward sustainable agriculture, increased local production of bio-based semiochemicals, and active participation in regional innovation programs. Additionally, Eastern European markets are gradually adopting kairomone-based solutions, supported by sustainability-focused agricultural initiatives.
The Asia-Pacific market size is projected to grow at the fastest rate, with a projected CAGR of 15.8% from 2026 to 2031. Growth in this region is driven by increasing biopesticide adoption, favorable government policies, and rising domestic production capabilities in countries like China and India. The integration of digital agriculture tools with semiochemical applications, particularly in high-value crop systems, is also gaining traction. However, infrastructure and adoption challenges in rural areas create a varied pace of market expansion across the region.
North America continues to play a pivotal role as a regulatory and innovation hub for the kairomones market. Evolving policies are encouraging broader adoption of semiochemical-based solutions among growers. South America is enhancing its market presence through cooperative-led distribution models and the increasing use of sustainable pest management practices in commercial agriculture. The Middle East and Africa are witnessing a gradual uptake of kairomone-based solutions, particularly in plantation and export-oriented crops. This growth is supported by advancements in monitoring technologies and a growing awareness of residue-free agricultural practices.

Competitive Landscape
In 2025, Suterra LLC, Russell IPM Ltd, Koppert Biological Systems B.V., Provivi Inc, and ISCA Technologies Inc operate in a moderately concentrated kairomones market, where no single company holds a dominant global position in 2025. Their competitive advantages include multi-country regulatory registrations, vertically integrated production capabilities, and partnerships with agricultural input distributors, ensuring effective last-mile reach. These companies have developed specialized expertise in specific crops and geographies, reducing direct pricing competition and enabling differentiated market positioning.
Beyond the leading players, fragmentation persists, with several specialized formulators and contract manufacturers providing region-specific solutions. Companies such as Synergy Semiochemicals Corp, Trece Inc, SEDQ Healthy Crops S.L., and Chemtica Internacional, S.A. focus on niche volatile compounds and depend heavily on localized distribution networks. This strategy allows them to remain competitive without significant marketing investments, though it may limit broader market expansion. Meanwhile, increasing innovation in biotechnology and formulation techniques is elevating the importance of technical expertise as a critical entry barrier.
Major agrochemical companies such as BASF SE, Bayer AG, and Syngenta Crop Protection AG are increasingly strengthening their presence through strategic collaborations and in-licensing of bio-based solutions to meet stricter regulatory requirements. These collaborations often involve partnerships with research institutions and smaller firms specializing in innovative bio-based technologies, enabling the development of sustainable and compliant agricultural solutions. Koppert Biological Systems B.V. is enhancing its integrated production capabilities to support the development and commercialization of semiochemicals in 2025, which play a crucial role in pest management by influencing the behavior of target organisms.
Kairomones Industry Leaders
Suterra LLC
Koppert Biological Systems B.V.
Russell IPM Ltd
Trece, Inc.
Provivi, Inc.
- *Disclaimer: Major Players sorted in no particular order

Recent Industry Developments
- September 2023: Russell IPM Ltd has developed a mating disruption product to manage the yellow stem borer. The DISMATE YSB utilizes insect sex pheromones to inhibit pest reproduction. Field trials have demonstrated its effectiveness, achieving over 90% control of the rice yellow stem borer.
- September 2022: ISCA Technologies, Inc. collaborated with academic institutions to develop plant-based pheromone production systems. This initiative aims to lower manufacturing costs and enhance the scalability of crop protection solutions.
- October 2021: Suterra LLC collaborated with Phytech Ltd to combine pheromone-based pest control with digital agronomy platforms. This partnership facilitates real-time monitoring and supports data-driven pest management decisions, enhancing crop protection outcomes.


Global Kairomones Market Report Scope
Kairomones are chemical signals emitted by one organism that inadvertently benefit another species. These signals are often utilized by pests or their natural enemies for locating hosts or prey. In agriculture, kairomones are employed in pest monitoring and control systems to enhance targeting accuracy and decrease dependence on traditional pesticides. The kairomones market report is segmented by function (mass trapping, detection and monitoring, mating disruption, and other functions), by crop type (field crops, horticulture crops, plantation crops, floriculture, and other crop types), and by geography (North America, South America, Europe, Asia-Pacific, the Middle East, and Africa). The market forecasts are provided in terms of value (USD).
| Mass Trapping |
| Detection and Monitoring |
| Mating Disruption |
| Other Functions |
| Field Crops |
| Horticulture Crops |
| Plantation Crops |
| Floriculture |
| Other Crop Types |
| North America | United States |
| Canada | |
| Mexico | |
| Rest of North America | |
| South America | Brazil |
| Argentina | |
| Rest of South America | |
| Europe | Germany |
| France | |
| Russia | |
| United Kingdom | |
| Rest of Europe | |
| Asia-Pacific | China |
| India | |
| Japan | |
| Australia | |
| Rest of Asia-Pacific | |
| Middle East | Saudi Arabia |
| United Arab Emirates | |
| Rest of Middle East | |
| Africa | South Africa |
| Kenya | |
| Rest of Africa |
| By Function | Mass Trapping | |
| Detection and Monitoring | ||
| Mating Disruption | ||
| Other Functions | ||
| By Crop Type | Field Crops | |
| Horticulture Crops | ||
| Plantation Crops | ||
| Floriculture | ||
| Other Crop Types | ||
| By Geography | North America | United States |
| Canada | ||
| Mexico | ||
| Rest of North America | ||
| South America | Brazil | |
| Argentina | ||
| Rest of South America | ||
| Europe | Germany | |
| France | ||
| Russia | ||
| United Kingdom | ||
| Rest of Europe | ||
| Asia-Pacific | China | |
| India | ||
| Japan | ||
| Australia | ||
| Rest of Asia-Pacific | ||
| Middle East | Saudi Arabia | |
| United Arab Emirates | ||
| Rest of Middle East | ||
| Africa | South Africa | |
| Kenya | ||
| Rest of Africa | ||


Key Questions Answered in the Report
What is the current size and growth outlook for the kairomones market?
The kairomones market size reached USD 0.90 billion in 2026 and is projected to hit USD 1.63 billion by 2031, reflecting a 12.6% CAGR from 2026 to 2031.
Which application area is scaling the fastest?
Mating disruption is expanding at an 18% CAGR from 2026 to 2031 because cheaper microbial fermentation has lowered cost per hectare.
Which crop segment presents the strongest potential for new sales?
Floriculture shows the fastest 17.5% CAGR from 2026 to 2031 as export growers in Kenya, Colombia, and Netherlands chase zero-residue compliance.
How are regulations influencing adoption?
Residue-limit mandates in the European Union, United States, and Canada are moving kairomones from optional tools to regulatory necessities, accelerating uptake.
Page last updated on:


