Crab Market Size and Share
Crab Market Analysis by Mordor Intelligence
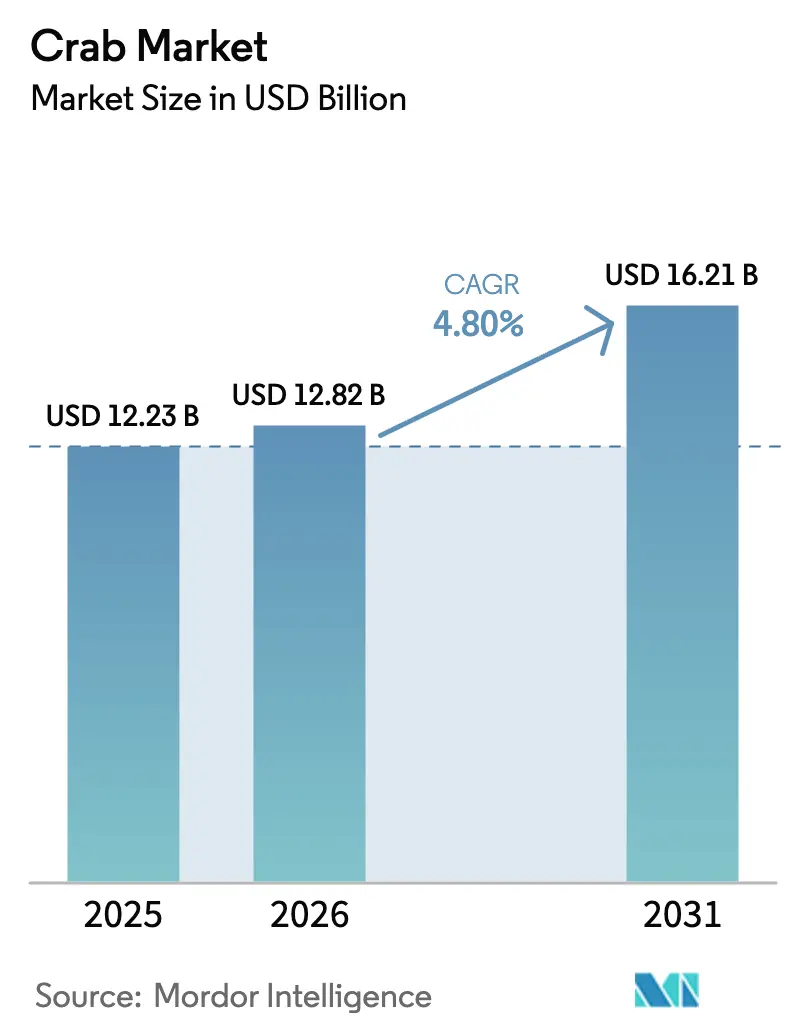
The crab market size is projected to grow from USD 12.23 billion in 2025 to USD 12.82 billion in 2026 and is forecast to reach USD 16.21 billion by 2031 at a 4.80% CAGR over 2026-2031. This growth is driven by post-heatwave biomass recovery, increased aquaculture production, and consistent demand from the luxury dining segment. Tighter quotas in Alaska, Canada, and Norway have constrained wild-caught supplies, keeping menu prices high despite stabilizing foodservice volumes. Asia-Pacific importers continue to lead in primary processing and re-export activities, while Africa's expanding cold-storage infrastructure positions the region as an emerging growth area. In the European Union, traceability mandates and increasing consumer willingness to pay premiums for verified product provenance are driving digital investments across the supply chain. Meanwhile, the expansion of aquaculture in Southeast Asia is contributing to lower-cost farmed volumes, thereby stabilizing the overall supply. Wild red king crab remains a premium, inelastic product for luxury buyers, creating a clear distinction between cost-driven and high-end market segments.
Key Report Takeaways
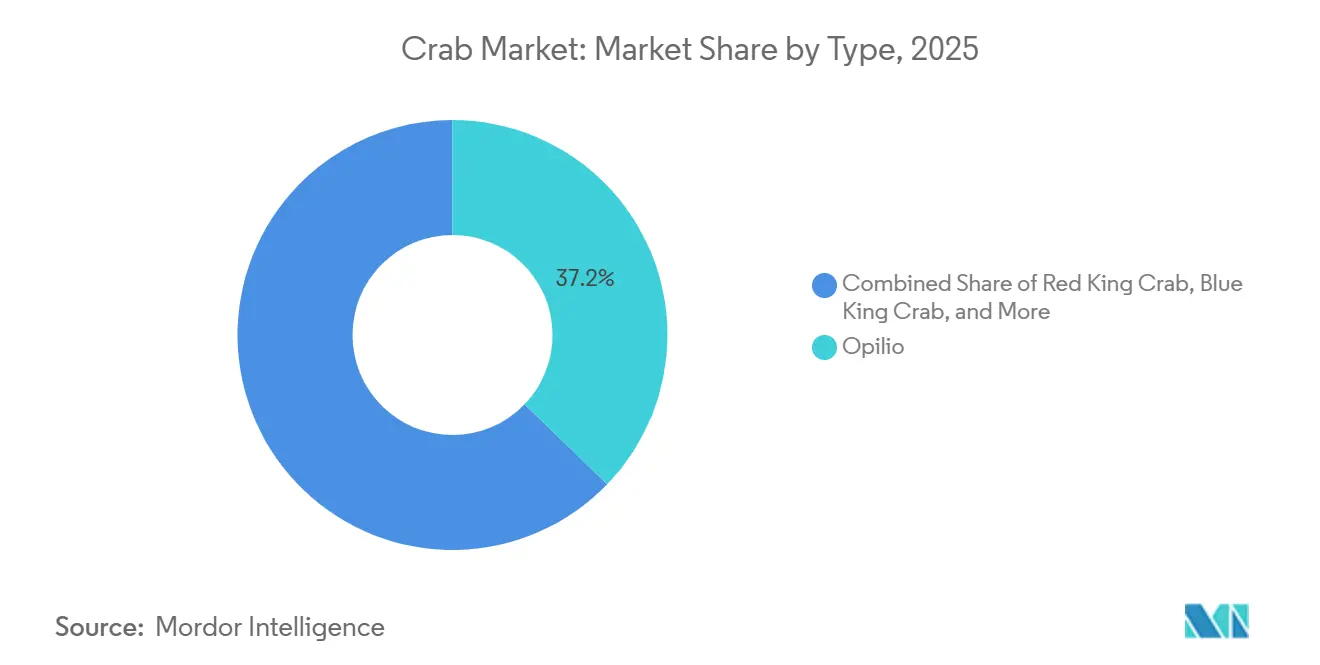
- By type, opilio led with 37.2% of the crab market share in 2025, and red king crab is forecast to expand at a 4.9% CAGR through 2031, the fastest rate among all crab types.
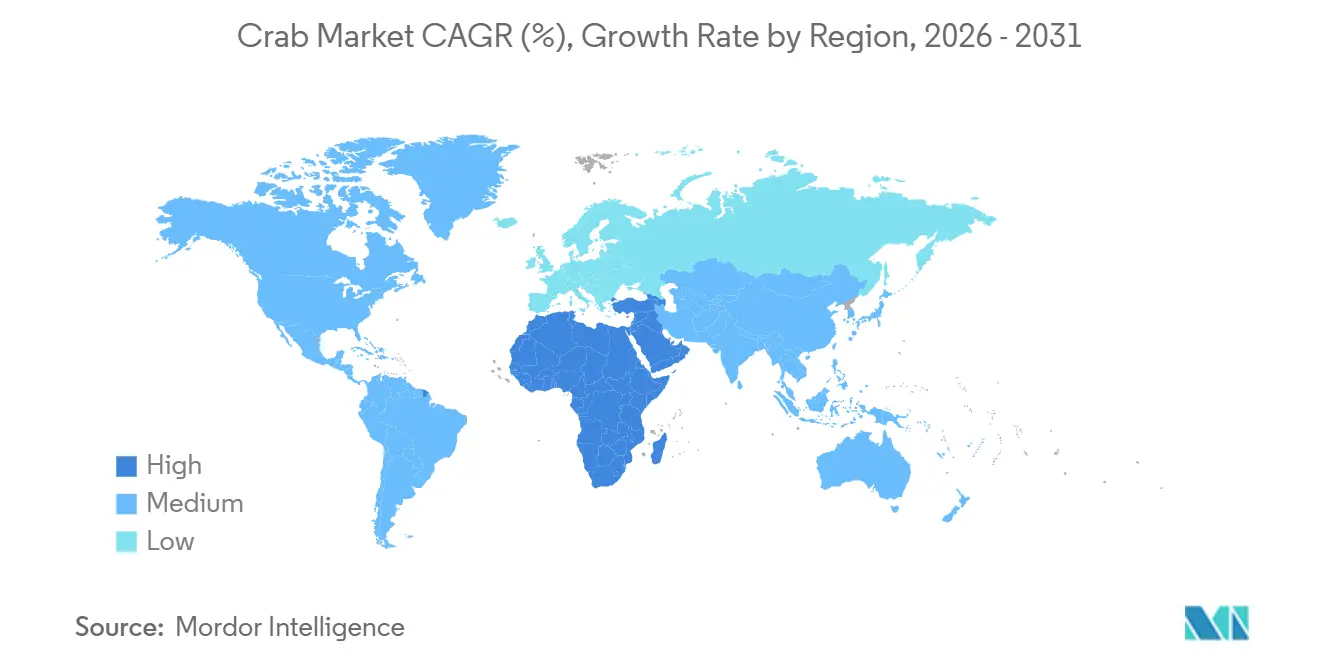
- By geography, the Asia-Pacific region accounted for 54.6% of the crab market size in 2025, while Africa is poised to advance at a 4.5% CAGR through 2031.
Note: Market size and forecast figures in this report are generated using Mordor Intelligence’s proprietary estimation framework, updated with the latest available data and insights as of January 2026.
Global Crab Market Trends and Insights
Drivers Impact Analysis*
| Driver | (~) % Impact on CAGR Forecast | Geographic Relevance | Impact Timeline |
|---|---|---|---|
| Mainstream rebound in foodservice export demand | +0.7% | North America, Europe, and Asia-Pacific | Short term (≤ 2 years) |
| Growing appetite for premium king and snow crab | +0.8% | Japan, South Korea, United States, and European Union | Medium term (2-4 years) |
| Accelerating shift toward farm-based grow-out and fattening | +0.5% | Vietnam, Indonesia, Philippines, and China | Medium term (2-4 years) |
| Automation and AI adoption in grading and butchering lines | +0.3% | North America and Europe | Medium term (2-4 years) |
| Genetic selection programs raising larval survival | +0.2% | Norway, Japan, pilot sites in North America | Long term (≥ 4 years) |
| Blockchain traceability unlocking gourmet retail channels | +0.1% | European Union and North America | Short term (≤ 2 years) |
| Source: Mordor Intelligence | |||


Mainstream Rebound in Foodservice Export Demand
Upscale restaurants in the United States and Western Europe returned to pre-pandemic levels of crab purchasing in early 2025, resulting in an 18% year-over-year increase in full-service menu volumes. White-tablecloth operators entered into multi-year procurement agreements at prices 20% higher than those in 2024, indicating low price sensitivity among luxury diners. These contracted volumes help reduce inventory fluctuations for processors and allow harvesters to optimize quota utilization, contributing to market stability during off-peak seasons.[1]Source: National Oceanic and Atmospheric Administration, “Alaska Fisheries Science Center,” NOAA.GOV Cruise lines and casino resorts further enhanced demand predictability by securing capacity ahead of peak travel periods. This recovery highlights foodservice as the largest value channel, accounting for a significant portion of global spending.
Growing Appetite for Premium King and Snow Crab
Japanese imports of live red king crab have been increasing year after year. This growth was driven by demand from high-end sushi venues, where whole-crab presentations command significant premiums. In early 2025, auction prices for Canadian snow crab in Busan rose to USD 42 per kilogram, reflecting strong demand in the Korean market. Limited wild quotas contribute to scarcity, which high-income consumers are willing to pay for, reinforcing the luxury brand perception of king crab. Norwegian and Icelandic vessels with Marine Stewardship Council certification achieve a 10% to 15% price premium in European foodservice channels[2]Source: Marine Stewardship Council, “Price Premiums in Certified Seafood,” MSC.ORG. Additionally, social media influencers showcasing large plated crabs have garnered millions of views, increasing awareness among younger consumers and sustaining aspirational demand. This premium segment remains insulated from the fluctuations in commodity prices observed in lower-grade seafood markets.
Accelerating Shift Toward Farm-Based Grow-Out and Fattening
Vietnam, Indonesia, and the Philippines produced an estimated 180,000 metric tons of mud crab in 2024, an increase from 145,000 metric tons in 2022, driven by the addition of intensive fattening ponds by farmers[3]Source: Food and Agriculture Organization, “Global Fishery Statistics,” FAO.ORG. The use of formulated feeds and controlled salinity has reduced grow-out cycles from six months to four months, enhancing annual production capacity and improving farm cash flow. Soft-shell crab commands a price of USD 18 to USD 22 per kilogram at the farm gate, making it a highly profitable specialty export to markets such as Japan and the United States. Chinese processors are investing in integrated hatchery-to-processing complexes to capture margins across larval production, grow-out, and frozen packing. The growing number of farms has diversified supply and mitigated seasonal shortages, thereby improving the overall resilience of the crab market. However, the increase in smallholder operations has led to variability in quality, further emphasizing the premium associated with certified operations.
Genetic Selection Programs Raising Larval Survival
The Institute of Marine Research hatcheries in Norway and the Japan Fisheries Research and Education Agency laboratories have increased king crab larval survival rates to 12-15%, compared to the historical range of 5-8%. Selective breeding efforts prioritize traits such as disease resistance, growth rate, and temperature tolerance, which are critical for commercial recirculating systems. Pilot land-based tanks in Norway are capable of producing market-size crabs in approximately 18 months, compared to up to 30 months for wild stock, thereby improving capital efficiency. Achieving survival rates above the 10% threshold significantly enhances the viability of inland crab farming ventures. Investors view this technology as a potential safeguard against climate-induced quota fluctuations in wild fisheries. If these survival improvements are sustained at scale, farmed king crab could secure a notable share of the crab market by the early 2030s.
Restraints Impact Analysis*
| Restraint | (~) % Impact on CAGR Forecast | Geographic Relevance | Impact Timeline |
|---|---|---|---|
| Climate-driven biomass volatility in northern seas | -0.6% | Bering Sea, Alaska, Canada, and Norway | Long term (≥ 4 years) |
| Growth of plant-based and imitation-crab alternatives | -0.4% | North America and Europe | Medium term (2-4 years) |
| Sanctions-related rerouting costs and delays | -0.3% | Europe, Russia, and China corridors | Short term (≤ 2 years) |
| Pathogen outbreaks in hatcheries | -0.3% | Southeast Asia farms, pilot facilities | Medium term (2-4 years) |
| Source: Mordor Intelligence | |||
Climate-Driven Biomass Volatility in Northern Seas
Marine heatwaves between 2018 and 2021 resulted in a significant decline in Bering Sea snow crab biomass, estimated at 10 billion individuals. This decline prompted Alaska to cancel two full fishing seasons, resulting in the loss of 40,000 metric tons of supply[4]Source: National Oceanic and Atmospheric Administration, “Bering Sea Snow Crab Assessment,” NOAA.GOV. Elevated bottom temperatures continue to compress viable habitats northward, increasing the risk of future population fluctuations. Similarly, warming conditions reduced Gulf of Saint Lawrence landings by 18% in 2024, highlighting the localized impact of these environmental changes. In response, buyers are diversifying sourcing across species and regions, though this strategy increases logistics costs and complicates traceability audits. Surveys conducted in 2025 indicate juvenile recovery, and scientists warn that persistent warming could negate recruitment gains, limiting long-term growth prospects for the crab market. Harvesters are advocating for adaptive quota frameworks that align with shifting biomass patterns, but regulatory changes remain slow to materialize.
Sanctions-Related Rerouting Costs and Delays
Western sanctions on Russian seafood, implemented in 2022, have compelled exporters to reroute king crab shipments through Vladivostok and Chinese intermediaries. This adjustment has resulted in extended transit times of up to 10 days and increased logistics costs. European importers, who previously sourced directly from Murmansk, now face longer lead times and diminished product freshness, which has narrowed profit margins. While Chinese reprocessors handle the redirected volumes, the additional processing introduces variability that is unappealing to premium buyers. Regulatory efforts to address transshipment loopholes, which obscure product origins, have further increased compliance costs throughout the supply chain. Arbitrage traders are capitalizing on temporary price discrepancies between Asian and European ports, adding further instability to the crab market. These disruptions are anticipated to persist until geopolitical tensions subside or alternative Northern suppliers can fully meet demand.
*Our forecasts treat driver/restraint impacts as directional, not additive. The impact forecasts reflect baseline growth, mix effects, and variable interactions.
Segment Analysis
By Type: Opilio Anchors Volume, Red King Crab Commands Premium Growth
Opilio crab accounted for 37.2% of the crab market share in 2025, supported by Canadian quotas exceeding 80,000 metric tons and a gradually recovering Alaskan biomass. This established a dominant yet stable foundation for the crab market at the species level. The species' high natural abundance and well-developed processing infrastructure enable packers to produce cluster packs, section cuts, and picked meat, meeting both retail and foodservice demand globally. Modern Canadian processing facilities equipped with automated graders and expanded cold storage ensure quality during peak harvests, facilitating year-round shipments to the United States and Asian markets. Climate change is pushing fleets farther north, increasing fuel costs and operational risks, which may constrain long-term growth. Opilio crab faces competition from low-cost surimi products and emerging plant-based alternatives that replicate its mild flavor profile. Despite these challenges, the species remains essential to buffet, casual dining, and meal-kit channels, which rely on consistent portion sizes.
Red king crab is the fastest-growing segment, with a projected CAGR of 4.9% through 2031, transitioning from a luxury niche to a broader yet premium market presence. Limited quotas in Alaska and Russia, combined with Marine Stewardship Council certification requirements, have driven up ex-vessel prices, positioning the species in fine dining, cruise lines, and high-end retail markets where whole crab displays emphasize its premium value. Norwegian trap fisheries in the Barents Sea, which benefit from strict management and cold-water conditions, deliver meat profiles that command a 10-15% price premium over those from Alaskan products, thereby expanding supplier options for Japanese and South Korean buyers. While genetic hatchery advancements and land-based recirculating aquaculture trials suggest potential future supply increases, commercial scalability remains at least a decade away. The popularity of king-crab mukbang videos on social media has attracted younger demographics, sustaining demand even during economic fluctuations. The species' luxury positioning shields it from value-tier substitutes, solidifying its role as the premium growth driver within the crab market.


Geography Analysis
The Asia-Pacific region maintained a 54.6% share of the crab market in 2025, underscoring its significant influence on global demand trends. China operates as a major reprocessing hub, where imported raw crab from Russia, Canada, and the United States is processed into frozen clusters, picked meat, and convenience packs. These products are then re-exported to Europe and the Middle East, capturing value at each stage of the conversion process. According to the Food and Agriculture Organization, Japan imported 35,340 metric tons of crab in 2023, catering to luxury dining traditions that emphasize whole-crab presentations, particularly in sushi and kaiseki segments, which command high unit prices. South Korea's auction markets reported strong activity, with early 2025 snow crab prices reaching USD 42 per kilogram, reflecting continued consumer demand for hot-pot and grill preparations. Meanwhile, Southeast Asia is expanding mud crab farming, contributing to a growing supply that helps mitigate seasonal fluctuations in the broader crab market.
Africa, while starting from a smaller base, is the fastest-growing region in the crab market, with a projected CAGR of 4.5% through 2031. This growth is driven by investments in refrigerated logistics that connect South African and Egyptian fisheries to premium markets in Dubai and Riyadh. South Africa's West Coast rock-lobster fleets are diversifying into crab, utilizing upgraded cold storage facilities to ship live and chilled products by air, a model favored by Middle Eastern buyers prioritizing freshness. Egypt is modernizing its small Mediterranean fleets to expand beyond regional sales and target higher-value export markets. Kenya's Indian Ocean coastline is attracting investment from regional seafood companies, which view crab as a complementary revenue stream to finfish exports. Although infrastructure challenges remain, increasing intra-African trade agreements and airport upgrades are projected to better integrate the continent into the global crab market over the next decade.
Europe remains the second-largest crab market by value, with TRACE4EU traceability regulations reshaping import protocols and favoring suppliers with strong digital compliance systems. The Netherlands serves as a redistribution hub through Rotterdam, channeling volumes to France, Belgium, and the United Kingdom. French brasseries and upscale markets prioritize live king crab, positioning it as a festive centerpiece that supports stable margins. Post-Brexit tariff complexities have led some Scottish processors to relocate finishing lines to Northern Ireland to maintain zero-tariff access to the European Union, illustrating the regulatory challenges affecting supply chains. Norwegian and Icelandic catches benefit from preferential access due to geographic proximity and established cold-chain infrastructure, reinforcing Northern Europe as a critical node in the global crab market.

Competitive Landscape
Regulators, including the National Oceanic and Atmospheric Administration, Fisheries and Oceans Canada, and the Norwegian Directorate of Fisheries, set primary capacity limits for wild-harvest operators. This pushes processors to prioritize efficiency, cold-chain reliability, and certification. Clearwater Seafoods and Royal Greenland exemplify vertical integration, managing everything from permits and harvesting vessels to at-sea processing and direct distribution to premium grocers. Here, traceability and quality assurance command higher prices. Trident Seafoods employs computer-vision grading, which cuts labor by 25% and enhances yield. This technical advantage poses a challenge for mid-sized peers, who would need significant capital to replicate it. Automation not only minimizes worker safety incidents but also facilitates continuous processing, bolstering economies of scale in the crab market.
Aquaculture is still a patchwork, with numerous small mud-crab pond operators in Southeast Asia trading locally. Genetic breakthroughs in Norway and Japan are paving the way for land-based king crab farming. This has drawn the attention of venture capitalists and tech suppliers, who foresee a lucrative market less affected by the volatility of wild biomass. On another front, plant-based pioneers such as Good Catch and Gathered Foods are aggressively marketing to flexitarian consumers. While this threatens to divert volume from traditional value channels, it has spurred conventional processors to introduce hybrid products with diminished shell content. In China, reprocessors are capitalizing on low labor costs and strategically accessing Russian supplies, even those diverted from sanctions. This has positioned them as leaders in mid-grade frozen exports.
Equipment suppliers Marel and Baader are focusing their intellectual property on computer-vision systems and robotic cutters. By licensing their proprietary algorithms globally, they're not just monetizing their innovations but also ensuring that customers are locked into upgrade pathways. This strategy effectively embeds technological advantages within the crab processing segment. Certification, particularly from the Marine Stewardship Council, serves two key purposes: it facilitates market access and functions as a price differentiator. Such certifications can command premiums of 10-15%, easily offsetting audit costs and bolstering brand equity. The competitive landscape is segmented, with a few vertically integrated companies leading the wild-catch premium segment, while nimble farm operators and plant-based producers focus on niche opportunities in value and specialty markets. As compliance costs rise and sustainability demands grow, market concentration is projected to increase. Yet, biological and geopolitical challenges will ensure a continued presence for diverse regional suppliers.
Recent Industry Developments
- December 2025: Russian Crab Company Group (RCCG) has shipped its first 700 metric tons of air-blast frozen Barents king crab to the Japanese market. This shipment represents a strategic shift for the company, which is the largest crab harvester in Russia's Far East and has recently expanded its operations into the Barents Sea.
- December 2025: Live king crab imports through Jimunai Port in China's Xinjiang Uyghur Autonomous Region reached a record trade volume of over USD 14.3 million. This increase highlights Xinjiang's growing importance as a seafood corridor for northwest China, catering to rising domestic demand for luxury seafood during peak periods such as the New Year's Day holiday.
- December 2025: Captain Fresh, through its subsidiary CenSea, acquired Ocean Edge Foods, a United States-based importer of crab and lobster. This acquisition aligns with Captain Fresh's strategy to expand its presence in the North American luxury seafood and protein markets.
- August 2025: Researchers from the University of Kerala and the National University of Singapore have identified a new genus and two new species of freshwater crabs in the Western Ghats of Kerala. These findings underscore the region's significant endemism, with approximately 70% of its freshwater crab species being unique to this area.


Research Methodology Framework and Report Scope
Market Definitions and Key Coverage
Our study defines the global crab market as the annual value of live, fresh-chilled, frozen, and canned wild-caught or farmed crabs, blue, king, snow, opilio, gazami, mitten, and other commercially traded species moving through retail, food-service, and wholesale export channels. We track volumes in metric tons and convert them to 2024 constant-USD using average transaction prices and IMF exchange data.
Scope Exclusions: Derivative products such as crab-flavored surimi, plant-based crab analogs, and non-food crab extracts are excluded.
Segmentation Overview
- By Type
- Red King Crab
- Blue King Crab
- Opilio
- Tanner
- Other Types (Dungeness Crab, Gazami, etc.)
- By Geography
- North America
- United States
- Production Analysis (Production Volume)
- Consumption Analysis (Consumption Value and Volume)
- Import Market Analysis (Import Value, Volume, and Key Supplying Markets)
- Export Market Analysis (Export Value, Volume, and Key Destination Markets)
- Wholesale Price Trend Analysis and Forecast
- Regulatory Framework
- List of Key Players
- Logistics and Infrastructure
- Seasonality Analysis
- Mexico
- Production Analysis (Production Volume)
- Consumption Analysis (Consumption Value and Volume)
- Import Market Analysis (Import Value, Volume, and Key Supplying Markets)
- Export Market Analysis (Export Value, Volume, and Key Destination Markets)
- Wholesale Price Trend Analysis and Forecast
- Regulatory Framework
- List of Key Players
- Logistics and Infrastructure
- Seasonality Analysis
- Canada
- Production Analysis (Production Volume)
- Consumption Analysis (Consumption Value and Volume)
- Import Market Analysis (Import Value, Volume, and Key Supplying Markets)
- Export Market Analysis (Export Value, Volume, and Key Destination Markets)
- Wholesale Price Trend Analysis and Forecast
- Regulatory Framework
- List of Key Players
- Logistics and Infrastructure
- Seasonality Analysis
- United States
- Europe
- Germany
- Production Analysis (Production Volume)
- Consumption Analysis (Consumption Value and Volume)
- Import Market Analysis (Import Value, Volume, and Key Supplying Markets)
- Export Market Analysis (Export Value, Volume, and Key Destination Markets)
- Wholesale Price Trend Analysis and Forecast
- Regulatory Framework
- List of Key Players
- Logistics and Infrastructure
- Seasonality Analysis
- United Kingdom
- Production Analysis (Production Volume)
- Consumption Analysis (Consumption Value and Volume)
- Import Market Analysis (Import Value, Volume, and Key Supplying Markets)
- Export Market Analysis (Export Value, Volume, and Key Destination Markets)
- Wholesale Price Trend Analysis and Forecast
- Regulatory Framework
- List of Key Players
- Logistics and Infrastructure
- Seasonality Analysis
- France
- Production Analysis (Production Volume)
- Consumption Analysis (Consumption Value and Volume)
- Import Market Analysis (Import Value, Volume, and Key Supplying Markets)
- Export Market Analysis (Export Value, Volume, and Key Destination Markets)
- Wholesale Price Trend Analysis and Forecast
- Regulatory Framework
- List of Key Players
- Logistics and Infrastructure
- Seasonality Analysis
- Netherlands
- Production Analysis (Production Volume)
- Consumption Analysis (Consumption Value and Volume)
- Import Market Analysis (Import Value, Volume, and Key Supplying Markets)
- Export Market Analysis (Export Value, Volume, and Key Destination Markets)
- Wholesale Price Trend Analysis and Forecast
- Regulatory Framework
- List of Key Players
- Logistics and Infrastructure
- Seasonality Analysis
- Norway
- Production Analysis (Production Volume)
- Consumption Analysis (Consumption Value and Volume)
- Import Market Analysis (Import Value, Volume, and Key Supplying Markets)
- Export Market Analysis (Export Value, Volume, and Key Destination Markets)
- Wholesale Price Trend Analysis and Forecast
- Regulatory Framework
- List of Key Players
- Logistics and Infrastructure
- Seasonality Analysis
- Germany
- Asia-Pacific
- China
- Production Analysis (Production Volume)
- Consumption Analysis (Consumption Value and Volume)
- Import Market Analysis (Import Value, Volume, and Key Supplying Markets)
- Export Market Analysis (Export Value, Volume, and Key Destination Markets)
- Wholesale Price Trend Analysis and Forecast
- Regulatory Framework
- List of Key Players
- Logistics and Infrastructure
- Seasonality Analysis
- India
- Production Analysis (Production Volume)
- Consumption Analysis (Consumption Value and Volume)
- Import Market Analysis (Import Value, Volume, and Key Supplying Markets)
- Export Market Analysis (Export Value, Volume, and Key Destination Markets)
- Wholesale Price Trend Analysis and Forecast
- Regulatory Framework
- List of Key Players
- Logistics and Infrastructure
- Seasonality Analysis
- Japan
- Production Analysis (Production Volume)
- Consumption Analysis (Consumption Value and Volume)
- Import Market Analysis (Import Value, Volume, and Key Supplying Markets)
- Export Market Analysis (Export Value, Volume, and Key Destination Markets)
- Wholesale Price Trend Analysis and Forecast
- Regulatory Framework
- List of Key Players
- Logistics and Infrastructure
- Seasonality Analysis
- Australia
- Production Analysis (Production Volume)
- Consumption Analysis (Consumption Value and Volume)
- Import Market Analysis (Import Value, Volume, and Key Supplying Markets)
- Export Market Analysis (Export Value, Volume, and Key Destination Markets)
- Wholesale Price Trend Analysis and Forecast
- Regulatory Framework
- List of Key Players
- Logistics and Infrastructure
- Seasonality Analysis
- Indonesia
- Production Analysis (Production Volume)
- Consumption Analysis (Consumption Value and Volume)
- Import Market Analysis (Import Value, Volume, and Key Supplying Markets)
- Export Market Analysis (Export Value, Volume, and Key Destination Markets)
- Wholesale Price Trend Analysis and Forecast
- Regulatory Framework
- List of Key Players
- Logistics and Infrastructure
- Seasonality Analysis
- Philippines
- Production Analysis (Production Volume)
- Consumption Analysis (Consumption Value and Volume)
- Import Market Analysis (Import Value, Volume, and Key Supplying Markets)
- Export Market Analysis (Export Value, Volume, and Key Destination Markets)
- Wholesale Price Trend Analysis and Forecast
- Regulatory Framework
- List of Key Players
- Logistics and Infrastructure
- Seasonality Analysis
- Vietnam
- Production Analysis (Production Volume)
- Consumption Analysis (Consumption Value and Volume)
- Import Market Analysis (Import Value, Volume, and Key Supplying Markets)
- Export Market Analysis (Export Value, Volume, and Key Destination Markets)
- Wholesale Price Trend Analysis and Forecast
- Regulatory Framework
- List of Key Players
- Logistics and Infrastructure
- Seasonality Analysis
- China
- South America
- Brazil
- Production Analysis (Production Volume)
- Consumption Analysis (Consumption Value and Volume)
- Import Market Analysis (Import Value, Volume, and Key Supplying Markets)
- Export Market Analysis (Export Value, Volume, and Key Destination Markets)
- Wholesale Price Trend Analysis and Forecast
- Regulatory Framework
- List of Key Players
- Logistics and Infrastructure
- Seasonality Analysis
- Argentina
- Production Analysis (Production Volume)
- Consumption Analysis (Consumption Value and Volume)
- Import Market Analysis (Import Value, Volume, and Key Supplying Markets)
- Export Market Analysis (Export Value, Volume, and Key Destination Markets)
- Wholesale Price Trend Analysis and Forecast
- Regulatory Framework
- List of Key Players
- Logistics and Infrastructure
- Seasonality Analysis
- Brazil
- Middle East
- Turkey
- Production Analysis (Production Volume)
- Consumption Analysis (Consumption Value and Volume)
- Import Market Analysis (Import Value, Volume, and Key Supplying Markets)
- Export Market Analysis (Export Value, Volume, and Key Destination Markets)
- Wholesale Price Trend Analysis and Forecast
- Regulatory Framework
- List of Key Players
- Logistics and Infrastructure
- Seasonality Analysis
- United Arab Emirates
- Production Analysis (Production Volume)
- Consumption Analysis (Consumption Value and Volume)
- Import Market Analysis (Import Value, Volume, and Key Supplying Markets)
- Export Market Analysis (Export Value, Volume, and Key Destination Markets)
- Wholesale Price Trend Analysis and Forecast
- Regulatory Framework
- List of Key Players
- Logistics and Infrastructure
- Seasonality Analysis
- Turkey
- Africa
- Egypt
- Production Analysis (Production Volume)
- Consumption Analysis (Consumption Value and Volume)
- Import Market Analysis (Import Value, Volume, and Key Supplying Markets)
- Export Market Analysis (Export Value, Volume, and Key Destination Markets)
- Wholesale Price Trend Analysis and Forecast
- Regulatory Framework
- List of Key Players
- Logistics and Infrastructure
- Seasonality Analysis
- Kenya
- Production Analysis (Production Volume)
- Consumption Analysis (Consumption Value and Volume)
- Import Market Analysis (Import Value, Volume, and Key Supplying Markets)
- Export Market Analysis (Export Value, Volume, and Key Destination Markets)
- Wholesale Price Trend Analysis and Forecast
- Regulatory Framework
- List of Key Players
- Logistics and Infrastructure
- Seasonality Analysis
- South Africa
- Production Analysis (Production Volume)
- Consumption Analysis (Consumption Value and Volume)
- Import Market Analysis (Import Value, Volume, and Key Supplying Markets)
- Export Market Analysis (Export Value, Volume, and Key Destination Markets)
- Wholesale Price Trend Analysis and Forecast
- Regulatory Framework
- List of Key Players
- Logistics and Infrastructure
- Seasonality Analysis
- Egypt
- North America
Detailed Research Methodology and Data Validation
Primary Research
Mordor analysts interview harvesters, aquaculture specialists, processors, distributors, and food-service buyers across Asia-Pacific, North America, Europe, and the GCC. Discussions clarify farm-gate prices, yield losses, feed cost outlook, and retail mark-ups, and they validate preliminary model outputs drawn from desk work.
Desk Research
We start by collating five years of production, trade, and price series from tier-one public sources such as FAO FishStat, UN Comtrade, NOAA Fisheries, Eurostat, and China's MARA, which reveal supply swings and seasonality. Policy notes from bodies such as the Indian MPEDA, Japan's MAFF, and the International Transport Forum help us gauge regulatory shifts and cold-chain gaps. Company filings, seafood association briefs, and reputable press enrich our demand and channel insights. Paid repositories, Volza for shipment-level exports and D&B Hoovers for processor revenues, supplement country splits. The sources listed are illustrative; many additional datasets are consulted for verification and context.
Market-Sizing & Forecasting
We employ a top-down construct: national production plus net imports builds the consumable pool, which is then priced by average wholesale values to yield base-year revenue. Select bottom-up checks, sampled processor sales, channel margins, and freezer capacity audits tighten the totals. Key variables feeding the model include capture quotas, pond stocking densities, import tariff changes, disposable income per capita, and frozen seafood penetration in grocery retail. Forecasts to 2030 rely on multivariate regression blended with ARIMA overlays, using the above drivers and expert consensus to generate three scenario bounds. Our reference case underpins the report.
Data Validation & Update Cycle
Before release, outputs undergo variance reviews against historic elasticity ranges, inter-analyst peer checks, and anomaly flags from automated dashboards. Reports refresh every twelve months, with mid-cycle patches issued if quota reforms, disease outbreaks, or trade bans materially shift the baseline.
Why Mordor's Crab Market Baseline Commands Reliability
Published crab values often diverge because firms pick different species baskets, ignore informal trade, or freeze exchange rates at outdated benchmarks. By basing estimates on verifiable production plus trade math and refreshing currency weights each quarter, we lessen those skews.
Key Gap Drivers include narrower species scope, omission of food-service flows, static pricing assumptions, or infrequent model updates used elsewhere.
Benchmark comparison
| Market Size | Anonymized source | Primary gap driver |
|---|---|---|
| USD 13.04 B (2025) | Mordor Intelligence | - |
| USD 3.44 B (2024) | Global Consultancy A | Tracks only packaged retail sales in OECD markets |
| USD 11.37 B (2024) | Regional Consultancy B | Excludes food-service demand and fixes FX to 2023 averages |
| USD 10.90 B (2024) | Industry Association C | Omits aquaculture output and relies on producer self-reports |
In sum, our disciplined blend of audited public data, field intelligence, and rolling currency updates gives decision-makers a transparent, repeatable baseline they can trust for strategic planning.


Key Questions Answered in the Report
What is the current crab market size and its growth outlook to 2031?
The crab market size is USD 12.82 billion in 2026 and is forecast to reach USD 16.21 billion by 2031.
Which crab species holds the largest volume share worldwide?
Opilio leads with 37.2% of global volume in 2025 due to high quotas in Canada and Alaska.
Which crab type is growing the fastest in value terms?
King crab is projected to rise at a 4.9% CAGR through 2031 because luxury dining demand remains robust despite high prices.
Which region consumes the most crab?
Asia-Pacific accounts for 54.6% of global consumption value in 2025, driven by China’s processing hubs and Japan’s live-crab appetite.
What technology trends are reshaping crab processing?
Computer-vision grading, robotic butchering, and blockchain traceability are cutting labor costs and raising transparency, delivering competitive advantage.
How are climate shifts affecting crab supply?
Warmer northern seas have already caused major biomass collapses in the Bering Sea, introducing volatility that forces buyers to diversify sourcing and hedge risk.
Page last updated on:


