Moisture Analyzer Market Size and Share
Market Overview
| Study Period | 2019 - 2030 |
|---|---|
| Market Size (2025) | USD 1.86 Billion |
| Market Size (2030) | USD 2.38 Billion |
| Growth Rate (2025 - 2030) | 5.06% CAGR |
| Fastest Growing Market | Asia Pacific |
| Largest Market | North America |
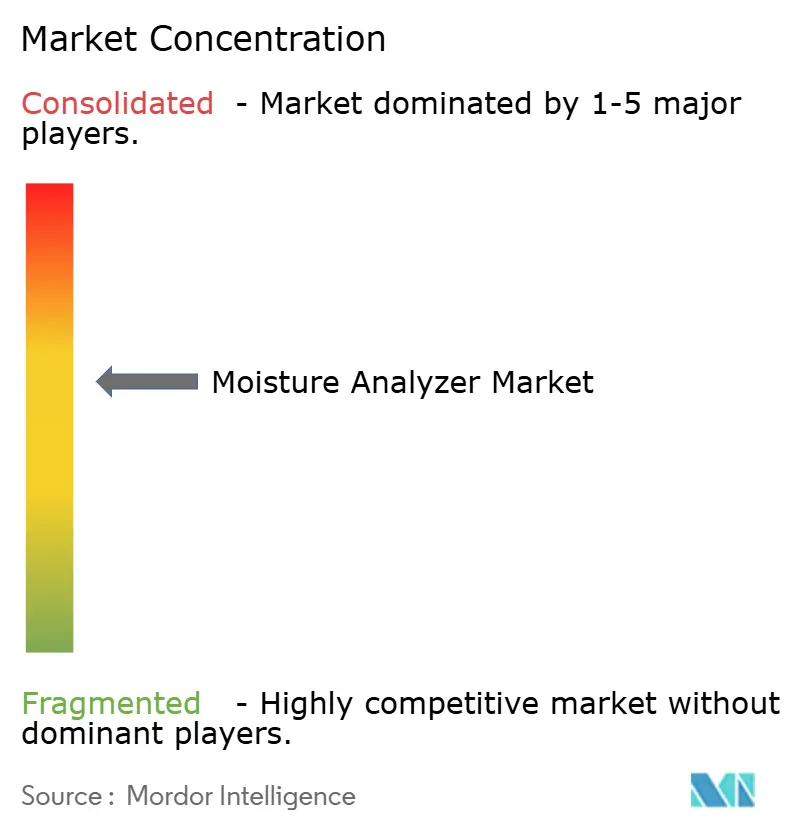
| Market Concentration | Medium |
Major Players
*Disclaimer: Major Players sorted in no particular order Image © Mordor Intelligence. Reuse requires attribution under CC BY 4.0. |
|
Moisture Analyzer Market Analysis by Mordor Intelligence
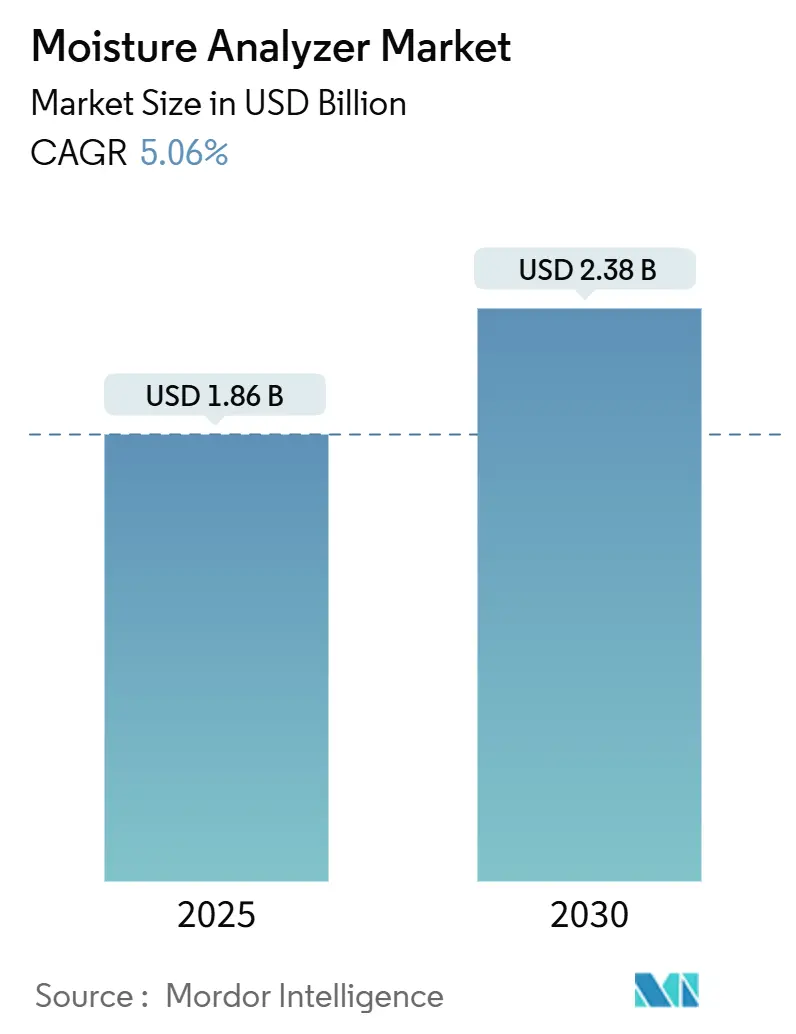
The moisture analyzer market size reached USD 1.86 billion in 2025 and is projected to advance to USD 2.38 billion by 2030, translating into a 5.06% CAGR. The moisture analyzer market continues to evolve as real-time, in-line systems displace laboratory batch testing, allowing manufacturers to embed moisture control directly into Industry 4.0 workstreams. Regulatory agencies heighten oversight of retained water disclosures and pharmaceutical moisture limits, pushing end users toward faster, more precise instruments. At the same time, lithium-ion battery production, cannabis potency verification, and cultivated-meat processing introduce new use cases that expand addressable demand. Competitive differentiation pivots from single-parameter accuracy toward integrated sensor networks that feed predictive-maintenance platforms, positioning vendors able to deliver cloud-ready devices for outsized growth.
Key Report Takeaways
- By analyzing technique, Loss-on-Drying led with 41.84% of the moisture analyzer market share in 2024, while Near-Infrared is forecast to grow at 6.18% CAGR through 2030.
- By equipment type, Benchtop instruments accounted for 59.32% of the moisture analyzer market size in 2024; in-line/on-line sensors are set to expand at a 6.74% CAGR to 2030.
- By end-use industry, food and beverage applications captured 34.71% revenue share in 2024; pharmaceuticals and biotechnology are advancing at a 5.89% CAGR over the same horizon.
- By component, complete instruments dominated with 71.29% of the moisture analyzer market size in 2024, while sensors and probes record the strongest CAGR at 7.12% through 2030.
- By geography, North America commanded 31.96% share of the moisture analyzer market in 2024, whereas Asia-Pacific registers the fastest regional CAGR of 5.67% to 2030.
Global Moisture Analyzer Market Trends and Insights
Drivers Impact Analysis*
| Driver | (~) % Impact on CAGR Forecast | Geographic Relevance | Impact Timeline |
|---|---|---|---|
| Stringent food-label moisture limits | +1.2% | Global, with strongest enforcement in North America and EU | Medium term (2-4 years) |
| Pharma compliance with USP <731> and <921> | +0.8% | Global, led by North America, expanding to Asia-Pacific | Long term (≥ 4 years) |
| Shift to in-line NIR for real-time QA | +1.5% | Asia-Pacific core, spill-over to North America and EU | Short term (≤ 2 years) |
| Battery-electrode slurry moisture optimization | +0.6% | Asia-Pacific manufacturing hubs, expanding globally | Medium term (2-4 years) |
| Industry 4.0 predictive-maintenance analytics adoption | +0.9% | Global, with early adoption in developed markets | Long term (≥ 4 years) |
| Cannabis potency assurance requirements | +0.3% | North America, expanding to legalized markets | Short term (≤ 2 years) |
| Source: Mordor Intelligence | |||
Stringent Food-Label Moisture Limits
Global regulators now enforce moisture declarations on food labels with greater vigor. The FDA’s updated retained-water guidance requires meat and poultry processors to submit revised protocols by March 2025 and adopt new labels by January 2026. Similar provisions in the EU tighten tolerances on declared moisture ranges, exposing non-compliant firms to recalls and fines. These mandates replace voluntary audits with obligatory, process-validated testing, causing processors to retire generic drying ovens in favor of halogen or NIR instruments certified under ISO 17025. The moisture analyzer market benefits as food companies upgrade entire lines to maintain continuous verification, allocate budget for redundant sensors, and engage calibration services to document traceability.
Pharma Compliance with USP <731> and <921>
The United States Pharmacopeia now expressly recognizes modern analyzers as acceptable alternatives to drying ovens, easing method validation burdens. Manufacturers capitalize by standardizing halogen platforms across global sites, cutting analysis cycles from hours to minutes while satisfying FDA and EMA inspections. Vendors embed firmware that automates temperature profiles aligned with Chapter <731>, lowering operator variability. Sartorius extends this approach to cannabis laboratories, where state rules cap flower moisture at 13%. The harmonized framework accelerates procurement decisions, enlarges the installed base of compliant devices, and elevates service revenues tied to annual performance-qualification contracts.
Shift to In-Line NIR for Real-Time QA
Near-infrared spectroscopy has matured into a production-critical tool. Sensors such as the NIR-7000 record readings every 4 milliseconds with ±0.1% accuracy. [1]KPM Analytics, “Online NIR Moisture Measurement for Industrial Applications,” kpmanalytics.comManufacturers integrate these data streams into distributed control systems, allowing automatic dryer adjustments that prevent batch deviations. Studies show spectral averaging cuts prediction error to 0.1%, calming earlier doubts about NIR under variable matrices. Adoption surged first in Asia-Pacific confectionery lines and then in North American cereal plants, where elimination of lab-hold times boosts throughput. Demand cascades down to component suppliers, notably photodiode arrays and tungsten-halogen sources, tightening parts supply and incentivizing multi-sourcing strategies.
Industry 4.0 Predictive-Maintenance Analytics Adoption
Moisture analyzers now serve as edge nodes for predictive analytics. Finna Sensors offers IoT-ready devices that feed cloud dashboards flagging dryer drift and filter fouling before stoppages occur. [2]Finna Sensors, “Industry 4.0: Internet of Things (IoT) for Moisture Sensors,” finnasensors.comConcrete plants exploit connected microwave probes to adjust water-cement ratios in real time, slicing energy costs and cement waste. Early adopters appreciate that moisture variation often precedes broader mechanical failures, so analytics suites correlate deviations with bearing temperature and vibration trends. This functionality recasts analyzers from cost centers into productivity assets, widening the buyer pool beyond QA departments to operations and maintenance budgets.
Restraints Impact Analysis*
| Restraint | (~) % Impact on CAGR Forecast | Geographic Relevance | Impact Timeline |
|---|---|---|---|
| High capex of NIR/halogen analyzers | -0.7% | Global, with strongest impact in emerging markets | Medium term (2-4 years) |
| Matrix-effect-driven accuracy issues | -0.4% | Global, particularly affecting NIR applications | Long term (≥ 4 years) |
| Shortage of high-temp halogen lamps | -0.3% | Global supply chain impact | Short term (≤ 2 years) |
| Evolving rules for cultivated-meat moisture testing | -0.2% | Developed markets with cultivated-meat production | Medium term (2-4 years) |
| Source: Mordor Intelligence | |||
High Capex of NIR/Halogen Analyzers
Advanced units often exceed USD 25,000, limiting uptake among small processors. Tariff surcharges on Chinese components add further cost layers; Thermo Fisher cited a USD 400 million revenue headwind tied to 60% duties before announcing a USD 2 billion domestic build-out. [3]Slabodkin G., “Thermo Fisher invests $2B in US manufacturing and R&D, works to offset impacts of tariffs,” pharmamanufacturing.com As budgets tighten, buyers substitute portable meters that trade precision for affordability. Vendors respond by introducing subscription models bundling hardware leasing with calibration services, but pricing remains a hurdle in value-sensitive markets across Latin America and Southeast Asia. Consequently, the moisture analyzer industry faces elongated sales cycles and heightened discounting.
Matrix-Effect Accuracy Issues
NIR performance still suffers when heterogeneous matrices scatter light unpredictably, forcing time-intensive calibrations. Classic studies on tuber nitrogen show moisture itself skews reflectance across all wavelengths, lowering prediction accuracy. Pharmaceutical blenders encounter similar challenges where excipient particle size shifts within a batch. Although chemometric models improve robustness, validation files grow complex and regulators scrutinize transferability between sites. These hurdles slow NIR penetration into high-risk applications like sterile injectables where failure costs are high, tempering the overall moisture analyzer market growth.
*Our forecasts treat driver/restraint impacts as directional, not additive. The impact forecasts reflect baseline growth, mix effects, and variable interactions.
Segment Analysis
By Analyzing Technique: Loss-on-Drying Dominance Faces NIR Disruption
Loss-on-Drying held 41.84% of the moisture analyzer market share in 2024 on the strength of its universal acceptance across regulated industries. The segment’s installed base remains sticky because operators trust gravimetric moisture values for release testing. Yet the moisture analyzer market size tied to Near-Infrared systems is rising quickly at 6.18% CAGR as factories migrate toward continuous feedback loops that Loss-on-Drying cannot support. Halogen units serve as a bridge technology, reducing cycle time to 10 minutes but still requiring discrete sampling. Emerging radio-frequency sensors deliver non-contact measurement in bulk solids such as grain, and microwave probes gain traction in explosive atmospheres after the 2025 launch of XT-EX sensors. Over the forecast window, pluralistic adoption patterns persist: Loss-on-Drying dominates final release testing; NIR governs in-process control; Karl Fischer retains niches needing water-specific titration; and capacitance remains popular for low-moisture plastics.
The competitive narrative shows incumbents racing to couple spectroscopy engines with machine-learning algorithms that auto-calibrate across product variants. Smart diagnostics alert users to reflectance anomalies, further mitigating matrix risks. Vendors also refine sample pans for halogen instruments, reducing heat gradients that once caused mass drift. Such innovations reaffirm the moisture analyzer market’s shift toward holistic platforms wherein technique choice aligns with line speed, regulatory scrutiny, and risk tolerance.


By Equipment Type: Benchtop Leadership Challenged by In-Line Innovation
Benchtop platforms captured 59.32% of the moisture analyzer market size in 2024 thanks to their cross-functional features and established standard operating procedures. Pharmaceutical quality units lean on these instruments for validated stability studies, and flavor houses use them to benchmark raw ingredients. Meanwhile, in-line and on-line sensors accelerate at 6.74% CAGR as food, battery, and mineral processors embed probes directly into hoppers and dryer ducts to enable closed-loop control. KPM’s MCT560 series generates up to 99 readings per second while withstanding wash-down regimes, illustrating why continuous monitoring can trump marginal improvements in absolute accuracy. Handheld meters, once relegated to building inspections, now incorporate Bluetooth and NFC to integrate seamlessly with manufacturing execution systems.
The trajectory suggests growing overlap: benchtop units increasingly arrive with OPC UA ports for data push to SCADA, while fixed sensors borrow calibration routines from laboratory units to reassure auditors. Vendors differentiate through modularity; interchangeable detector heads allow a single control unit to toggle between halogen, NIR, and microwave methods. This convergence supports a service-oriented model where subscription analytics augment hardware margins, reinforcing the moisture analyzer industry trend toward recurring revenue.
By End-Use Industry: Food Dominance Meets Pharmaceutical Uptick
Food and beverage producers represented 34.71% of 2024 revenue, cementing the segment as the anchor of the moisture analyzer market. Shelf-life optimization and nutrition labeling drive multiple test points from incoming flour to packaged snacks creating high unit throughput. The moisture analyzer market size attached to pharmaceuticals now expands at 5.89% CAGR as complex biologics and controlled substances require stringent water-activity limits. Battery manufacturers join the customer mix, relying on ppm-level moisture control to prevent electrode degradation during slurry coating processes. Plastics, chemicals, and petrochemicals exhibit steady demand due to raw-material hygroscopicity that alters downstream mechanical properties.
Agriculture and feed mills sustain volumes despite commodity price volatility, while pulp and paper mills deploy microwave sensors to automate dryer sections. Wastewater utilities adopt infrared analyzers to monitor sludge dewatering efficiency, reinforcing environmental compliance mandates. Across these verticals, purchasing criteria converge on traceability and network compatibility rather than measurement principle alone, a shift that enlarges suppliers’ addressable scope beyond traditional lab managers.

By Component: Instrument Sales Still Dominate but Sensors Outpace
Complete instruments generated 71.29% of moisture analyzer market revenue in 2024, a figure reflecting high average selling prices and bundled service contracts. Over the forecast, sensors and probes grow fastest at 7.12% CAGR as multi-point installations demand dozens of inexpensive nodes feeding a single control architecture. This dynamic echoes broader automation trends where value migrates from hardware to data services. AMETEK’s Electronic Instruments Group posted USD 1.76 billion Q4 2024 sales on strong sensor demand, underscoring the shift toward component-centric growth.
Consumables such as pans, filters, and standards provide annuity streams defended by proprietary geometries and calibration certificates. Vendors increasingly bundle consumable replenishment with remote diagnostic subscriptions, locking in customer loyalty. Consequently, the moisture analyzer industry balances a one-time capital model with escalating recurring revenues, cushioning earnings against economic cycles.
Geography Analysis
North America retained leadership with 31.96% of the moisture analyzer market in 2024. Stringent FDA and USDA rules particularly the 2025 retained-water protocol require real-time audits, stimulating upgrades across meat and poultry facilities. Pharmaceutical hubs in New Jersey and Ontario adopt validated halogen analyzers that synchronize with electronic batch records, while cannabis laboratories in Colorado expand capacity under state-mandated moisture ceilings. Tariff headwinds on imported components elevate domestic manufacturing initiatives; Thermo Fisher’s USD 2 billion plant expansion exemplifies efforts to localize supply chains and preserve lead times. As a mature region, replacement sales dominate, and buyers prioritize service responsiveness and cybersecurity certifications when selecting vendors.
Asia-Pacific is the growth engine, projected at 5.67% CAGR through 2030. Chinese lithium-ion battery factories procure in-line NIR arrays to prevent electrode swelling, while Indian pharma clusters around Hyderabad and Bengaluru scale QC labs ahead of new drug-product launches. Shimadzu’s USD 20 million factory in Karnataka, operational by 2027, demonstrates localized production aimed at servicing regional demand quickly. Southeast Asian snack producers embrace handheld meters for tapioca and rice flours, bridging infrastructural gaps until full automation budgets materialize. Government “Make-in-India” policies incentivize hospitals and food processors to procure domestically assembled analyzers, providing multinationals that localize operations with competitive tariff advantages.
Europe records steady mid-single-digit growth anchored by Germany’s process-automation culture and Ireland’s concentration of biologics manufacturing. The European Commission’s Farm-to-Fork strategy intensifies scrutiny of moisture content in plant-based foods, adding new instrument placements in alternative protein facilities. Brexit logistical adjustments prompt UK distributors to hold higher inventories of consumables to ensure uninterrupted compliance testing. Scandinavian pulp mills deploy microwave moisture loops to lower dryer energy loads, helping meet carbon-reduction targets. Across the continent, sustainability considerations drive preference for energy-efficient halogen heaters and recyclable consumable pans.


Competitive Landscape
The moisture analyzer industry presents moderate concentration. Market leaders Mettler-Toledo, Sartorius, and Thermo Fisher Scientific combine broad portfolios, global service networks, and compliance support to safeguard share. Mid-tier firms such as AMETEK and Shimadzu leverage acquisitions and localized production to close capability gaps. Niche players—including MoistTech, Citizen Scales, and Finna Sensors—address specialized use cases where agility and price outperform scale. Competitive levers revolve around connectivity, with OPC UA, MQTT, and Ethernet IP interfaces now standard across premium lines.
Technological differentiation centers on sensor miniaturization and harmonized multi-parameter modules; NIR heads incorporate temperature compensation to counter lamp drift, while microwave probes boast Explosion-Proof ratings. Investment in cloud software accelerates: subscription dashboards deliver predictive maintenance alerts that lower total cost of ownership. Vendors also emphasize sustainability, promoting PFAS-free membranes and low-wattage heaters to align with ESG targets. Price competition intensifies only in entry-level segments, where regional manufacturers undercut global brands by up to 30% but struggle to match documentation depth.
Supply chain resilience is an emerging battleground. Halogen bulb shortages during 2024 prompted dual-sourcing strategies, and semiconductor lead times push firms to redesign boards around readily available microcontrollers. Companies that pre-qualify alternate parts and maintain regional distribution hubs enhance customer confidence. As a result, buyers evaluate not only device accuracy but also vendor continuity plans, elevating incumbents that can demonstrate robust supply networks.
Moisture Analyzer Industry Leaders
-
Mettler-Toledo International Inc.
-
Sartorius AG
-
A&D Company, Limited
-
Shimadzu Corporation
-
Thermo Fisher Scientific Inc.
- *Disclaimer: Major Players sorted in no particular order

Recent Industry Developments
- July 2025: Sartorius Stedim Biotech reported 9.4% H1 sales growth to EUR 1.49 billion (USD 1.68 billion), supported by consumables demand and PFAS-free filters.
- April 2025: Thermo Fisher Scientific announced a USD 2 billion U.S. manufacturing and R&D plan to offset USD 400 million in tariff exposure while reporting USD 10.36 billion Q1 revenue.
- February 2025: AMETEK posted record Q4 2024 sales of USD 1.76 billion, with 11% growth in the Electromechanical Group, highlighting sustained sensor momentum.
- January 2025: Shimadzu Corporation confirmed a USD 20 million analytical-instrument factory in Karnataka, India, set for 2027 operations to serve rising Asian demand.


Global Moisture Analyzer Market Report Scope
| Loss-on-Drying |
| Near-Infrared |
| Karl Fischer Titration |
| Capacitance |
| Microwave |
| Radio Frequency |
| Benchtop |
| Handheld / Portable |
| In-line / On-line Sensors |
| Food and Beverage |
| Pharmaceuticals and Biotechnology |
| Chemicals and Petrochemicals |
| Plastics and Polymers |
| Agriculture and Feed |
| Pulp and Paper |
| Environmental and Wastewater |
| Other End-use Industries |
| Moisture Analyzer Instrument |
| Sensors and Probes |
| Consumables (Pans, Filters) |
| North America | United States | |
| Canada | ||
| Mexico | ||
| South America | Brazil | |
| Argentina | ||
| Rest of South America | ||
| Europe | Germany | |
| United Kingdom | ||
| France | ||
| Russia | ||
| Rest of Europe | ||
| Asia-Pacific | China | |
| Japan | ||
| India | ||
| South Korea | ||
| Australia | ||
| Rest of Asia-Pacific | ||
| Middle East and Africa | Middle East | Saudi Arabia |
| United Arab Emirates | ||
| Rest of Middle East | ||
| Africa | South Africa | |
| Egypt | ||
| Rest of Africa | ||
| By Analyzing Technique | Loss-on-Drying | ||
| Near-Infrared | |||
| Karl Fischer Titration | |||
| Capacitance | |||
| Microwave | |||
| Radio Frequency | |||
| By Equipment Type | Benchtop | ||
| Handheld / Portable | |||
| In-line / On-line Sensors | |||
| By End-use Industry | Food and Beverage | ||
| Pharmaceuticals and Biotechnology | |||
| Chemicals and Petrochemicals | |||
| Plastics and Polymers | |||
| Agriculture and Feed | |||
| Pulp and Paper | |||
| Environmental and Wastewater | |||
| Other End-use Industries | |||
| By Component | Moisture Analyzer Instrument | ||
| Sensors and Probes | |||
| Consumables (Pans, Filters) | |||
| By Geography | North America | United States | |
| Canada | |||
| Mexico | |||
| South America | Brazil | ||
| Argentina | |||
| Rest of South America | |||
| Europe | Germany | ||
| United Kingdom | |||
| France | |||
| Russia | |||
| Rest of Europe | |||
| Asia-Pacific | China | ||
| Japan | |||
| India | |||
| South Korea | |||
| Australia | |||
| Rest of Asia-Pacific | |||
| Middle East and Africa | Middle East | Saudi Arabia | |
| United Arab Emirates | |||
| Rest of Middle East | |||
| Africa | South Africa | ||
| Egypt | |||
| Rest of Africa | |||


Key Questions Answered in the Report
What is the forecast growth rate for moisture analyzers through 2030?
The sector is projected to register a 5.06% CAGR, carrying revenue from USD 1.86 billion in 2025 to USD 2.38 billion by 2030.
Which measurement technique is expanding the fastest?
Near-Infrared systems lead growth at a 6.18% CAGR because they deliver millisecond-level feedback suitable for Industry 4.0 control loops.
How do capital costs affect adoption?
Advanced halogen and NIR units can exceed USD 25,000, discouraging smaller firms and emerging-market buyers and slowing overall penetration.
Which region will add the most new installations?
Asia-Pacific is expected to contribute the largest incremental volume, rising at 5.67% CAGR as manufacturing and quality standards advance.
Why are sensors and probes outpacing instruments?
Multi-point monitoring strategies require numerous low-cost nodes, so sensor unit shipments rise faster even though instruments still dominate revenue.
What role does regulation play in equipment purchases?
Compliance with FDA, USDA, and USP rules drives mandatory testing, prompting manufacturers to favor validated platforms with audit-ready data logs.
Page last updated on:


