Weather Monitoring Solutions And Services Market Size and Share
Market Overview
| Study Period | 2020 - 2031 |
|---|---|
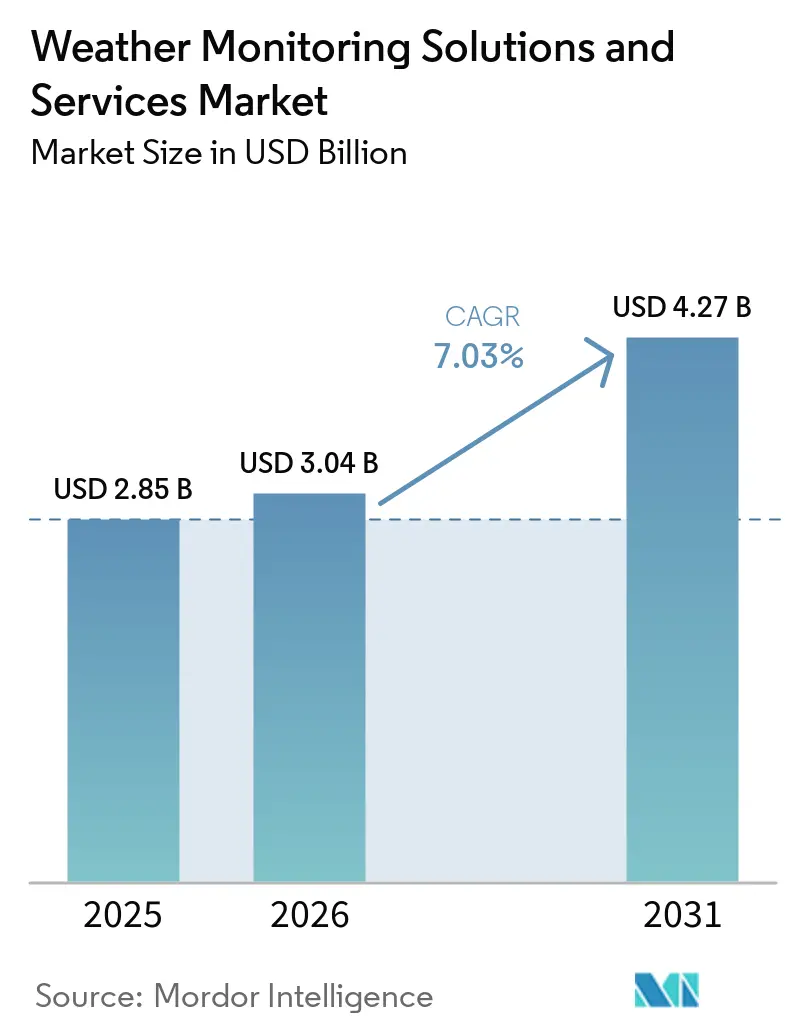
| Market Size (2026) | USD 3.04 Billion |
| Market Size (2031) | USD 4.27 Billion |
| Growth Rate (2026 - 2031) | 7.03% CAGR |
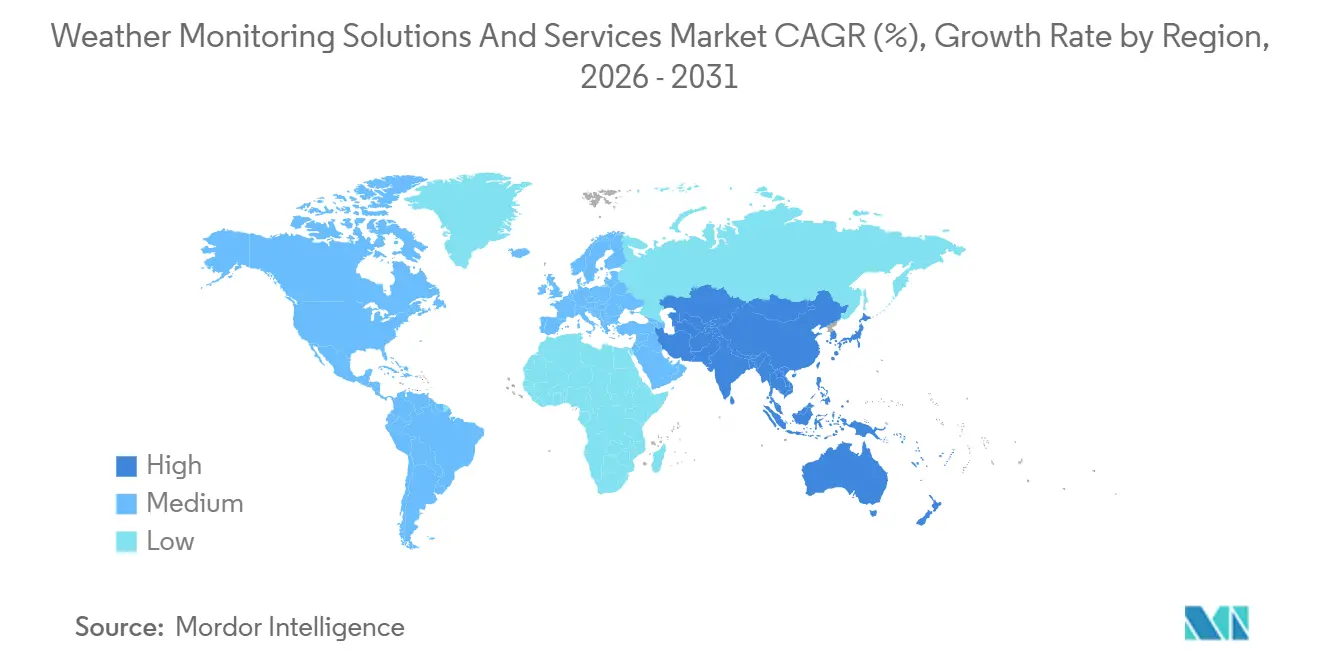
| Fastest Growing Market | Asia Pacific |
| Largest Market | North America |
| Market Concentration | Low |
Major Players *Disclaimer: Major Players sorted in no particular order Image © Mordor Intelligence. Reuse requires attribution under CC BY 4.0. | |
Weather Monitoring Solutions And Services Market Analysis by Mordor Intelligence
The weather monitoring solutions and services market size was valued at USD 2.85 billion in 2025 and is estimated to grow from USD 3.04 billion in 2026 to reach USD 4.27 billion by 2031, at a CAGR of 7.03% during the forecast period (2026-2031). Grid operators, insurers, and growers now expect sub-kilometer, minute-level forecasts, pushing vendors to combine satellite, radar, drone, and IoT inputs in one decision engine. Governments are funding national radar retrofits and automatic-station rollouts, while private firms shift from one-time hardware buying to subscription analytics that turn raw weather data into operational guidance. Sensor makers answer bandwidth and power constraints with edge-computing firmware, and software entrants monetize open-data rules by selling API access to hyperlocal nowcasts. Together, these trends reinforce steady demand for integrated platforms, ensuring that the weather monitoring solutions and services market remains on a durable growth path.
Key Report Takeaways
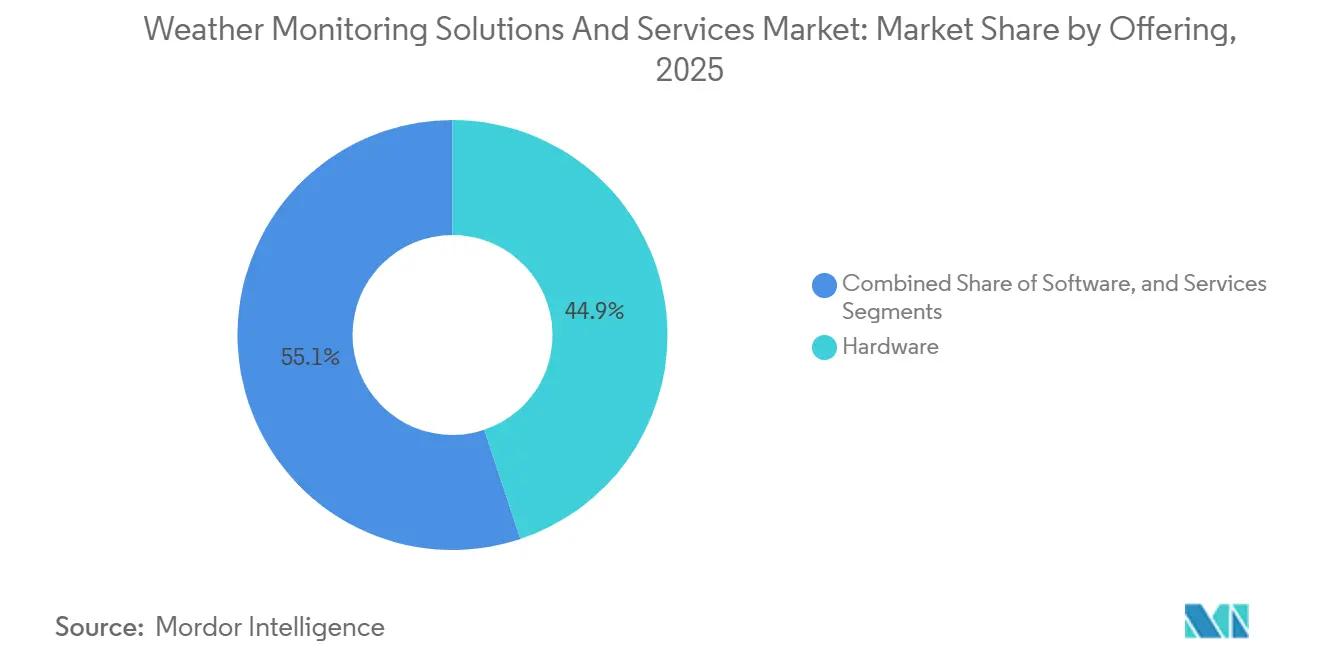
- By offering, hardware led with 44.87% of the weather monitoring solutions and services market share in 2025, while services are projected to expand at an 8.11% CAGR through 2031.
- By system type, satellite-based systems accounted for 34.25% share in 2025, and weather drones/unmanned systems are advancing at a 7.89% CAGR across the forecast period.
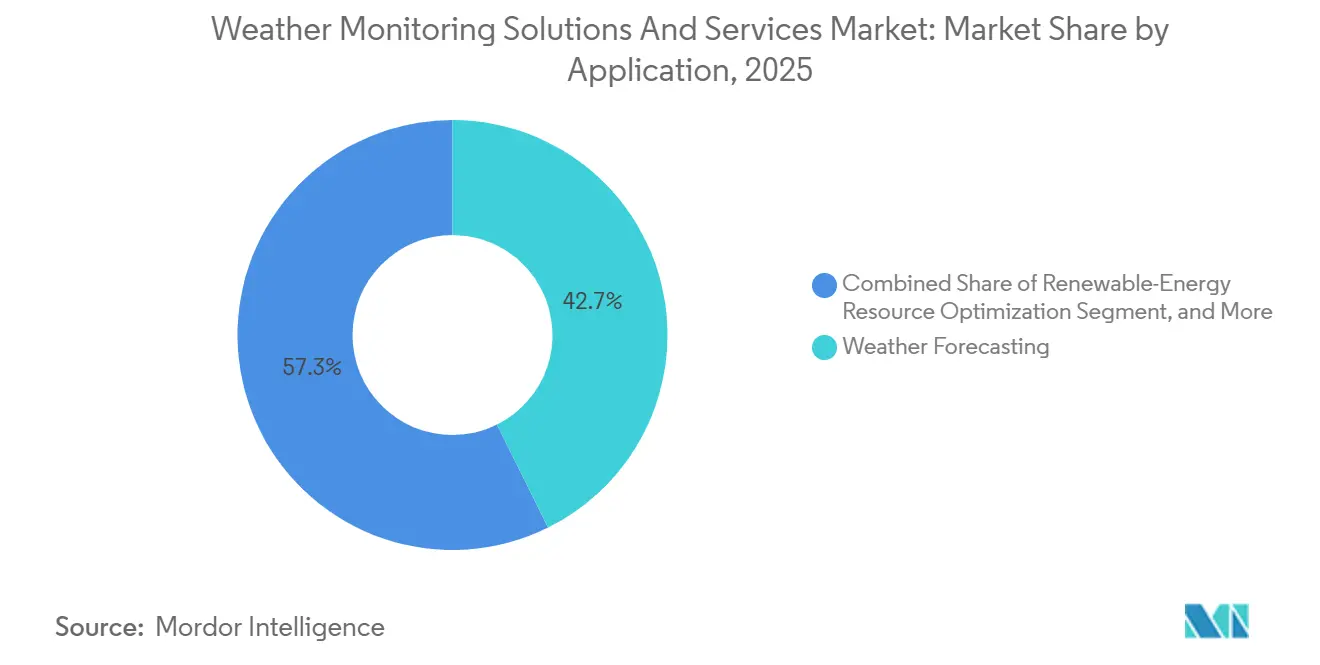
- By application, weather forecasting captured 42.67% revenue in 2025, whereas disaster and public-safety management is set to grow at a 7.61% CAGR to 2031.
- By end-user industry, energy and utilities held 27.56% spending in 2025, and agriculture is expected to post a 7.53% CAGR during 2026-2031.
- By geography, North America contributed 36.67% of global revenue in 2025, with Asia-Pacific anticipated to register the fastest regional CAGR at 7.78% through 2031.
Note: Market size and forecast figures in this report are generated using Mordor Intelligence’s proprietary estimation framework, updated with the latest available data and insights as of January 2026.
Global Weather Monitoring Solutions And Services Market Trends and Insights
Drivers Impact Analysis*
| Driver | (~) % Impact on CAGR Forecast | Geographic Relevance | Impact Timeline |
|---|---|---|---|
| Renewable-Energy Demand for Accurate Resource Assessment | +1.4% | North America, Europe, China, India | Medium term (2-4 years) |
| Climate-Change-Driven Rise in Extreme Weather Events | +1.3% | Asia-Pacific coastal zones, North America hurricane corridors, European flood plains | Long term (≥4 years) |
| Adoption of Precision Agriculture and Smart Farming | +1.2% | North America, Europe, Asia-Pacific, South America | Medium term (2-4 years) |
| Expanding Deployment of IoT-Enabled Sensor Networks | +1.1% | Asia-Pacific, Africa, global rollouts | Short term (≤2 years) |
| Government Mandates for Aviation and Maritime Safety Compliance | +0.9% | Global | Medium term (2-4 years) |
| Emergence of Low-Earth-Orbit Nanosatellite Constellations | +0.8% | United States, Europe, China | Long term (≥4 years) |
| Source: Mordor Intelligence | |||
Renewable-Energy Demand for Accurate Resource Assessment
Utilities and project developers now require 1-kilometer, 15-minute forecasts to balance grids with high wind and solar penetration. The European Center for Medium-Range Weather Forecasts introduced an AI forecasting system that delivers 10-day global predictions in under 60 seconds, letting operators run fast ensemble scenarios. Vaisala’s Compass platform fuses satellite imagery, drone profiles, and ground sensors to craft site-specific irradiance curves that raise asset utilization. Floating lidar and weather drones deployed in the North Sea reduce turbine-wake modeling error by 15%, cutting maintenance budgets for offshore arrays. As more jurisdictions legislate net-zero targets, investors are treating granular weather intelligence as essential project infrastructure rather than optional insurance.
Climate-Change-Driven Rise in Extreme Weather Events
Insured losses from floods, hurricanes, and wildfires surpassed USD 100 billion in 2024, hardening reinsurance requirements for hyperlocal peril models.[1]Munich Re Analytics, “Natural Catastrophe Losses 2024,” munichre.com The European Union directs EUR 70 billion (USD 77 billion) annually to adaptation infrastructure, funding dense rain-gauge grids and X-band radars for alpine flash-flood defense.[2]European Commission DG CLIMA, “Adaptation Funding 2026 Budget,” ec.europa.eu NOAA’s dual-polarization radar retrofit improves hail-size estimates that underpin municipal evacuation triggers. Japan embeds sensors in stormwater tunnels to automate floodgate closures, shifting from reactive to anticipatory control. The frequency of billion-dollar disasters keeps doubling, yet warning lead times remain stuck at 13 minutes, spotlighting the need for phased-array radar and machine-learning nowcasting.
Adoption of Precision Agriculture and Smart Farming
Variable-rate irrigation, frost prediction, and pest models depend on micro-climate data absent from legacy extension services. Pessl Instruments’ iMetos network lets vineyards time fungicide spraying within 6-hour windows, trimming chemical use by 30%. Davis Instruments couples chill-hour analytics to raise nut-crop yields by up to 15% across Australia and Arizona. India’s Mausam 2.0 installs 1,800 automatic stations that push SMS advisories to smallholders, illustrating how public investment unlocks private subscription demand. Where water, labor, and input costs converge, growers budget weather data alongside seed and fertilizer.
Expanding Deployment of IoT-Enabled Sensor Networks
LoRaWAN nodes costing under USD 200 transmit 10-kilometer signals, bypassing cellular dead zones. Maine’s Mesonet added 45 such stations in 2024, sharpening snowfall forecasts for highway agencies. New York State’s 126-station grid feeds lightning and soil-moisture data to emergency dashboards. Kyrgyzstan’s alpine pilot inspired WMO rollouts across Central Asia under Early Warnings for All. Vietnam’s 50-station Mekong Delta array blends salinity and water-level sensing to fine-tune rice planting. Lower marginal costs democratize observations, lifting baseline forecast skill in data-sparse regions.
Restraints Impact Analysis*
| Restraint | (~) % Impact on CAGR Forecast | Geographic Relevance | Impact Timeline |
|---|---|---|---|
| High Capital Costs for Advanced Radar and Satellite Payloads | -0.9% | Africa, South Asia, Central America | Medium term (2-4 years) |
| Proprietary Data Silos and Sharing Restrictions | -0.6% | Middle East, parts of Asia | Long term (≥4 years) |
| Lack of Certified Calibration Labs in Emerging Markets | -0.4% | Africa, South Asia, Central Asia, Pacific Islands | Long term (≥4 years) |
| Lithium Supply Tightness for Remote-Sensor Batteries | -0.3% | Global | Short term (≤2 years) |
| Source: Mordor Intelligence | |||
High Capital Costs for Advanced Radar and Satellite Payloads
S-band dual-polarization radars sell for USD 1 million to USD 5 million per unit, excluding site and power costs that add 15% across the lifecycle.[3]NOAA Procurement Office, “Cost Profile of Dual-Polarization Radar Upgrades,” noaa.gov Satellite imagers climb to USD 200 million, dwarfing meteorological budgets in 80% of WMO member states. Spain spent EUR 25 million (USD 27.5 million) on 18 new radars, consuming 40% of its 2024 capital plan. Phased-array prototypes priced at USD 15 million, limiting deployment to the U.S. and Japan research fields. Emerging economies accept coarser coverage from USD 5,000 automatic stations, sacrificing warning lead time for affordability.
Proprietary Data Silos and Sharing Restrictions
Many private providers bar redistribution of radar or satellite feeds, forcing buyers to purchase overlapping datasets. WMO Resolution 40 promotes free exchange, yet enforcement remains voluntary, and several states label radar data as sensitive.[4]WMO Secretariat, “Resolution 40 Data-Exchange Guidelines,” wmo.int Offshore energy firms collect high-resolution marine observations but rarely share them, degrading coastal forecast accuracy. Copernicus mandates open Sentinel imagery and has seeded 5,000 downstream apps, but no such framework exists across much of the Asia-Pacific. Integrators must write custom parsers for disparate IoT protocols, lifting software costs by 25% and slowing project rollout.
*Our forecasts treat driver/restraint impacts as directional, not additive. The impact forecasts reflect baseline growth, mix effects, and variable interactions.
Segment Analysis
By Offering: Services Gain Momentum as Subscriptions Scale
The services segment is expanding at an 8.11% CAGR during the forecast period, outstripping hardware’s 44.87% revenue share in 2025. Renewables traders, airlines, and municipalities prefer outcome-based contracts that bundle ingestion, quality control, and analytics, converting capex to opex in the weather monitoring solutions and services market. Baron Services launched a white-label API in 2025 that lets logistics firms embed alerts without hiring meteorologists. Meteomatics’ USD 22 million Series C backs drone profiling sold under annual licenses. Hardware sales still anchor government procurements such as India’s 1,800-station rollout, but 10-year replacement cycles cap growth. The services tilt lifts vendor margins to 25%, double those of sensor hardware, reinforcing the pivot toward recurring revenue.
Second-generation platforms illustrate hybrid economics. Vaisala bundles sensor packages with its Compass cloud engine, delivering bias-corrected wind curves that shave curtailment penalties. Campbell Scientific’s WeatherBrain turns datalogger fleets into variable-rate irrigation maps that agronomists access through software seats. As the installed base expands, customer lock-in rises, and switching costs protect subscriptions, sustaining long-run cash flows within the weather monitoring solutions and services market.


By System Type: Drones Bridge the Vertical Gap
Satellite platforms owned 34.25% share in 2025, supplying continental imagery but limited vertical detail. Weather drones grow at 7.89% as they profile the 0-5 kilometer layer where severe convection forms. Meteomatics operates 30 Meteodrones across Norway, cutting valley forecast error by 20%. Black Swift aircraft entered Hurricane Idalia’s eyewall in 2024, shrinking landfall uncertainty by 20 kilometers. Ground stations remain critical yet miss complex terrain signals that drones capture on demand.
Radars upgrade to dual-polarization, distinguishing rain from hail, while phased-array prototypes scan every 30 seconds, but USD 15 million tags stall commercialization. WMO drives low-cost LoRaWAN station growth across Africa, yet a lack of calibration labs undermines data quality. Integrated fleets that mix radar, drone, and satellite streams underpin the weather monitoring solutions and services market size for multi-hazard early warning, strengthening resilience agendas.
By Application: Disaster Management Accelerates on Early-Warning Policies
Weather forecasting held 42.67% revenue in 2025, serving aviation and broadcast clients. Disaster and public-safety management outpaces at 7.61% CAGR, lifted by the WMO Early Warnings for All program’s USD 3.1 billion funding. Greece commissioned seven radars and 12 lightning sensors in 2025 to extend flash-flood lead times to 30 minutes. Insurance underwriters now discount premiums where municipalities run verifiable alert systems, boosting platform uptake.
Climate monitoring and renewable optimization add steady demand. Transport Infrastructure Ireland ordered 136 road-weather stations in 2025, targeting 20% de-icing chemical savings. Marine operators leverage wave forecasts to avoid USD 500,000 daily charter penalties. As extreme events intensify, governments embed alert performance metrics into procurement, anchoring disaster-management spending inside the broader weather monitoring solutions and services market size.
By End-User Industry: Agriculture Shows Fastest Upside
Energy and utilities spent 27.56% in 2025, using lightning data to protect grids. Agriculture grows fastest at 7.53% CAGR, driven by micro-climate needs of high-value orchards and vineyards. iMetos and EnviroMonitor stations quantify chill hours and evapotranspiration, letting growers cut inputs and lift yields. In India, district-level advisories from Mausam 2.0 reach smallholders via SMS, turning public sensors into private decision tools. Aviation retains steady demand through ICAO Annex 3 compliance for runway visual range and wind shear.
While niches in marine, logistics, and media sectors capitalize on API access and premium applications, their success in user retention leans more on interface quality than mere data accuracy. The growing integration of weather data with predictive analytics tools is further driving innovation in these sectors. Additionally, advancements in AI-driven analytics are enhancing the usability of weather data, making it more actionable for businesses. A cross-industry convergence around IoT sensors and edge analytics is embedding weather insights into daily operations, significantly expanding the market share for weather monitoring solutions and services.
Geography Analysis
North America generated 36.67% of 2025 revenue, anchored by FAA NextGen upgrades that replace 1980s sensor arrays with networked devices reporting icing and turbulence in real time. NOAA finished its 160-site radar dual-polarization retrofit in 2024, feeding county-level alert systems that cut tornado false alarms. Solar operators in Texas and California hedge curtailment risk through probabilistic irradiance feeds, translating forecast skill into avoided penalties. Canada expanded WeatherBrain nationwide by 2025, monetizing soil-moisture telemetry for variable-rate irrigation maps.
Asia-Pacific records the fastest 7.78% CAGR. India’s USD 2 billion Mausam 2.0 added Doppler units in Leh and Prayagraj in 2025 on a path to 60 radars and 1,800 stations by 2030. China runs 2,400 stations and 236 radars that support its South China Sea offshore wind push. Japan’s Himawari-9 satellite provides 10-minute imagery for typhoon tracking, and Himawari-10 launches in 2029 with better volcanic-ash detection. Korea’s GEO-KOMPSAT-2A adds 2-kilometer air-quality frames for Seoul smog advisories. ASEAN’s multi-hazard network shares radar data across borders, improving monsoon flood warnings.
Europe channels EUR 70 billion (USD 77 billion) annually into resilience works, upgrading dual-polarization radar fleets, and funding nanosatellite payloads. Spain replaced legacy radars under a EUR 25 million contract in 2024, while Greece deployed new sensors for wildfire alerts in 2025. The Middle East invests in radar coverage and AI cloud-seeding forecasts. South America modernizes under WMO technical aid but faces calibration-lab shortages that slow sensor certification. Africa holds the widest gaps; Early Warnings for All targets full population coverage by 2027 through low-cost LoRaWAN nodes and community sirens. Together, regional programs maintain broad engagement, ensuring the weather monitoring solutions and services market continues to diversify geographically.

Competitive Landscape
The weather monitoring solutions and services market remains moderately fragmented. Vaisala, Campbell Scientific, and OTT Hydromet defend hardware margins, while SaaS entrants monetize recurring APIs. Vaisala’s April 2026 AWS830 Maritime Station uses edge firmware that sends only anomaly flags, trimming satellite bandwidth by 40%. Baron Services’ Rapid Analysis platform reduces severe-weather false alarms by 25%, winning emergency-management contracts. Meteomatics’ drone profiling sells under annual licenses that deliver 1-kilometer forecasts to renewable traders.
Regional integrators bundle USD 200 LoRaWAN nodes with cloud analytics, undercutting USD 10,000 legacy telemetry. Tomorrow.io’s DeepSky nanosat constellation promises hourly 1-kilometer precipitation estimates, challenging geostationary incumbents. Phased-array radar could double tornado lead times, but needs the cost to fall below USD 8 million to exit testbeds. Compliance with WMO data-exchange and ISO calibration norms now factors into bids, influencing supplier shortlists.
Partnerships bridge capability gaps. Sensor makers embed AI models licensed from SaaS firms, while satellite operators downlink into public clouds for open-data credit. Edge-computing designs lower power draws and enable offshore assets to self-validate, expanding addressable use cases. The pace of funding shows sustained investor confidence, supporting continued innovation in the weather monitoring solutions and services industry.
Weather Monitoring Solutions And Services Industry Leaders
Vaisala Oyj
Campbell Scientific Inc.
OTT Hydromet GmbH
Gill Instruments Limited
ADB SAFEGATE
- *Disclaimer: Major Players sorted in no particular order


Recent Industry Developments
- April 2026: Vaisala launched the AWS830 Maritime Weather Station, a cybersecure modular platform for offshore wind and oil assets, cutting satellite-bandwidth costs by 40% compared with legacy systems.
- April 2026: Airmar Technology introduced the 300WX WeatherStation Instrument for small-vessel marine users.
- February 2026: Gill Instruments rolled out the TruMet PW100 optical rain gauge, using laser scattering to distinguish rain from snow and hail.
- January 2026: OTT Hydromet secured a USD 2.7 million USGS contract for hydrological monitoring equipment.


Global Weather Monitoring Solutions And Services Market Report Scope
The Weather Monitoring Solutions and Services Market Report is Segmented by Offering (Hardware, Software, Services), System Type (Ground-based Stations, Satellite-based Systems, Weather Radar, Weather Drones/Unmanned Systems), Application (Weather Forecasting, Climate and Environmental Monitoring, Disaster and Public-Safety Management, Renewable-Energy Resource Optimization), End-user Industry (Agriculture, Energy and Utilities, Aviation and Airports, Marine and Offshore, Transportation and Logistics, Government and Defense, Media and Consumer Services), and Geography (North America, South America, Europe, Asia-Pacific, Middle East and Africa). Market Forecasts are Provided in Terms of Value (USD).
| Hardware |
| Software |
| Services |
| Ground-based Stations |
| Satellite-based Systems |
| Weather Radar |
| Weather Drones/Unmanned Systems |
| Weather Forecasting |
| Climate and Environmental Monitoring |
| Disaster and Public-Safety Management |
| Renewable-Energy Resource Optimization |
| Agriculture |
| Energy and Utilities |
| Aviation and Airports |
| Marine and Offshore |
| Transportation and Logistics |
| Government and Defense |
| Media and Consumer Services |
| North America | United States | |
| Canada | ||
| Mexico | ||
| South America | Brazil | |
| Argentina | ||
| Rest of South America | ||
| Europe | Germany | |
| United Kingdom | ||
| France | ||
| Italy | ||
| Spain | ||
| Rest of Europe | ||
| Asia-Pacific | China | |
| Japan | ||
| India | ||
| South Korea | ||
| ASEAN | ||
| Rest of Asia-Pacific | ||
| Middle East and Africa | Middle East | Saudi Arabia |
| United Arab Emirates | ||
| Turkey | ||
| Rest of the Middle East | ||
| Africa | South Africa | |
| Nigeria | ||
| Rest of Africa | ||
| By Offering | Hardware | ||
| Software | |||
| Services | |||
| By System Type | Ground-based Stations | ||
| Satellite-based Systems | |||
| Weather Radar | |||
| Weather Drones/Unmanned Systems | |||
| By Application | Weather Forecasting | ||
| Climate and Environmental Monitoring | |||
| Disaster and Public-Safety Management | |||
| Renewable-Energy Resource Optimization | |||
| By End-user Industry | Agriculture | ||
| Energy and Utilities | |||
| Aviation and Airports | |||
| Marine and Offshore | |||
| Transportation and Logistics | |||
| Government and Defense | |||
| Media and Consumer Services | |||
| By Geography | North America | United States | |
| Canada | |||
| Mexico | |||
| South America | Brazil | ||
| Argentina | |||
| Rest of South America | |||
| Europe | Germany | ||
| United Kingdom | |||
| France | |||
| Italy | |||
| Spain | |||
| Rest of Europe | |||
| Asia-Pacific | China | ||
| Japan | |||
| India | |||
| South Korea | |||
| ASEAN | |||
| Rest of Asia-Pacific | |||
| Middle East and Africa | Middle East | Saudi Arabia | |
| United Arab Emirates | |||
| Turkey | |||
| Rest of the Middle East | |||
| Africa | South Africa | ||
| Nigeria | |||
| Rest of Africa | |||


Key Questions Answered in the Report
How large will the weather monitoring solutions and services market be by 2031?
The weather monitoring solutions and services market size is forecast to reach USD 4.27 billion by 2031, expanding at a 7.03% CAGR from 2026 to 2031.
Which segment is growing fastest within the market?
Services lead growth, rising at an 8.11% CAGR as users favor subscription analytics over one-time sensor purchases.
Why are weather drones attracting investment?
Drones fill vertical-profile gaps between ground stations and satellites, improving severe-storm and energy-asset forecasts and growing at a 7.89% CAGR.
Which region is expected to post the highest growth?
Asia-Pacific is projected to record the fastest 7.78% CAGR, driven by large-scale government modernization programs such as India’s Mausam 2.0.
What restraints could slow market growth?
High radar and satellite capital costs and proprietary data silos could trim the forecast CAGR by a combined 1.5 percentage points.
How is edge computing changing weather hardware?
New sensor platforms process data locally and transmit only anomaly flags, lowering bandwidth costs and improving cyber resilience.
Page last updated on:


