
Gas Analyzer Market Size and Share
Market Overview
| Study Period | 2020 - 2031 |
|---|---|
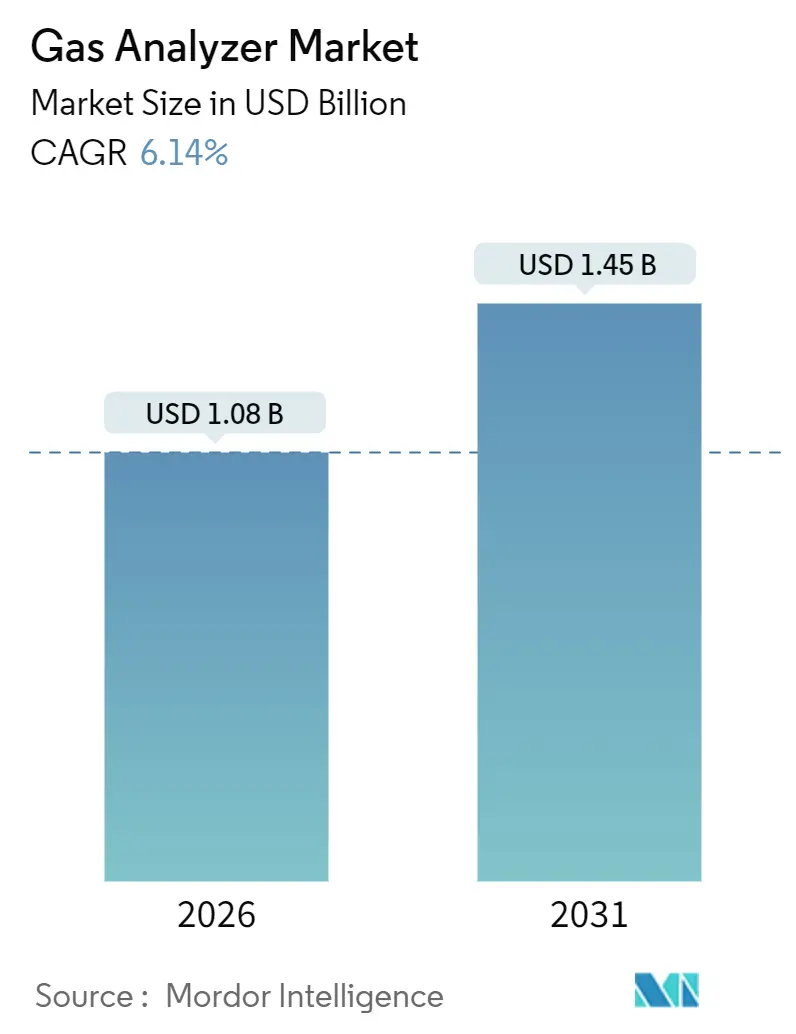
| Market Size (2026) | USD 1.08 Billion |
| Market Size (2031) | USD 1.45 Billion |
| Growth Rate (2026 - 2031) | 6.14 % |
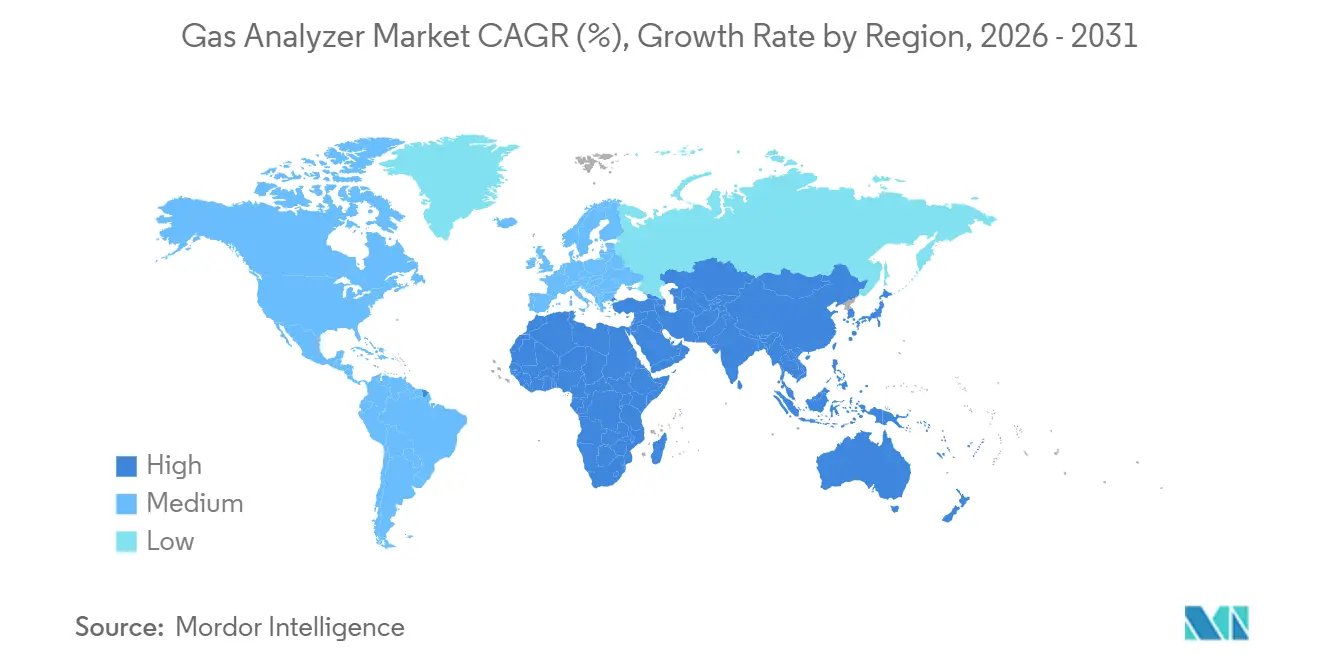
| Fastest Growing Market | Asia Pacific |
| Largest Market | North America |
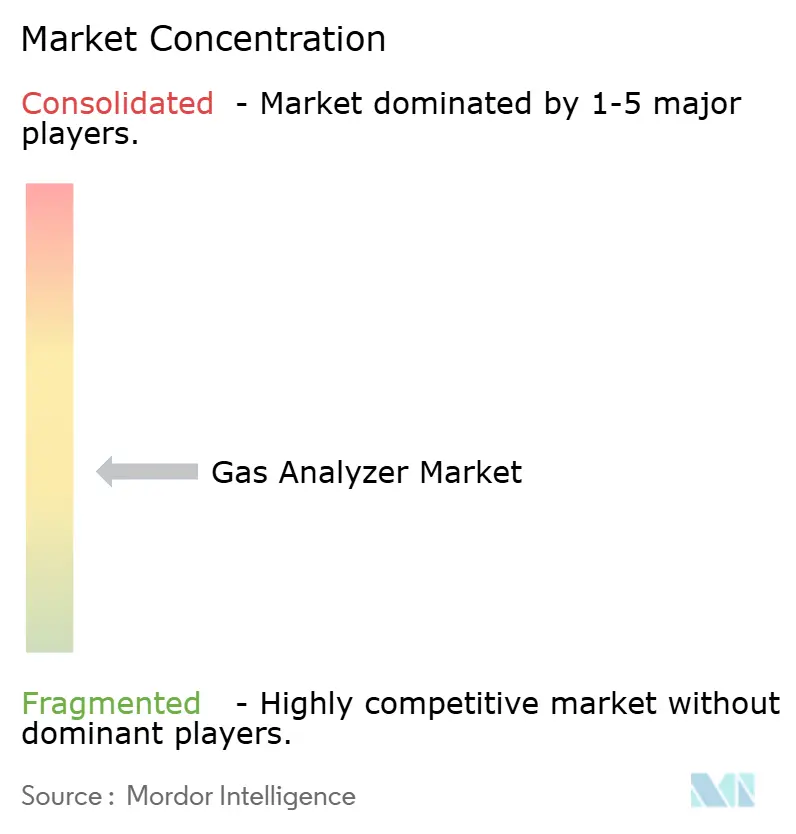
| Market Concentration | Medium |
Major Players *Disclaimer: Major Players sorted in no particular order Image © Mordor Intelligence. Reuse requires attribution under CC BY 4.0. | |
Gas Analyzer Market Analysis by Mordor Intelligence
The gas analyzer market size is USD 1.08 billion in 2026 and is projected to reach USD 1.45 billion in 2031, reflecting a 6.14% CAGR. Continuous, data-rich monitoring has displaced periodic spot checks as regulators in the United States, European Union, and China now require hour-level or even minute-level emissions visibility. Fixed analyzers dominate today’s installed base, but portable, multi-gas instruments are advancing quickly as petrochemical turnarounds, confined-space protocols, and third-party audits demand lightweight, intrinsically safe devices. Tunable diode laser absorption spectroscopy (TDLAS) is eroding non-dispersive infrared’s (NDIR) lead because operators value in-situ measurement, zero drift, and moisture tolerance, especially for ammonia slip and moisture-laden flue gas. Demand is strongest in oil and gas, but pharmaceutical manufacturing now outpaces all other verticals thanks to real-time release testing and continuous bioprocessing rules from the U.S. Food and Drug Administration. Regionally, North America still holds the largest gas analyzer market share, yet Asia Pacific delivers the fastest growth as India, Vietnam, and Indonesia commission coal and cement assets that carry mandatory stack-gas monitoring requirements.
Key Report Takeaways
- By product type, fixed analyzers held 65.18% of the gas analyzer market share in 2025, while portable units are forecast to record a 7.20% CAGR through 2031.
- By technology, NDIR led with 38.29% share of the gas analyzer market size in 2025; TDLAS is projected to expand at a 7.10% CAGR between 2026 and 2031.
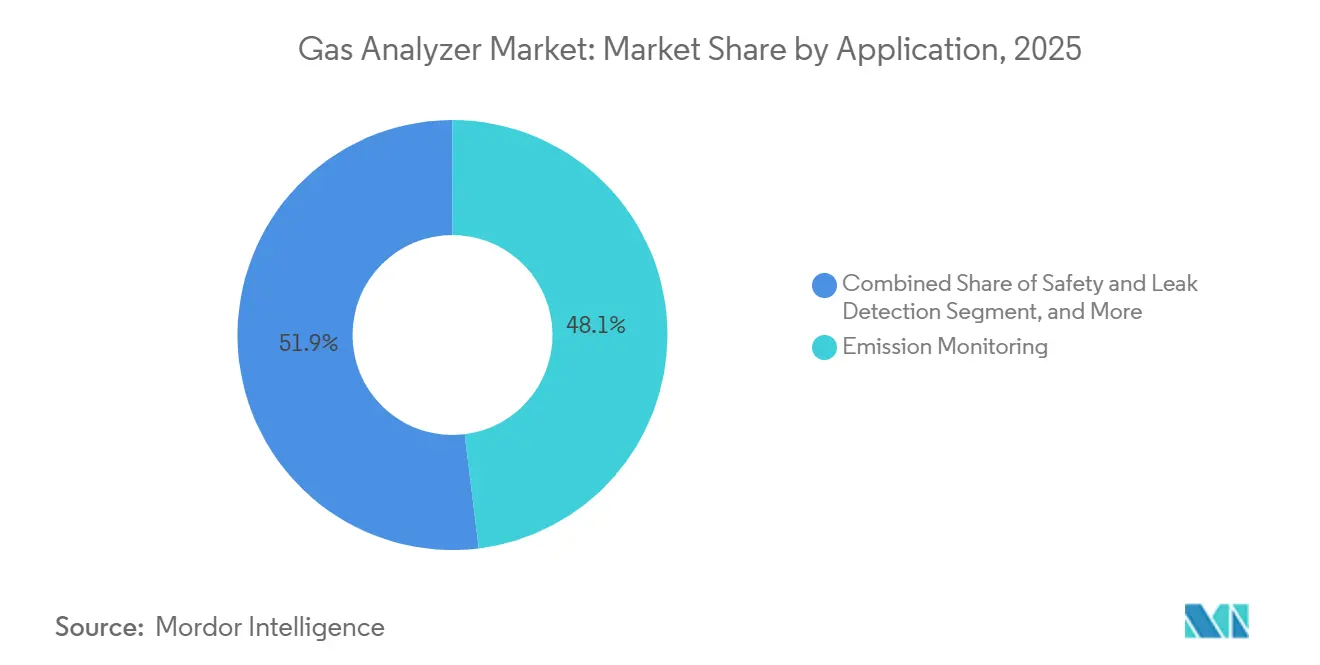
- By application, emission monitoring accounted for 48.06% of the gas analyzer market size in 2025, whereas safety and leak detection is growing quickest at 6.86% CAGR to 2031.
- By end-user, oil and gas commanded 34.48% of the gas analyzer market share in 2025, but pharmaceutical manufacturing shows the highest 6.99% CAGR outlook.
- By geography, North America captured 32.03% of revenue in 2025; Asia Pacific is projected to post the fastest 6.40% CAGR through 2031.
Note: Market size and forecast figures in this report are generated using Mordor Intelligence’s proprietary estimation framework, updated with the latest available data and insights as of January 2026.
Global Gas Analyzer Market Trends and Insights
Drivers Impact Analysis*
| Driver | (~) % Impact on CAGR Forecast | Geographic Relevance | Impact Timeline |
|---|---|---|---|
| Stringent Global Emissions Regulations | +1.80% | Global, with peak enforcement in EU, North America, China | Medium term (2-4 years) |
| Industrial Digitalization Driving Real-Time Monitoring | +1.50% | Global, led by North America and Western Europe | Short term (≤2 years) |
| Rapid Miniaturization of Sensor Packages | +0.90% | Global, with early adoption in Asia Pacific portable segment | Medium term (2-4 years) |
| Expansion of Continuous Emissions Monitoring Systems (CEMS) | +1.20% | Asia Pacific core, spill-over to Middle East and Africa | Long term (≥4 years) |
| Surge in Demand for Multi-Gas Portable Analyzers | +0.70% | North America and EU, expanding to Middle East oil and gas | Short term (≤2 years) |
| Edge-AI-Enabled Predictive Gas Analytics | +0.60% | North America and Asia Pacific pilot deployments | Long term (≥4 years) |
| Source: Mordor Intelligence | |||
Stringent Global Emissions Regulations
Tighter rules add the single largest uplift to growth. The 2024 update to U.S. Method 19 now obliges continuous oxygen correction for sulphur dioxide at coal boilers, forcing utilities to retire analyzers that cannot execute automated span checks. The European Union lowered nitrogen oxide limits for cement kilns to 150 mg/Nm³ and imposed hourly data uploads beginning January 2025, effectively ending manual logbooks.[1]European Union, “Industrial Emissions Directive,” EUR-Lex, eur-lex.europa.eu China extended ultra-low emissions limits to steel in 2025, mandating particulate matter below 10 mg/Nm³ with real-time uploads to provincial dashboards. India likewise required continuous monitors on ≥ 50 MW power plants in 2025, accelerating retrofit backlogs across Gujarat and Maharashtra.[2]Ministry of Ecology and Environment, “Ultra-Low Emissions Policy,” Government of China, mee.gov.cn Together, these rules compress procurement cycles and favour multi-parameter platforms that consolidate sulphur dioxide, nitrogen oxides, carbon monoxide, and particulate measurements in one cabinet.
Industrial Digitalization Driving Real-Time Monitoring
Plants now pair analyzers with industrial Internet of Things (IIoT) gateways, adding roughly 1.5 percentage points to growth. Emerson disclosed that 38% of 2025 analyzer orders shipped with OPC UA or MQTT edge modules for cloud historians.[3]Emerson Electric, “Extractive CEMS Cost Guidance,” emerson.com Siemens released the Sitrans CV with on-device TensorFlow inference that flags chromatography column fouling and triggers automatic recalibration. Pharmaceutical lines have become early adopters because FDA guidance on real-time release testing requires closed-loop control of oxygen and carbon dioxide in bioreactors. Standards such as ISA-TR108.00.01 now define cybersecurity profiles for field devices, prompting buyers to prioritize firmware-over-the-air capability. Predictive diagnostics cut downtime; ABB reported a 22% reduction in mean-time-to-repair on its AZ30 series after embedding drift-prediction algorithms.
Rapid Miniaturization of Sensor Packages
Smaller, lighter sensors contribute a 0.9% lift to the CAGR as field crews demand easy-to-carry instruments. Honeywell’s BW Ultra packs TDLAS methane, electrochemical hydrogen sulphide, and carbon monoxide in a 300-gram, Zone 0-rated body launched in 2025. Dräger patented a 15 mm photoacoustic cell that detects ammonia at 0.5 ppm within 10 seconds, enabling wearable devices for wastewater staff. Yokogawa’s OpreX TDLS8200 uses a 25 mm probe that screws into existing 1-inch taps, cutting installation labour by 40%. Longer battery life follows suit as Teledyne’s 2025 portfolio logs 48 hours on one charge, doubling the 2023 baseline.
Expansion of Continuous Emissions Monitoring Systems (CEMS)
CEMS rollouts add 1.2 percentage points to growth, centered on Asian coal power and Middle Eastern petrochemicals. China budgeted CNY 12 billion (USD 1.65 billion) in 2024 to network all thermal plants above 100 MW by 2026. India drafted CEMS rules for cement plants over 1 million tpa capacity in 2025, capturing about 180 sites nationwide. Saudi Arabia's May 2025 law now requires real-time volatile organic compound monitoring at tank farms, sparking demand for flame-ionization detectors. Turnkey CEMS favour incumbents yet open niches for in-situ lasers that eliminate extractive sample handling and extend maintenance cycles.
Restraints Impact Analysis*
| Restraint | (~) % Impact on CAGR Forecast | Geographic Relevance | Impact Timeline |
|---|---|---|---|
| High Up-Front Instrument and Calibration Costs | -0.80% | Global, acute in cost-sensitive emerging markets | Short term (≤2 years) |
| Skilled-Labour Shortage for On-Site Maintenance | -0.50% | North America and Europe, spreading to Asia Pacific | Medium term (2-4 years) |
| Sensor Drift and Cross-Gas Interference | -0.40% | Global, particularly complex flue-gas matrices | Medium term (2-4 years) |
| Cyber-Security Risks in Connected Gas Analyzers | -0.30% | North America and Europe IIoT deployments | Long term (≥4 years) |
| Source: Mordor Intelligence | |||
High Up-Front Instrument and Calibration Costs
A complete extractive CEMS can cost USD 80,000–150,000 per stack, with recurring calibration supplies adding USD 12,000–18,000 annually. Budget-constrained operators, especially in emerging markets, often delay projects until regulators issue closure notices, as India’s board did for 1,200 boilers in 2024. Leasing models exist; Endress+Hauser piloted subscriptions in Germany in 2024, but uptake remains limited to large utilities.
Skilled-Labour Shortage for On-Site Maintenance
The International Society of Automation found 43% of member firms struggled to hire analyzer technicians in 2025, up from 31% in 2022. Tasks such as multi-point linearity checks or electrochemical cell swaps demand months of hands-on training and often occur on offshore rigs or remote mines, hampering talent pipelines. Siemens’ Sitrans Connect service allows factory experts to guide local staff via augmented-reality headsets, trimming service calls by 35%. Yet essential hands-on work purging heated lines or replacing zirconia probes cannot be remote-first, so the gap persists.
*Our forecasts treat driver/restraint impacts as directional, not additive. The impact forecasts reflect baseline growth, mix effects, and variable interactions.
Segment Analysis
By Product Type: Portability Gains Traction in Field Audits
Fixed systems delivered 65.18% of 2025 revenue because regulations require uninterrupted stack data and plants value multiplexed sample lines that feed one cabinet. Portable instruments, however, will grow 7.20% annually by 2031 as the gas analyzer market embraces confined-space entry rules and third-party emissions audits. The 2024 U.S. confined-space standard compels real-time four-gas monitoring during tank entry, prompting municipal utilities to replace single-gas badges with multi-gas portables. Portable TDLAS units now achieve sub-ppm ammonia and hydrogen chloride detection yet remain Zone 0 safe, letting inspectors verify leaks without installing fixed infrastructure.
Procurement strategies reflect this shift. Operators increasingly treat portable devices as primary tools for episodic surveys, while scheduling fixed-system retrofits for longer outages. Rental fleets have grown, giving smaller refiners access to high-end analyzers without full capital outlay. As firmware updates add cloud synchronization, portable devices feed the same historians as fixed systems, allowing managers to reconcile spot readings with continuous streams and close compliance gaps faster.



By Technology: TDLAS Challenges NDIR Incumbency
NDIR held a 38.29% share of the gas analyzer market in 2025, historically entrenched in carbon dioxide, methane, and hydrocarbon monitoring. TDLAS, though, will expand 7.10% per year through 2031 as end-users prioritize in-situ reliability and cross-gas immunity. Yokogawa reported that TDLAS orders for ammonia slip doubled year-over-year once operators realized drift-free performance could reduce downtime under tight nitrogen oxide limits. Electrochemical cells still dominate portable safety roles because they are inexpensive and compact, but six-to-twelve-month sensor life and temperature sensitivity limit continuous-duty appeal.
Paramagnetic analyzers keep a niche in high-purity oxygen lines serving medical gas and semiconductor fabs, while zirconia probes remain combustion-control workhorses above 700 °C. Photoacoustic and quantum-cascade lasers are emerging at parts-per-billion sensitivity levels, though their high-cost confines adoption to research labs and high-value pharmaceutical suites. If regulators codify TDLAS as the reference method for moisture-laden processes, its climb could steepen further.
By Application: Safety and Leak Detection Accelerates
Emission monitoring absorbed 48.06% of deployments in 2025, but safety and leak detection will grow at 6.86% CAGR to 2031 as methane, hydrogen sulphide, and hydrogen hazards rise. The 2024 U.S. methane-reduction program mandates quarterly well-pad leak surveys, driving demand for Method 21 analyzers and optical gas imagers. ISO 26142 requires continuous hydrogen detection at 0.1 vol% in refuelling stations, pushing suppliers toward electrochemical or thermal-conductivity sensors that outperform catalytic beads.
Process optimization remains secondary yet steady; dissolved-oxygen and carbon dioxide loops in wastewater aeration and brewery fermentation drive incremental unit sales. Environmental and research use cases, such as greenhouse-gas flux towers employing cavity ring-down spectroscopy, represent a small but lucrative slice because laboratories prize accuracy, not cost.

By End-User Vertical: Pharmaceutical Outpaces Oil and Gas
Oil and gas delivered 34.48% of 2025 demand, anchored by flare-gas rules and offshore safety mandates. Pharmaceutical manufacturing, however, posts a 6.99% CAGR outlook as regulators embrace real-time process analytical technology. FDA sterile-drug guidance now requires closed-loop oxygen and carbon dioxide control inside bioreactors, turning gas analysis from quality check to real-time control variable. Chemical plants keep buying multi-point extractive systems for volatile organic compound control, but water utilities increasingly add dissolved-oxygen analyzers to earn Energy Star credits for energy-efficient aeration.
Food and beverage lines specify NDIR carbon dioxide and zirconia oxygen probes for modified-atmosphere packaging and kiln control, while utilities retrofit coal boilers with CEMS ahead of plant retirement schedules. Vertical diversification enlarges the supplier pool as bioprocess specialists and combustion-control veterans converge.
By Installation Method: Extractive Systems Retain Majority
Extractive platforms dominate because one cabinet can house multiple cells, meeting regulators’ multi-gas demands from one heated line. In-situ lasers, though, win when high moisture or particulate loads clog filters. Siemens said in-situ orders for cement kilns jumped 28% year-over-year after the firm launched its 25 mm-probe TDLAS line in 2025. Extractive remains crucial for natural-gas processing, pharmaceutical cleanrooms, and any application needing precise water-vapor removal before measurement.
Regulators now recognize trade-offs. Performance Specification 18 relaxed relative-accuracy limits for in-situ nitrogen oxides in 2025, reflecting lower maintenance burdens. This flexibility will pull in-situ share upward wherever uptime savings outweigh the precision premium, especially in Asia Pacific power plants that operate on tight staffing.
Geography Analysis
North America generated 32.03% of 2025 revenue, supported by dense refinery clusters, early IIoT adoption, and strict continuous monitoring rules. The updated U.S. New Source Performance Standards narrow sulphur dioxide and nitrogen oxide limits for coal utilities and call for quarterly relative-accuracy tests, prompting many plants to replace 1990s-era extractive analyzers with in-situ probes. Canada extended its Output-Based Pricing System to natural-gas processors in 2025, bringing infrared methane detectors to Alberta compressor stations. Mexico adopted real-time emissions reporting for refineries in March 2025, anchoring retrofit demand across Hidalgo and Guanajuato.
Asia Pacific is forecast to grow 6.40% annually through 2031, the quickest of any region. China’s ultra-low emissions rules now cover cement and glass, requiring 10 mg/Nm³ particulate ceilings and live data feeds province-wide. India’s ≥ 50 MW mandate created a backlog of coal-plant retrofits exceeding 100 GW in capacity. Japan funds hydrogen refuelling networks and demands continuous hydrogen leak detection below 0.1 vol%, stimulating orders for electrochemical and thermal-conductivity analyzers. South Korea tightened volatile organic compound limits at petrochemical tank farms, requiring sub-ppm flame-ionization detectors that carry Zone 1 ratings.
Europe held roughly 25% share in 2025 under the Industrial Emissions Directive’s demanding timelines. Hourly data transmission has eliminated manual logs, while Germany’s voluntary carbon-label program urges efficiency-oriented analyzers. The United Kingdom now specifies continuous dioxin monitoring by long-path Fourier-transform infrared in waste incineration, pushing high-end systems above USD 200,000 per installation. The Middle East and Africa grow steadily as Saudi petrochemical complexes and South African mines adopt continuous monitoring, though spend remains project-based. South America is smaller but rising, with Brazil mandating CEMS on pulp mills and Argentina piloting methane detection at Vaca Muerta shale fields.

Regulatory Landscape
Regulation continues to shift emissions compliance from periodic measurement toward continuous, auditable datasets, tightening both performance requirements and quality assurance for analyzers. In the United States, EPA requirements in 40 CFR 1065 specify range and drift verification for gaseous exhaust analyzers, including response-time verification for continuous analyzers, and require calibration gases to be traceable to NIST within defined tolerances. EPA programs such as the Protocol Gas Verification Program reinforce traceability and verification expectations for calibration gas used in compliance-grade measurement chains.
In Europe, Regulation (EU) 2024/1789 (methane emissions) increases the measurement burden on energy infrastructure through leak detection and repair requirements, alongside more robust methane quantification. Enhanced methane emissions quantification requirements apply from 5 February 2026. The regulation also calls for standardized technical rules for monitoring technologies, with Marcogaz providing implementation guidance while technical standardization work progresses. Together, these frameworks push buyers toward faster, higher-precision sensing, including methane-focused LDAR instrumentation, and toward analyzers and data systems that can support prescribed QA checks and reporting discipline.
Competitive Landscape
The gas analyzer market is moderately concentrated. ABB, Honeywell, Emerson, Siemens, and Thermo Fisher together hold about 45% share, leaving space for specialists in laser methane imaging, photoacoustic cells, and quantum-cascade spectroscopy. Incumbents leverage turnkey engineering, global service networks, and proprietary calibration protocols to defend margins, but Asian entrants undercut prices by 30-40%. Honeywell’s June 2025 purchase of a silicon-photonics supplier secures internal laser diode capacity for its TDLAS line, while ABB embedded TensorFlow Lite into its AZ30 platform to flag sensor drift in real time.
Strategic playbooks coalesce around three themes. First, vendors integrate edge analytics so plants can diagnose anomalies without cloud latency. Second, they localize production through joint ventures in China and India to dodge tariffs and shorten lead times. Third, portfolios expand via startup acquisitions: Emerson bought Quantum Analytics for USD 95 million to add quantum-cascade laser capability, and Teledyne acquired Gasmet for calibration-free Fourier-transform infrared technology.
Emerging disruptors, often university spinouts, target drone-mounted methane imagers that survey pipelines at one-tenth the cost of ground crews, challenging the notion that analysis must occur in a cabinet. Established players respond by bundling analytics software, training, and calibration-gas logistics into subscription models that lock in multi-year revenue streams even as hardware margins compress.
Gas Analyzer Industry Leaders
ABB Ltd
Honeywell International Inc.
Emerson Electric Co.
Siemens AG
Thermo Fisher Scientific
- *Disclaimer: Major Players sorted in no particular order

Market Opportunities and Future Outlook
Compliance-driven modernization is creating whitespace for multi-gas platforms that reduce the number of analyzers per stack or process skid while meeting tighter QA and reporting expectations. Product actions in 2026 reflect this direction: Emerson introduced the Rosemount QX1000 continuous gas analyzer in February 2026, combining paramagnetic oxygen measurement with quantum cascade laser direct absorption spectroscopy for multi-pollutant coverage, including CO, CO2, NO, NO2, and SO2. This hybrid architecture suits plants that need to reconcile emissions control, combustion optimization, and documented compliance without maintaining multiple standalone measurement cabinets.
Hazardous-area deployment and total cost of ownership remain major purchase gates in oil and gas, petrochemicals, and tank farm monitoring. That environment supports opportunity for certified, purge-free analyzer configurations and service models that reduce on-site specialist workload. In July 2026, AMETEK Process Instruments expanded its 993X series with explosion-proof enclosures certified for ATEX and IECEx Zone 1, which removes the requirement for continuous inert purge gas and simplifies remote or utility-limited installations. Beyond regulated stacks, semiconductor and specialty gas applications also need in-line purity verification: Japan METI industrial gas safety standards mandating redundant impurity detection for pyrophoric silane delivery reinforce investment in ultra-trace, real-time impurity measurement methods in fabs and bulk gas distribution.
Recent Industry Developments
- June 2026: ABB secured CSA certification for the Fidas24 gas analyzer for hazardous industrial applications in the United States and Canada, extending its certifications beyond ATEX and IECEx. The added certification broadens where the instrument can be specified in North American hazardous locations and supports procurement standardization across multi-site operators.
- February 2026: Emerson introduced the Rosemount QX1000 Continuous Gas Analyzer, combining paramagnetic O2 measurement with quantum cascade laser direct absorption spectroscopy for CO, CO2, NO, NO2, and SO2. The launch reinforces the shift toward consolidated, multi-constituent measurement that reduces cabinet complexity while supporting compliance and emissions control use cases.
- May 2024: Regulation (EU) 2024/1789 on methane emissions was adopted, setting a framework for tighter methane monitoring, leak detection and repair, and standardization of monitoring technologies across the EU energy value chain. The policy direction raises the need for higher-precision methane quantification and pushes operators toward more capable LDAR and measurement workflows.


Research Methodology Framework and Report Scope
Market Definition and Coverage
For this study, the gas analyzer market covers instruments and systems used to measure, detect, and continuously monitor gas concentrations in industrial and environmental settings, including fixed and portable configurations, along with typical sampling and conditioning elements sold with the analyzer.
Scope exclusions: accessories and services that are not sold as part of the analyzer system are excluded, along with standalone sensors or detectors without analyzer functionality.
Segmentation Overview
- By Product Type
- Fixed
- Portable
- By Technology
- Electrochemical
- Paramagnetic
- Zirconia
- Non-Dispersive IR
- Tunable Diode Laser (TDLAS)
- By Application
- Emission Monitoring
- Safety and Leak Detection
- Process Optimization
- Environmental and Research
- By End-User Vertical
- Oil and Gas
- Chemical and Petrochemical
- Water and Wastewater
- Pharmaceutical
- Power and Utility
- Food and Beverage
- By Installation Method
- In-Situ
- Extractive
- By Geography
- North America
- United States
- Canada
- Mexico
- Europe
- United Kingdom
- Germany
- France
- Italy
- Rest of Europe
- Asia-Pacific
- China
- Japan
- India
- South Korea
- Rest of Asia
- Middle East
- Israel
- Saudi Arabia
- United Arab Emirates
- Turkey
- Rest of Middle East
- Africa
- South Africa
- Egypt
- Rest of Africa
- South America
- Brazil
- Argentina
- Rest of South America
- North America
Data Sources, Market Sizing, and Validation
Desk Research
Desk research built the initial demand map and helped us set the right guardrails for the model before primary checks were added. We used public sources such as the US Environmental Protection Agency (air emissions and monitoring programs), the European Environment Agency, the International Energy Agency (energy and fuel mix), and the US Energy Information Administration (refining and power statistics) to connect likely monitoring intensity with end-use activity.
We also referred to sources such as UN Comtrade for trade flows of relevant instrument categories, selected patent databases to understand sensing and analyzer design activity, and company filings and investor presentations to pull revenue disclosures and business mix language where it was available. A paid subscription covering company financials and news was used selectively to speed up screening of public statements, contracts, and major facility announcements. The sources named here are illustrative, and many other public documents were also used for data collection, cross-checking, and clarifying gaps.
Primary Interviews and Surveys
Primary work was used to validate what portion of monitoring needs gets converted into analyzer spending, and to pressure-test pricing and replacement assumptions that are hard to observe in public data. We spoke with a balanced mix of manufacturers, channel partners, integrators, and end users across APAC, EMEA, and the Americas, and then re-contact was done when desk signals and model outputs did not line up.
Inputs from these discussions were used to align the model with common procurement cycles, typical use cases (stack monitoring, process safety, and ambient monitoring), and differences between portable and installed systems.
Distribution of primary research fieldwork respondents
| Company type | Respondent position | Region |
|---|---|---|
| Top tier: 25% | CXOs: 15% | APAC: 44% |
| Mid tier: 58% | Functional/Unit leaders: 30% | EMEA: 29% |
| Smaller Players: 17% | Managers: 55% | Americas: 27% |
Market-Sizing & Forecasting
The market was sized using a top-down build where industrial activity and compliance driven monitoring needs were reconstructed by major end-use pools, then converted into analyzer demand using adoption and replacement assumptions. Since public statistics rarely state how many analyzers are installed, the conversion relies on measurable signals such as power and refining capacity additions, emissions compliance intensity, CEMS penetration indicators, the pace of industrial expansion, and import and export trends for analyzer class instruments.
Those totals were then corroborated with selective bottom-up approximations, including sampled average selling prices by analyzer type, channel checks on typical system quotes, and a reality check using public revenue hints from relevant product lines. When gaps appeared, such as an unclear split between portable units and installed systems in certain countries, we used conservative proxy shares validated through interviews, then adjusted only after the numbers aligned with observed project activity.
For forecasting, scenario analysis was used because demand can move quickly when environmental enforcement or energy investment cycles change. The key drivers were projected using a mix of published outlooks and expert consensus, and then translated into volume and price trajectories using normalized assumptions on replacement cycles and price progression.
Data Validation & Update Cycle
Checks were run at multiple points so the final numbers stayed consistent with real-world signals. Outputs were compared against independent indicators such as industrial production movement, emissions control spending direction, trade movement for instrument categories, and notable plant expansions, and then variances were investigated before sign-off.
If an assumption materially changed, such as a sharp swing in energy project timing or a regulation update affecting continuous monitoring, we re-contacted sources to confirm the impact and to avoid carrying forward old inputs. The report is refreshed annually, and interim updates are made when major events create a meaningful shift. Before delivery, a final analyst review pass is completed so clients receive an up-to-date view.
Mordor Intelligence's Gas Analyzer Market Size Compared With Other Published Estimates
Different published market sizes for gas analyzers can look far apart, even when they discuss similar use cases, because the counted product set and timing assumptions are not always the same. The differences usually come from whether adjacent categories are bundled in, how installed system value is treated, and how currency and inflation are handled across regions.
Gas sensors and gas detectors are often grouped into the same revenue pool in other sources, but those items sit outside Mordor Intelligence's scope for this report, which keeps the total tied to analyzer systems only. Gaps also come from using an earlier base year and then inflating forward, or applying aggressive growth to price without validating the replacement cycle and compliance led demand drivers through interviews.
Benchmark comparison
| Source | Market Size | Gaps in Research Methodology |
|---|---|---|
| Mordor Intelligence | USD 1.08 B (2026) | |
| Global Consultancy A | USD 4.39 B (2024) | Uses a broader definition that typically captures a combined pool of analyzers plus adjacent gas detection and sensing categories, which lifts the value beyond analyzer systems alone. The year and forecast window also differ, so simple year shifting can overstate the gap. |
| Industry Publisher B | USD 4.46 B (2025) | Likely includes a wider equipment set and counts more of the total system and services value under the same market label, which changes what is being summed. The stated base year and longer forecast horizon can also push higher totals if price growth assumptions are not anchored to replacement patterns. |
The spread in the table mostly comes down to what products are being counted and which year is being quoted. By keeping the definition tight to analyzer systems, and then cross-checking demand using compliance activity, capacity additions, and interview-backed replacement and pricing inputs, the results stay traceable and easier to reproduce over time.


Key Questions Answered in the Report
What is the current value of the gas analyzer market?
The gas analyzer market size is USD 1.08 billion in 2026.
Which segment is growing fastest by application?
Safety and leak detection posts the highest 6.86% CAGR through 2031.
Why is TDLAS gaining popularity over NDIR?
Operators prefer TDLAS because it delivers in-situ measurements with zero drift and strong moisture tolerance, reducing maintenance and downtime.
Which region will add the most new demand by 2031?
Asia Pacific is projected to expand at 6.40% CAGR, the fastest of all regions, driven by coal power, cement, and hydrogen initiatives.
Who are the leading suppliers in this space?
ABB, Honeywell, Emerson, Siemens, and Thermo Fisher collectively hold around 45% of global revenue.
Page last updated on:


 Your data is secure and never sold or shared.


