
Market Overview
| Study Period | 2020 - 2031 |
|---|---|
| Forecast Data Period | 2026 - 2031 |
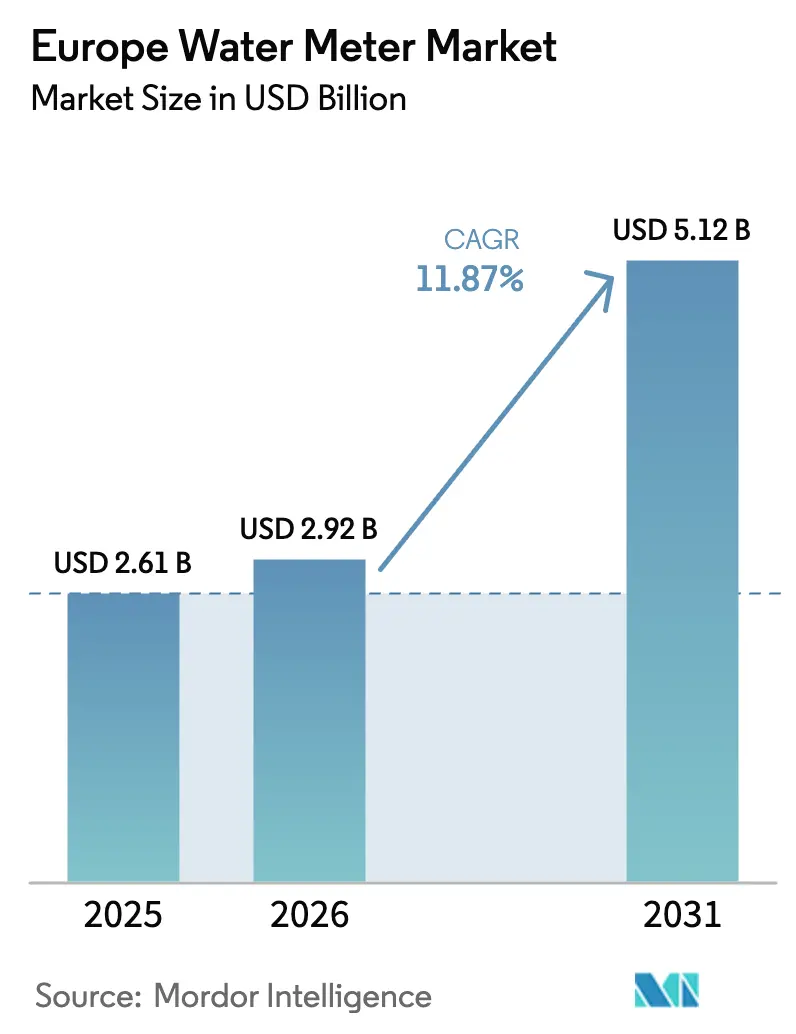
| Base Year Market Size (2025) | USD 2.61 Billion |
| Market Size (2026) | USD 2.92 Billion |
| Market Size (2031) | USD 5.12 Billion |
| Growth Rate (2026 - 2031) | 11.87% CAGR |
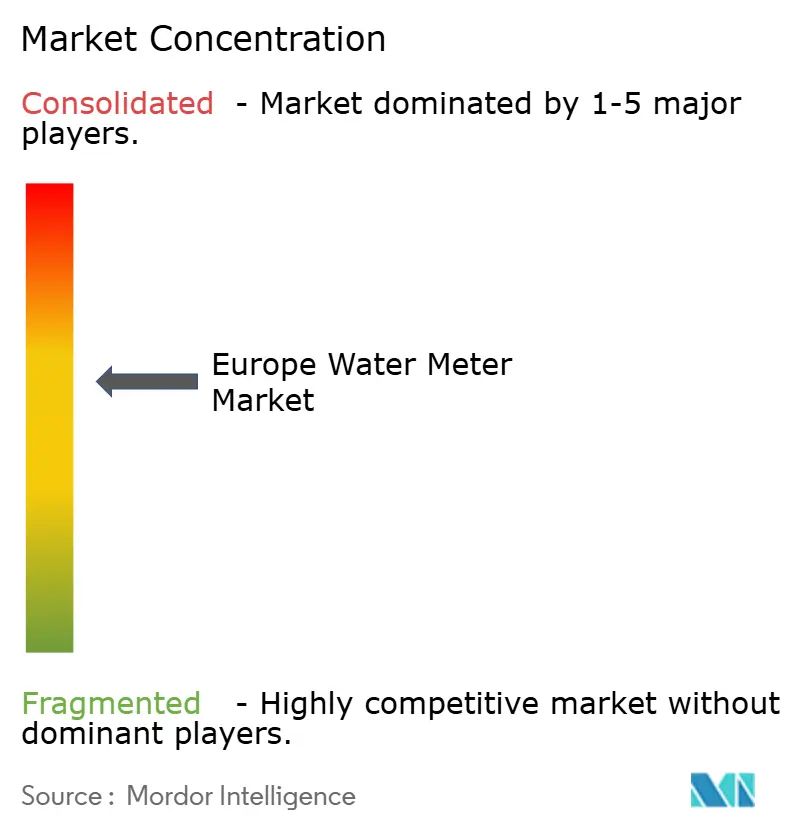
| Market Concentration | Medium |
Major Players *Disclaimer: Major Players sorted in no particular order Image © Mordor Intelligence. Reuse requires attribution under CC BY 4.0. | |
Europe Water Meter Market Analysis by Mordor Intelligence
The Europe water meter market size was valued at USD 2.61 billion in 2025 and estimated to grow from USD 2.92 billion in 2026 to reach USD 5.12 billion by 2031, at a CAGR of 11.87% during the forecast period (2026-2031). The growth reflects tough EU water-scarcity mandates, generous AMP8 and EU Recovery funding, and rapid adoption of AI-ready ultrasonic smart meters with acoustic leak detection. Utilities are accelerating replacement of legacy mechanical devices, integrating LPWAN connectivity, and coupling meters with cloud analytics that enable near real-time demand management, tariff innovation, and network-wide non-revenue water reduction. Intensifying climate risks, PFAS quality requirements, and tighter leakage targets further reinforce investment, while hardware evolution toward battery-efficient NB-IoT and LoRaWAN endpoints lowers lifetime ownership cost and simplifies rural rollouts.
Smart meter penetration is still low across much of the continent, creating a sizable addressable base. The UK shows the fastest short-term lift thanks to Ofwat’s GBP 1.7 billion AMP8 commitment, while France and Germany follow with structured digitalization frameworks. Commercial and industrial users present above-average growth as consumption-based billing pushes businesses to demand higher-resolution data, and modular, cloud-hosted platforms shorten deployment cycles for mid-sized water companies.
Key Report Takeaways
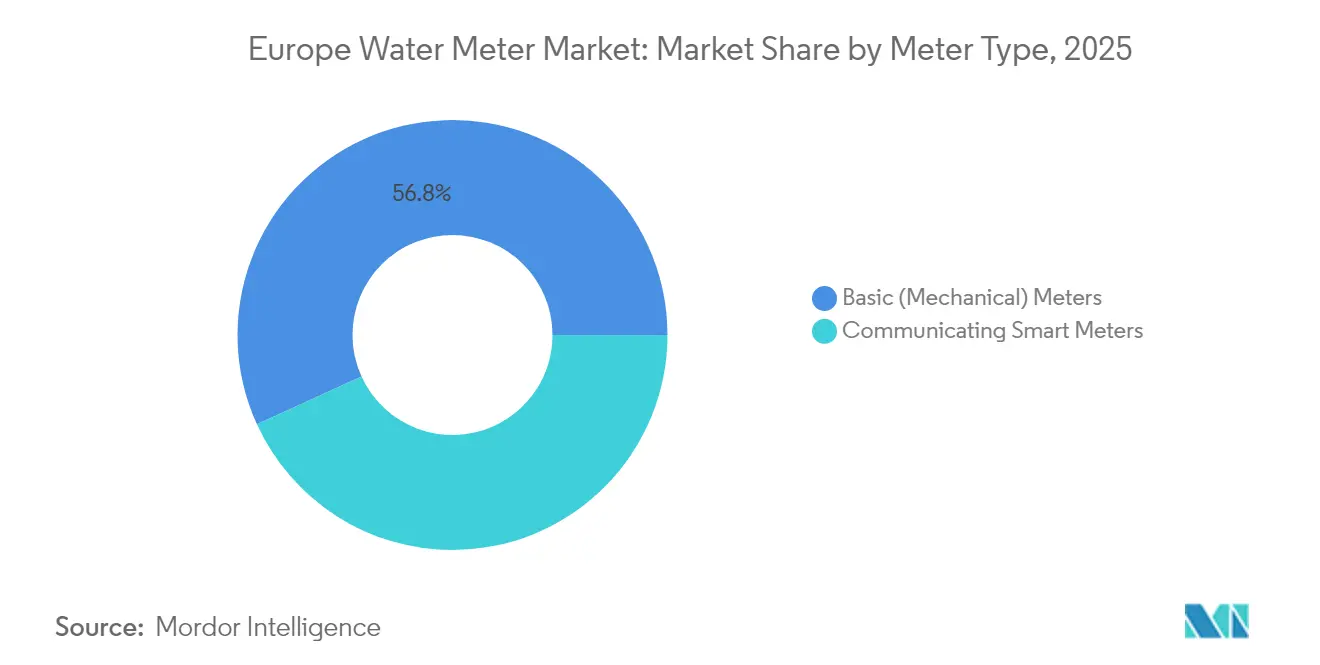
- By meter type, basic mechanical units held 56.82% of Europe water meter market share in 2025; communicating smart meters are projected to expand at a 13.78% CAGR through 2031.
- By technology, AMR commanded 53.65% of the Europe water meter market size in 2025; NB-IoT-enabled AMI is advancing at a 12.96% CAGR to 2031.
- By end-user, residential connections accounted for 48.45% of revenue in 2025, while the commercial segment is set to grow at 13.55% CAGR during the forecast period.
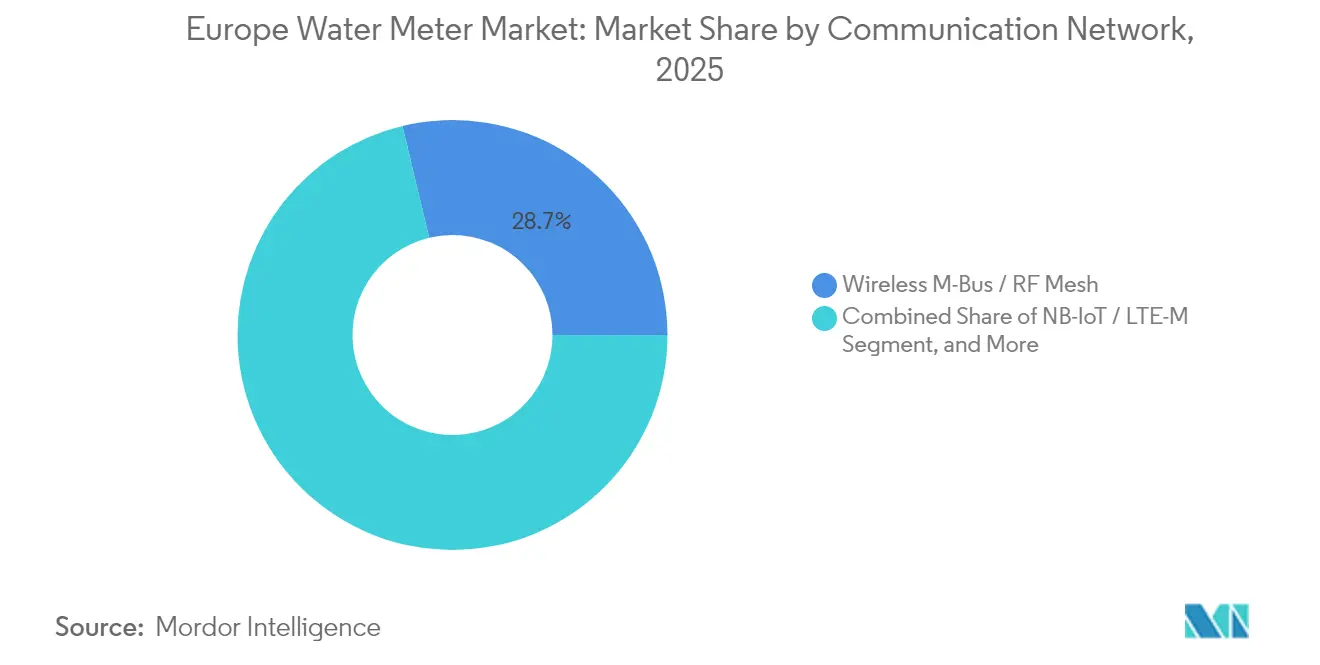
- By communication network, wireless M-Bus/RF Mesh led with 28.74% share in 2025; NB-IoT/LTE-M endpoints show the fastest climb at 14.05% CAGR through 2031.
Note: Market size and forecast figures in this report are generated using Mordor Intelligence’s proprietary estimation framework, updated with the latest available data and insights as of 2026.
Europe Water Meter Market Trends and Insights
Drivers Impact Analysis*
| Driver | (~) % Impact on CAGR Forecast | Geographic Relevance | Impact Timeline |
|---|---|---|---|
| EU leakage-reduction mandates and water-scarcity policies | +3.20% | Global, with early gains in UK, Germany, France | Medium term (2-4 years) |
| Accelerating smart-meter roll-outs funded by AMP8 and EU Recovery plans | +2.80% | UK core, spill-over to EU member states | Short term (≤ 2 years) |
| AI-enabled acoustic leak detection lowering non-revenue water | +2.10% | APAC core, spill-over to North America & EU | Medium term (2-4 years) |
| Growth of eco-tariffs and consumption-based billing models | +1.90% | Global | Long term (≥ 4 years) |
| PFAS-related quality standards driving real-time monitoring | +1.50% | EU core, expanding to global markets | Long term (≥ 4 years) |
| Open data APIs enabling new value-added services | +1.30% | North America & EU, expanding globally | Medium term (2-4 years) |
| Source: Mordor Intelligence | |||
EU Leakage-Reduction Mandates and Water-Scarcity Policies
The European Environment Agency warns that demand could outstrip supply by 5 billion litres daily by 2050, leading member states to tighten leakage rules and mandate remote-read meters. Ofwat earmarked GBP 1.7 billion under AMP8 to install almost 10 million smart meters, aiming for a 17% leakage cut and 48% household penetration by 2030.[1]Environment Agency, “Appendix A: Smart metering in revised draft water resources management plans,” GOV.UK, gov.uk Germany obliges remote-read devices in new builds since October 2020, with all retrofits due by end-2026, while France is scaling ultrasonic rollouts that already deliver >75% leak-detection success and lift network efficiency above 89%.[2]Kamstrup, “Water-link boosts revenue with intelligent metering,” KAMSTRUP.COM, kamstrup.com The upcoming EU water-resilience strategy positions smart metering as critical infrastructure and ties compliance to ISO 4064 accuracy classes.
Accelerating Smart-Meter Rollouts Funded by AMP8 and EU Recovery Plans
The UK’s GBP 104 billion AMP8 program is the largest sector investment since privatization, with a clear priority on smart metering and network data upgrades. Thames Water’s GBP 50 million framework with Honeywell and Sensus commits to more than 1 million new meters using Vodafone NB-IoT for up to 24 daily readings. Affinity Water budgets GBP 150 million for 397,000 endpoints, and Yorkshire Water contracts Netmore to replace 1.3 million units via LoRaWAN. French municipalities tap the EU Recovery Facility, with FNCCR estimating EUR 1.233 billion to equip 53% of the nation’s meters by 2035, yielding EUR 205 million annual gains and 811 million m³ in savings.[3]Banque des Territoires, “Territoires durables et connectés,” BANQUESDESTERRITOIRES.FR, banquedesterritoires.fr MID and RED directives harmonize metrology and radio compliance, allowing multi-vendor tendering.
AI-Enabled Acoustic Leak Detection Lowering Non-Revenue Water
European utilities lose an average of 23% of treated supply before billing. Embedding acoustic sensors in ultrasonic meters turns each endpoint into a distributed listening node. Trials by Severn Trent using Kamstrup flowIQ 2200 achieved 98.8% network performance, flagged leaks in 14% of properties, and transmitted 23 hourly readings per day.[4]SUEZ, “High-performance smart metering across topographies,” SUEZ.COM, suez.com Thames Water’s 1.2 million installed smart meters have discovered more than 80,000 customer-side leaks, recovering 120 megalitres per day and underpinning a target to halve leakage by 2050. Diehl Metering strengthened its analytics stack by acquiring PREVENTIO, whose AI models rank leak probability and trigger predictive maintenance.
Growth of Eco-Tariffs and Consumption-Based Billing Models
EU rules require utilities to offer variable tariffs to smart-metered customers from 2025. Affinity Water is piloting rising-block structures, while Severn Trent’s Nectar-points initiative rewards conservation. German suppliers already send quarter-hour interval data that lets energy-intensive firms shift usage and cut bills up to 35%. Studies find household demand falls 16% when users view real-time data, underscoring behavioural benefits. Dynamic pricing also helps utilities align revenue with resource scarcity, smoothing cash flow in drought years.
Restraints Impact Analysis*
| Restraint | (~) % Impact on CAGR Forecast | Geographic Relevance | Impact Timeline |
|---|---|---|---|
| Fragmented data-access regulations (GDPR, national hubs) | -2.10% | EU core, with regulatory spillover globally | Medium term (2-4 years) |
| High retrofit costs in legacy housing stock | -1.80% | Global, with acute pressure in EU & North America | Long term (≥ 4 years) |
| Cyber-security and privacy concerns over AMI networks | -1.40% | Global | Medium term (2-4 years) |
| Supply-chain tightness for ultrasonic chips and batteries | -1.20% | Global | Short term (≤ 2 years) |
| Source: Mordor Intelligence | |||
Fragmented Data-Access Regulations (GDPR, National Hubs)
Meter data are classified as personal under GDPR, so utilities must encrypt payloads, store them on certified servers, and obtain explicit consent for analytics or third-party sharing. Germany goes further, requiring BSI-approved smart-meter gateways with Common Criteria EAL 4+ security, delaying many projects. France’s CNIL imposes similar vetting, and post-Brexit UK utilities juggle both EU and domestic rules. Compliance raises back-office costs, complicates API exposure, and forces periodic software audits.
High Retrofit Costs in Legacy Housing Stock
Europe’s aged building stock often necessitates cabinet enlargement, pipe realignment, or boundary-box excavation. German landlords may face one-off upgrades up to EUR 2,000, though regulated installation fees stay capped at EUR 30. London’s Victorian terraces pose narrow-access issues that stretch labour hours and disrupt residents. French law mandates accredited plumbers for new meters, adding EUR 500-1,500 per dwelling. Combined, these factors slow the rollout pace and inflate utility capital programs.
*Our forecasts treat driver/restraint impacts as directional, not additive. The impact forecasts reflect baseline growth, mix effects, and variable interactions.
Segment Analysis
By Meter Type: Mechanical Dominance Faces Smart Revolution
Mechanical meters still represented 56.82% of the Europe water meter market share in 2025. Their large installed base and low unit price underpin volume, yet shipment growth is trending negative as utilities pivot to digital accuracy. Communicating smart meters are forecast to grow 13.78% CAGR, steadily eroding legacy share and lifting the Europe water meter market size through higher average selling price and value-added services.
Regulated leakage targets and the need for acoustic leak detection have tipped procurement toward solid-state ultrasonic devices that measure down to 4 L h with no moving parts. Yorkshire Water’s 1.3 million replacement program shows how utilities bundle connectivity, analytics, and warranty in a single tender that sidelines purely mechanical products. As vendors retire mechanical tooling and scale solid-state lines, price gaps are narrowing and the total cost of ownership Favors digital endpoints, accelerating displacement.



By Technology: AMR Leadership Yields to AMI Innovation
AMR solutions accounted for 53.65% of the Europe water meter market size in 2025, reflecting a decade of semi-automated walk-by and drive-by deployments. Utilities now demand bidirectional communication, hourly data granularity, and firmware upgrade paths, pushing AMI shipments to a 12.96% CAGR. NB-IoT modules in AMI platforms allow 24-hour battery-friendly polling and seamless cloud integration, enabling predictive maintenance and dynamic tariffs.
Essex and Suffolk Water’s LoRaWAN AMI pilot covers 1 million meters and transmits hourly reads that feed leakage reduction algorithms. Spain’s early NB-IoT adoption validates commercial viability in high-density apartments, and vendor roadmaps show unified stacks combining edge analytics and over-the-air calibration. As analytics subscriptions gain traction, AMI hardware forms the gateway for recurring SaaS, locking in long-term vendor-utility partnerships.
By End-User: Commercial Growth Outpaces Residential Adoption
Households generated 48.45% of revenue in 2025, but commercial accounts are projected to expand 13.55% CAGR, the fastest among all verticals. EU legislation obliges businesses to report consumption and emissions, making high-resolution metering non-negotiable. Breweries, data centers, and logistics parks install large-diameter ultrasonic meters with API feeds to ESG dashboards.
Utilities often subsidize residential rollouts via cross-financing from commercial service contracts that bundle maintenance, analytics, and extended warranties. Affinity Water earmarks separate technology stacks for its 20,000 non-household endpoints, demonstrating higher margin per installation. Industrial plants integrate meter data with SCADA for water-energy nexus optimization, underpinning sustainable production certifications.
By Communication Network: Wireless M-Bus Leads as NB-IoT Surges
Wireless M-Bus and RF Mesh held 28.74% share in 2025 owing to proven interoperability and vendor availability. Cellular LPWAN, especially NB-IoT and LTE-M, is, however, climbing at 14.05% CAGR as telecoms cut module tariffs below EUR 1 yearly for bulk utility contracts. Vodafone’s UK network covers 98% of indoor basements, making NB-IoT attractive for urban retrofits.
Hybrid architectures emerge wherein dense zones use RF Mesh backhauled by LTE, while rural outposts rely on direct cellular to minimize pole infrastructure. Cambridge Consultants find FlexNet delivers the longest range, but LoRaWAN offers battery parity when sending six-hourly reads. Standardization under RED 2014/53/EU assures coexistence across the 868 MHz band, safeguarding future upgrade paths.
By Meter Size Class: Domestic Dominance with Commercial Expansion
Domestic meters (≤ DN 25) dominate shipment volume, yet intermediate DN 32-50 devices see faster adoption in mixed-use buildings and small commercial premises. Bulk and district meters (≥ DN 80) command premium ASP and embed pressure as well as flow sensing. Utilities deploy them at district metered areas (DMA) to triangulate network losses in conjunction with household acoustic data, creating digital twins that guide capex planning.
Kamstrup’s flowIQ 2200 line boasts a 20-year battery and an inline acoustic sensor, fitting domestic cabinets without pipe cutting. Hidroconta’s Centaurus addresses DN 13-40 with NB-IoT and multi-index logging for sub-billing in shopping centers. District devices increasingly integrate 5G routers, and Siemens and O₂ Telefónica now offer Network Slice for Water, securing dedicated bandwidth for critical data.
Geography Analysis
The United Kingdom is the pacesetter in smart adoption. AMP8 allocates GBP 1.7 billion solely for meters, aiming to lift household penetration from 13% in 2025 to 48% by 2030 and 73% by 2040. Major contracts include Thames Water’s GBP 50 million NB-IoT project and Yorkshire Water’s 1.3 million LoRaWAN replacements. Early results show daily leak savings of 33 megalitres and improved customer engagement via mobile dashboards. The Europe water meter market size in the UK is forecast to grow above the regional CAGR through 2031, buoyed by regulatory certainty and supply-chain readiness.
Germany follows a security-centric path. Since October 2020, all new meters must support remote reading, and existing installations must be retrofitted by end-2026 per Article 9c of the Energy Efficiency Directive. BSI certification requires tamper-proof gateways and encrypted payloads, adding complexity yet building consumer trust. Pilot projects such as TEAG’s Bad Tabarz rollout cut leakage from 20% to near 6% and validate business cases for nationwide adoption. Although the implementation is cautious, Germany’s large housing stock ensures steady volume beyond 2027, reinforcing the Europe water meter market value.
France accelerates through public-private alliances. Eau Agglo Perpignan Méditerranée will fit 126,000 ultrasonic meters by 2026, already logging night-flow reductions of 30% and annual savings of EUR 125,000. Veolia’s Greater Lyon deployment installs 10,000 devices per month and pairs them with fixed leak sensors, saving 33,000 m³ daily. National studies predict 53%-meter penetration by 2035, backed by EUR 1.233 billion investment and high mutualisation to spread platform cost. The French market therefore contributes a substantial share to overall Europe water meter market revenues and demonstrates scalable MaaS models.
Rest of Europe, including Italy, Spain, the Nordics and the Baltics, shows heterogenous uptake. Spain leads NB-IoT pilots for water, the Nordics favour PLC due to harsh winters, and Eastern markets often bundle water and district heat meters in joint procurement. EU cohesion funding and the new Water Resilience initiative provide grants that harmonize standards and accelerate convergence, keeping the Europe water meter market on a robust upward trajectory.
Competitive Landscape
The competitive field is moderately concentrated. Diehl Metering, Itron, Birdz (Veolia), Sensus (Xylem), and Kamstrup together control well above half of the installed European smart endpoints, leveraging integrated hardware, connectivity, and analytics platforms. These incumbents hold long-term framework agreements and extensive accredited test labs, raising entry barriers.
Strategic acquisitions intensify capability stacking: Badger Meter bought SmartCover to add sewer monitoring for USD 185 million, Xylem purchased a majority stake in Idrica to integrate data management into Xylem Vue, and Diehl Metering acquired PREVENTIO for AI leak analytics. Smaller firms differentiate via niche technologies such as 5G network slicing (Siemens), NB-IoT module design (B Meters), or battery-free energy harvesting (Lacroix).
Competition also pivots on service delivery. Utilities increasingly outsource end-to-end deployment, data hosting, and customer apps in multiyear contracts. Vendors that combine ISO-compliant metrology, cybersecurity certification, and predictive analytics win tenders, evidenced by Landis+Gyr’s 15-year partnership with Danish utility TREFOR to modernize both water and heat metering. Component shortages have prompted some utilities to dual-source hardware while standardizing on open software interfaces, fostering a multi-vendor ecosystem yet retaining high switching costs.
Europe Water Meter Industry Leaders
Elster Group GmbH (Honeywell International Inc)
Diehl Stiftung & Co. KG
Apator SA
Siemens AG
Badger Meter, Inc.
- *Disclaimer: Major Players sorted in no particular order

Recent Industry Developments
- April 2025: Siemens and O₂ Telefónica Germany unveiled a commercial 5G Slice for the water sector, piloting in North Rhine-Westphalia to secure critical infrastructure data.
- February 2025: Badger Meter completed the USD 185 million takeover of SmartCover Systems, adding real-time sewer monitoring to its European portfolio.
- February 2025: Affinity Water launched a GBP 150 million tender for 397,000 smart meters under its AMP8 leakage strategy.
- January 2025: Thames Water signed a GBP 50 million framework with Honeywell and Sensus to deploy more than 1 million NB-IoT meters by 2030.


Europe Water Meter Market Report Scope
Water meters are devices that measure the quantity of water used in various applications. On the other hand, smart metering solutions are extensions of these conventional meters and employ meters or modules with communication capabilities (either one-way or two-way) embedded within the meter or attached to the meter.
The European water meter market is segmented by Type of Meter (Basic Meters, Communicating Smart Meters) and Country.
By Meter Type
| Basic (Mechanical) Meters |
| Communicating Smart Meters |
By Technology
| Automatic Meter Reading (AMR) |
| Advanced Metering Infrastructure (AMI) |
By End-User
| Residential |
| Commercial |
| Industrial |
| Utilities and Municipal Networks |
By Communication Network
| Radio Frequency (Wireless M-Bus / RF Mesh) |
| NB-IoT / LTE-M |
| Power-Line Communication (PLC) |
| 4G/5G Cellular |
By Meter Size Class
| ≤ DN 25 (Domestic) |
| DN 32 – 50 (Light Commercial) |
| ≥ DN 80 (Bulk / District) |
By Country
| United Kingdom |
| Germany |
| France |
| Rest of Europe |
| By Meter Type | Basic (Mechanical) Meters |
| Communicating Smart Meters | |
| By Technology | Automatic Meter Reading (AMR) |
| Advanced Metering Infrastructure (AMI) | |
| By End-User | Residential |
| Commercial | |
| Industrial | |
| Utilities and Municipal Networks | |
| By Communication Network | Radio Frequency (Wireless M-Bus / RF Mesh) |
| NB-IoT / LTE-M | |
| Power-Line Communication (PLC) | |
| 4G/5G Cellular | |
| By Meter Size Class | ≤ DN 25 (Domestic) |
| DN 32 – 50 (Light Commercial) | |
| ≥ DN 80 (Bulk / District) | |
| By Country | United Kingdom |
| Germany | |
| France | |
| Rest of Europe |


Key Questions Answered in the Report
How large is the Europe water meter market in 2026?
The Europe water meter market size stands at USD 2.92 billion in 2026 and is on track to reach USD 5.12 billion by 2031.
What is the expected growth rate to 2031?
The market is forecast to expand at a 11.87% CAGR from 2026 to 2031, outpacing most other utility asset categories.
Which meter technology is growing fastest?
NB-IoT-enabled AMI platforms are the fastest-growing technology, showing a projected 12.96% CAGR through 2031 as utilities demand hourly data and remote firmware updates.
Why are commercial installations expanding quicker than residential ones?
Commercial users face stringent consumption-based billing rules and ESG reporting, driving a 13.55% CAGR that outstrips the residential segment.
What role does AMP8 play in the UK?
Ofwat's AMP8 allocates GBP 1.7 billion for nearly 10 million meters, lifting smart penetration to 48% of households by 2030 and making the UK the regional growth engine.
Which communication networks dominate future deployments?
Cellular LPWAN, especially NB-IoT and LTE-M, is gaining traction due to wide coverage and low cost, although wireless M-Bus remains prevalent in existing fleets.
Page last updated on:






