
Modern Trade Retail Market Size and Share
Market Overview
| Study Period | 2020 - 2031 |
|---|---|
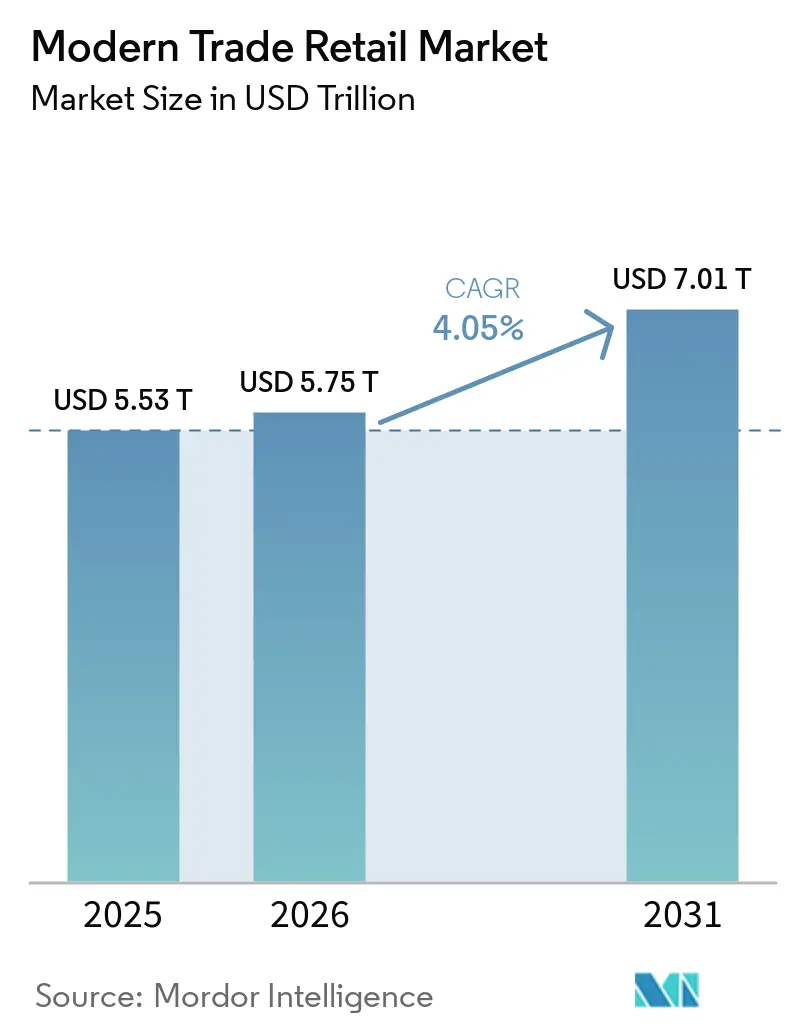
| Market Size (2026) | USD 5.75 Trillion |
| Market Size (2031) | USD 7.01 Trillion |
| Growth Rate (2026 - 2031) | 4.05 % |
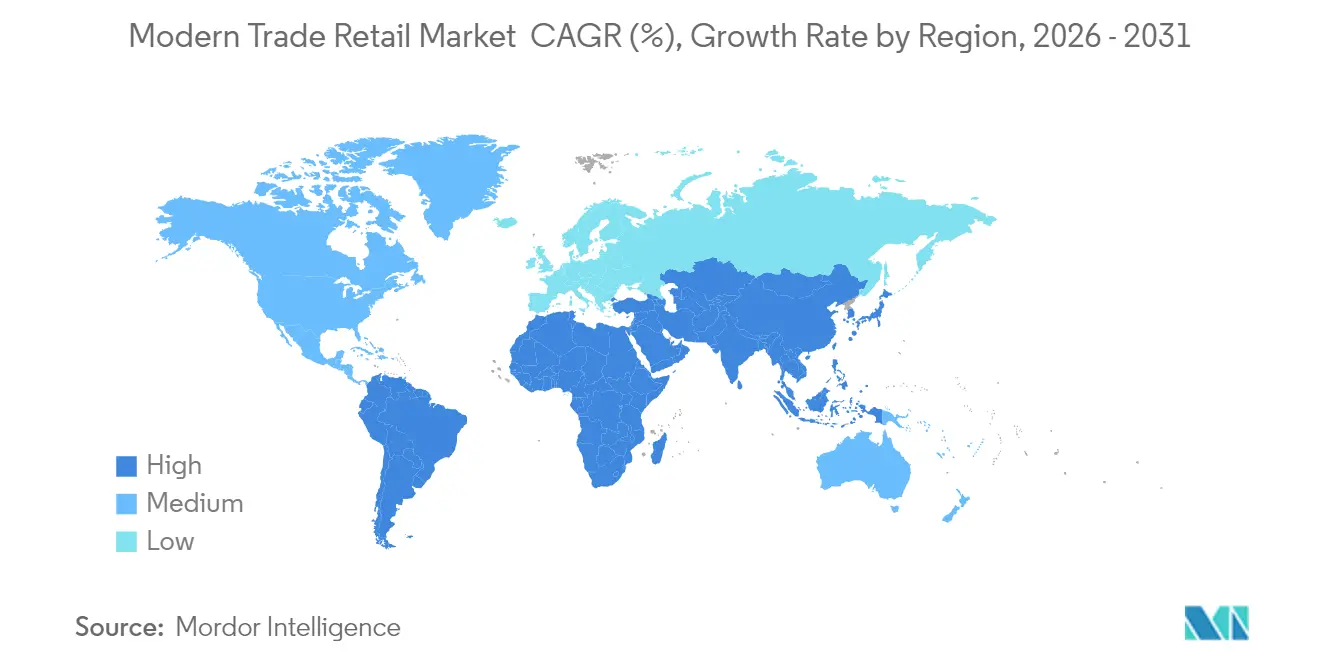
| Fastest Growing Market | Africa |
| Largest Market | Asia Pacific |
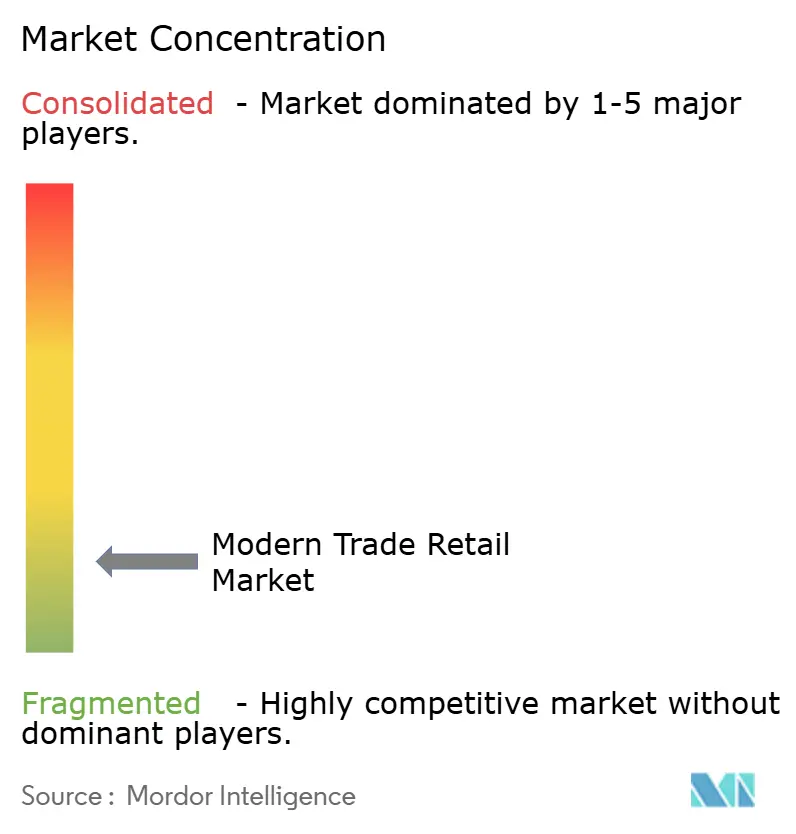
| Market Concentration | Low |
Major Players *Disclaimer: Major Players sorted in no particular order Image © Mordor Intelligence. Reuse requires attribution under CC BY 4.0. | |
Modern Trade Retail Market Analysis by Mordor Intelligence
The modern trade retail market size is expected to grow from USD 5.53 trillion in 2025 to USD 5.75 trillion in 2026 and is forecast to reach USD 7.01 trillion by 2031 at 4.05% CAGR over 2026-2031. Current expansion builds on resilient household spending, faster urbanization, and the sector-wide shift to omnichannel business models that blend physical stores with digital engagement. Investments in artificial intelligence for inventory planning and dynamic pricing widen gross margins even as price competition continues. Asia-Pacific remains the demand anchor, supported by large middle-class populations and improving logistics networks, while Africa delivers the fastest growth as supermarket penetration accelerates. Retailers prioritize private-label programs, automated fulfillment, and regional consolidation to capture margin upside and defend share against pure-play e-commerce rivals.
Key Report Takeaways
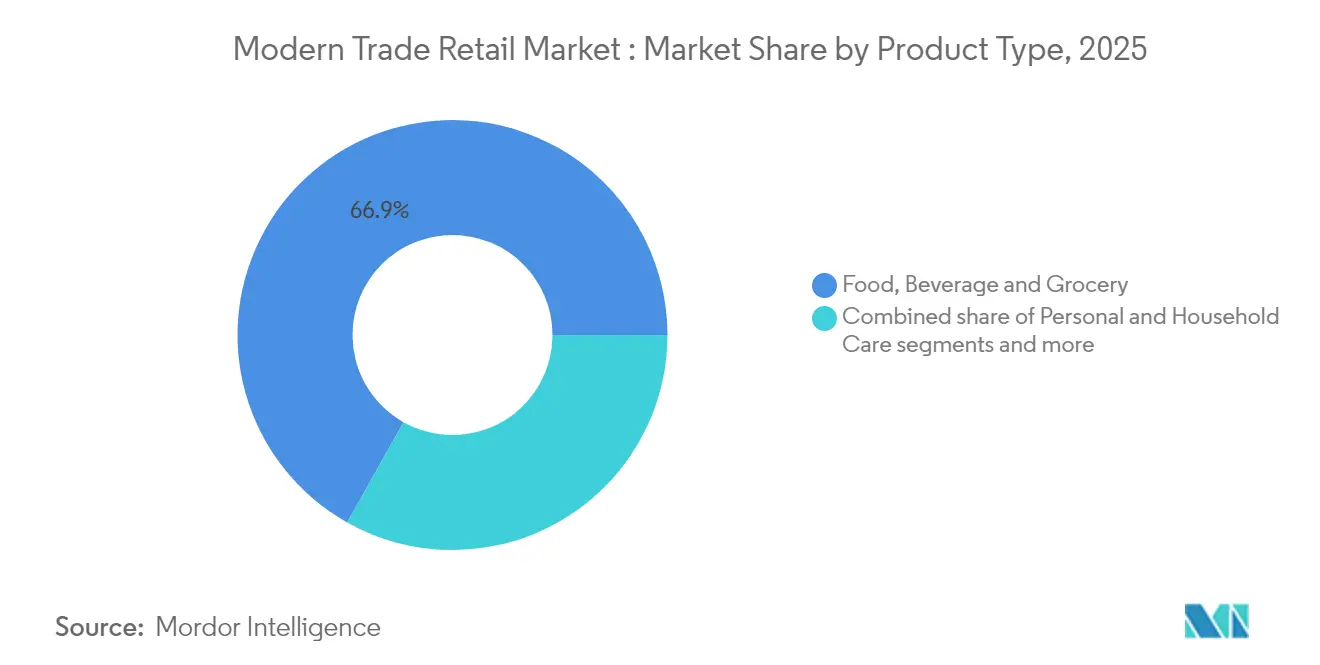
- By product type, food, beverage & grocery led with 66.85% of modern trade retail market share in 2025; toys, hobby & appliances is projected to record a 12.74% CAGR through 2031.
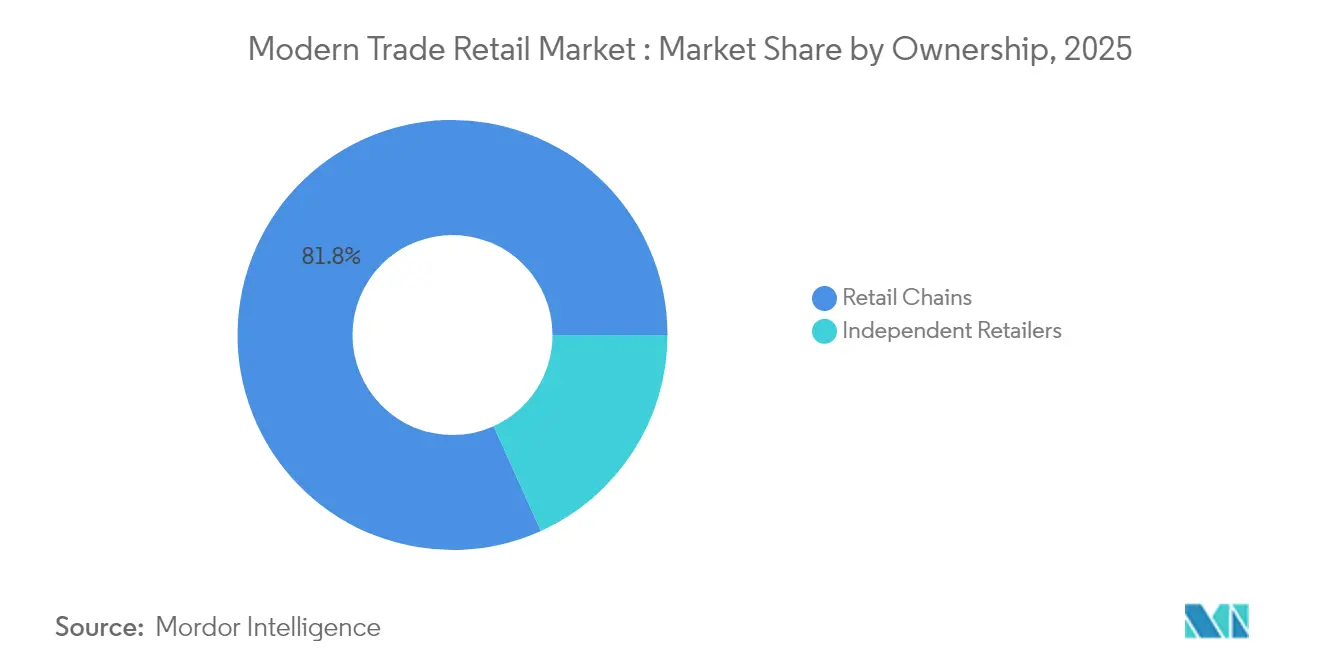
- By ownership, retail chains controlled 81.75% of the modern trade retail market size in 2025, while independent retailers are advancing at a 9.96% CAGR through 2031.
- By distribution channel, supermarkets and hypermarkets accounted for 54.12% of the modern trade retail market size in 2025, and online channels are expanding at a 13.88% CAGR through 2031.
- By geography, Asia-Pacific captured 37.10% of the modern trade retail market share in 2025and Africa is forecast to expand at a 12.03% CAGR to 2031.
Note: Market size and forecast figures in this report are generated using Mordor Intelligence’s proprietary estimation framework, updated with the latest available data and insights as of 2026.
Market Trends and Insights
Drivers Impact Analysis of Modern Trade Retail Market *
| Driver | (~) % Impact on CAGR Forecast | Geographic Relevance | Impact Timeline |
|---|---|---|---|
| Rising urban middle-class disposable income | +1.2% | APAC core, spill-over to MEA and South America | Medium term (2-4 years) |
| Proliferation of private-label brands | +0.8% | Global, with strongest impact in North America & Europe | Long term (≥ 4 years) |
| Omnichannel retail & click-and-collect expansion | +0.9% | Global, early gains in North America, Europe, urban APAC | Short term (≤ 2 years) |
| Under-penetrated tier-2/3 city supermarkets in Asia & Africa | +1.1% | APAC and MEA focused, limited North America relevance | Long term (≥ 4 years) |
| AI-driven dynamic pricing & inventory forecasting | +0.6% | Global, with faster adoption in developed markets | Medium term (2-4 years) |
| Sustainability-led demand for traceable supply chains | +0.4% | Europe and North America leading, spreading globally | Long term (≥ 4 years) |
| Source: Mordor Intelligence | |||
Rising Urban Middle-Class Disposable Income
Urban household income expansion in emerging markets creates a multiplier effect beyond simple basket size increases, fundamentally altering category mix toward higher-margin discretionary goods. In India, urban households with annual incomes above USD 10,000 are projected to grow from 31 million in 2024 to 100 million by 2030, driving demand for premium private-label products and imported goods that carry 15-25% higher margins than commodity categories. This demographic shift enables retailers to justify investments in store format upgrades and technology infrastructure that were previously uneconomical in price-sensitive markets. The income elasticity of retail spending in tier-2 and tier-3 cities often exceeds 1.5, meaning a 10% income increase translates to 15% higher retail spending, creating sustainable growth momentum independent of overall economic cycles.
Proliferation of Private-Label Brands
Private-label penetration has evolved from a defensive margin strategy to an offensive differentiation tool, with leading retailers achieving 25-40% of total sales from own-brand products that generate gross margins 20-30 percentage points higher than national brands. Walmart's private-label sales exceeded USD 100 billion in 2024, representing nearly 25% of its total revenue and demonstrating the scale advantages available to large format retailers[1]. The strategic shift involves moving beyond commodity categories into premium segments, with retailers launching organic, sustainable, and health-focused private-label lines that command price premiums while maintaining superior margins. This trend accelerates as supply chain transparency requirements under regulations like the EU's Corporate Sustainability Due Diligence Directive enable retailers to better control product provenance and quality narratives.
Omnichannel Retail & Click-and-Collect Expansion
Click-and-collect services have matured from pandemic necessity to permanent competitive advantage, with adoption rates reaching 60-70% among frequent shoppers in developed markets and driving 15-20% increases in average order values. The operational efficiency gains are substantial: retailers report 40-50% lower fulfillment costs for click-and-collect orders compared to home delivery, while simultaneously increasing store footfall and cross-selling opportunities. IKEA's expansion of click-and-collect points to 200+ locations across major markets demonstrates how furniture and home goods retailers are leveraging this model to serve customers without full-scale store investments. The technology infrastructure required, including inventory visibility systems and mobile payment integration, creates barriers to entry that favor established players with existing store networks and IT capabilities.
Under-Penetrated Tier-2/3 City Supermarkets in Asia & Africa
Modern trade penetration in smaller cities across Asia and Africa remains below 20% compared to 60-80% in major metropolitan areas, representing a USD 200-300 billion addressable market opportunity through 2030. Reliance Retail's expansion into 200+ tier-2 and tier-3 Indian cities since 2024 illustrates the scalable economics: lower real estate costs, reduced competition, and higher customer loyalty offset smaller initial basket sizes[2]. The infrastructure development required cold chain logistics, payment system integration, and local supplier networks creates first-mover advantages that can sustain market leadership for decades. African markets show particularly strong potential, with supermarket penetration below 15% in most countries outside South Africa, while urbanization rates exceed 4% annually in key markets like Nigeria and Kenya.
Restraints Impact Analysis of Modern Trade Retail Market *
| Restraint | (~) % Impact on CAGR Forecast | Geographic Relevance | Impact Timeline |
|---|---|---|---|
| Intensifying price wars compress margins | -0.7% | Global, most acute in mature North American and European markets | Short term (≤ 2 years) |
| Supply-chain disruptions from geopolitical risks | -0.5% | Global, with highest impact on import-dependent regions | Medium term (2-4 years) |
| Pure-play e-commerce competition reduces footfall | -0.6% | Developed markets primarily, spreading to urban emerging markets | Long term (≥ 4 years) |
| High CapEx for store automation & digitalisation | -0.3% | Global, constraining smaller regional players disproportionately | Medium term (2-4 years) |
| Source: Mordor Intelligence | |||
Intensifying Price Wars Compress Gross Margins
Retail price competition reached unprecedented intensity in 2024, with major chains reducing prices on thousands of items simultaneously, creating a deflationary spiral that compressed industry-wide gross margins by 50-100 basis points Wall Street Journal. Walmart's aggressive pricing on 7,000+ items, matched by Target's price cuts across grocery and household essentials, demonstrates how scale advantages in procurement and logistics become weapons in market share battles. The margin pressure is most acute in commodity categories where differentiation is limited, forcing retailers to accelerate private-label development and premium category expansion to maintain profitability. Smaller regional chains face existential pressure as they lack the procurement scale to match price reductions while maintaining viable operating margins.
Supply-Chain Disruptions from Geopolitical Risks
Global supply chain disruptions surged 38-40% in 2024, with geopolitical tensions, trade policy uncertainty, and regional conflicts creating persistent inventory and cost pressures across retail categories. The Red Sea shipping crisis alone added 10-15 days to delivery times and increased container costs by 200-300%, forcing retailers to maintain higher safety stock levels that tie up working capital and reduce inventory turnover efficiency. Retailers are responding through supply chain regionalization and near-shoring strategies, but these transitions require 2-3 years to implement fully and often involve 10-20% higher procurement costs during the transition period. The complexity is compounded by sustainability compliance requirements that limit supplier flexibility and increase due diligence costs across global supply networks.
*Our forecasts treat driver/restraint impacts as directional, not additive. The impact forecasts reflect baseline growth, mix effects, and variable interactions.
Modern Trade Retail Market Segment Analysis
By Product Type:
Essential Staples Sustain Scale While Discretionary Categories Drive MarginFood, Beverage & Grocery retained the highest 2025 modern trade retail market share at 66.85%, reflecting daily consumption and cross-category basket anchoring. Toys, Hobby & Appliances, however, is forecast to deliver a 12.74% CAGR through 2031, buoyed by smart-home upgrades and gaming adoption. The mix shift supports gross-margin expansion, offsetting thin margins in staples. Retailers bundle loyalty rewards and financing options to encourage high-ticket upgrades, while category seasonality drives targeted promotions that stabilize quarterly revenue flows. In parallel, Personal & Household Care sees steady demand as consumers prioritize wellness and hygiene. Apparel, Footwear & Accessories face stiffer online rivalry, prompting in-store assortment curation and fast-replenishment cycles. Furniture & Home Décor benefits from hybrid work patterns that spur home improvement spending, yet remain sensitive to macro lending conditions. Balanced category portfolios give chains resilience, leveraging grocery foot traffic to upsell discretionary items and diversify the modern trade retail market revenue base.

By Ownership:
Scale Consolidation Meets Independent AgilityChains commanded 81.75% of the modern trade retail market size in 2025, capitalizing on centralized purchasing, data-rich loyalty ecosystems, and technology investments. Independents counter with localized assortments, community engagement, and rapid decision cycles, achieving a 9.96% CAGR that outpaces the broader market. Franchise partnerships and buying cooperatives allow smaller operators to tap shared logistics and marketing platforms without ceding local authenticity, preserving diversity across competitive landscapes. Cost escalation in sustainability reporting and digital infrastructure favors consolidation, yet regulatory scrutiny over market dominance restrains unchecked mergers. Successful operators balance scale and flexibility: regional chains deploy modular store formats that adapt to neighborhood demographics, while large groups create incubator programs for niche concepts, blending entrepreneurial speed with enterprise resources.
By Distribution Channel:
Physical Stores Transform Into Fulfillment EnginesSupermarkets and hypermarkets accounted for 54.12% of 2025 sales, yet now act as omnichannel nodes, supporting online order pick-ups, same-day delivery dispatches, and returns processing. This hybrid model enhances asset utilization and customer convenience, sustaining the modern trade retail market relevance of large-format outlets. Online channels’ 13.88% CAGR, driven largely by traditional retailers’ digital extensions rather than stand-alone e-commerce entrants, underscores convergence rather than substitution. Specialty stores safeguard market share through curated assortments and expert service, doubling down on experiential merchandising to justify in-person visits. Convenience stores exploit immediate-need missions and extended hours, while warehouse clubs secure loyalty through bulk value offerings and membership ecosystems. Channel pluralism under a unified brand umbrella delivers seamless engagement, ensuring shoppers remain within the retailer’s ecosystem regardless of the journey start point.
Geography Analysis
APAC Modern Trade Retail Market
Asia-Pacific held 37.10% of global revenue in 2025, underpinned by China’s broad store network and India’s rapid rollout of tier-2/3 supermarkets, where modern trade retail penetration is still under 25%. Investments in cold-chain logistics and digital payments unlock rural and peri-urban demand, cementing the region’s centrality to future volume growth. High smartphone penetration enables scan-and-go checkouts and hyper-localized promotions that elevate shopper engagement.
The Americas, Europe and Africa Modern Trade Retail Market
Africa offers the fastest trajectory at a 12.03% CAGR to 2031, driven by the continent’s young demographic, rising disposable income, and infrastructure upgrades that reduce distribution bottlenecks. Nigeria, Kenya, and Egypt record double-digit store rollouts, while mobile-money ecosystems simplify cash-flow management for both retailers and consumers. Supply chain volatility and regulatory heterogeneity remain operational hurdles, but first movers secure strategic sites and supplier relationships that underpin long-term scale. North America and Europe post mature yet profitable growth at 3.29% and 2.61% CAGR, respectively. Operators focus on AI-enabled demand forecasting, localized assortment, and sustainability compliance to protect margins in tight labor markets. Omni-fulfillment innovations, including curbside pickup and micro-fulfillment robotics, originate here and later diffuse to emerging regions. South America grows at a 4.96% CAGR, with performance tempered by macroeconomic swings and currency fluctuation risk.
Regulatory Landscape
Modern trade retailers face layered rules on product safety and cross-border trade that affect sourcing economics and supplier negotiations. In January 2026, the French competition authority, Autorite de la concurrence, launched a competitive assessment of major retail purchasing alliances (including AURA and CONCORDIS), extending scrutiny of joint buying arrangements that can influence shelf pricing.
Trade and compliance requirements are also tightening alongside omnichannel and private-label expansion. The EU agreed a reform of the Union Customs Code in March 2026, centered on a new EU Customs Data Hub and an EU Customs Authority (planned to become operational in 2028), while a temporary EUR 3 customs duty on low-value e-commerce consignments (up to EUR 150) takes effect on July 1, 2026. Retailers continue to incorporate GFSI-recognized audit expectations in supplier programs (for example, Walmart direct import requirements and Costco FSSC 22000-based modules). In 2026, revisions to major food-safety schemes, including FSSC 22000 and BRCGS updates, raise the bar for traceability and audit readiness across global supply networks.
Value Chain Analysis
The modern trade retail value chain covers (1) brand owners and private-label manufacturers, (2) import and domestic wholesalers, (3) retailer-owned distribution and fulfillment, and (4) store and digital execution (merchandising, payments, delivery, and returns). Scale players strengthen procurement through centralized buying and European buying alliances, including Carrefour-backed structures such as CONCORDIS and AURA, which are intended to improve purchase terms and price competitiveness in core grocery and FMCG baskets.
Compliance and quality assurance have become upstream cost and capability gates, particularly for private-brand and direct-import flows. Walmart requires direct import suppliers to maintain independent certification aligned with GFSI-recognized audit standards, including FSSC 22000, and Costco applies an FSSC 22000 requirements module to define food-safety audit expectations for manufacturing and processing partners. Retailers also blend retailer-controlled distribution centers with supplier-led Direct Store Delivery (DSD) in select categories, shifting inventory risk and route-to-shelf execution between brands and retailers while supporting high-frequency replenishment across supermarkets, hypermarkets, and convenience formats.
Competitive Landscape
In 2024, the global modern trade retail market remains highly fragmented, with the top five players, Walmart, Carrefour, Schwarz Gruppe, Costco, and Tesco, holding a relatively modest share of total revenue. This fragmentation leaves room for regional challengers to scale and compete. Major global retailers are investing heavily in advanced technologies such as AI-powered demand forecasting, warehouse automation, and retail media networks that monetize loyalty data through targeted advertising. Walmart’s acquisition of a smart-TV brand broadens its connected-screen advertising capabilities, while Carrefour is experimenting with autonomous store pods to offer 24/7 service in dense urban areas. These innovations reflect a shift toward omnichannel integration and data monetization as key growth drivers. As global players pursue tech-enabled differentiation, they also reinforce their dominance through capital-intensive strategies that smaller competitors struggle to match.
Regional retailers are responding by consolidating to boost their competitiveness and improve operational efficiency. In the U.S., a notable merger between a major wholesaler and a mid-sized grocer in 2024 exemplified efforts to gain cross-channel advantages and supply chain synergies. Private equity activity has intensified, highlighted by the acquisition of a pharmacy-retail chain focused on integrating healthcare services more rapidly. Meanwhile, new entrants are testing asset-light models like dark stores in underserved regions such as Latin America and Africa. While innovative, these models face challenges related to high fulfillment costs and limited profitability without broader scale partnerships. As a result, sustainability for many start-ups depends on either rapid expansion or collaboration with larger platforms.
Technology adoption continues to define the competitive landscape across all tiers of retail. AI-powered pricing tools now allow dynamic adjustments in near real time, helping retailers lift gross margins by several percentage points in pilot locations. Back-of-house automation is also delivering results, reducing shrinkage and improving shelf availability, which in turn drives higher sales. The most successful retailers are those that unify physical locations, data systems, and fulfillment infrastructure under a single strategic framework. This alignment creates powerful advantages that are difficult for less integrated players to replicate. As technology and data become central to execution, firms with cohesive digital strategies build more defensible market positions. The modern trade landscape is increasingly shaped by those who can effectively merge innovation with scale.
Modern Trade Retail Industry Leaders
-
Walmart Inc.
-
Carrefour S.A.
-
Schwarz Gruppe (Lidl, Kaufland)
-
Costco Wholesale Corp.
-
Tesco PLC
- *Disclaimer: Major Players sorted in no particular order
Modern Trade Retail Market Companies Covered in this Report
- Walmart Inc.
- Carrefour S.A.
- Amazon.com Inc.
- Schwarz Gruppe (Lidl & Kaufland)
- Costco Wholesale Corp.
- Kroger Co.
- Tesco PLC
- Aldi Einkauf SE & Co.
- Ahold Delhaize NV
- Target Corp.
- Reliance Retail Ltd.
- JD.com (JD Retail)
- Alibaba Group (Freshippo)
- Auchan Retail S.A.
- Seven & i Holdings (7-Eleven)
- E-Mart Inc.
- Falabella S.A.
- Lojas Americanas S.A.
- Shoprite Holdings Ltd.
- Majid Al Futtaim Retail
Market Opportunities and Future Outlook
Omnichannel micro-fulfillment and in-store automation are key spaces for margin defense, especially as supermarkets and hypermarkets already operate as fulfillment nodes. Carrefour's Carrefour 2030 plan is one concrete example, including a EUR 150 million partnership with Vusion to deploy electronic shelf labels and connected in-store infrastructure in French hypermarkets and supermarkets, plus an AI-focused partnership with Google aimed at more automated commerce journeys. Together, these efforts support faster price updates, improved on-shelf availability, and tighter linkage between store operations and digital demand signals.
Private-label expansion into sustainable and traceable goods is reinforced by rising compliance expectations and the increasing role retailers play in sourcing standards. Carrefour reports alignment of sustainability reporting with the EU CSRD and the EU Green Taxonomy, and retailer supplier programs, including Walmart and Costco food-safety and audit expectations tied to GFSI-recognized schemes, push manufacturers toward more standardized, auditable processes. For cross-border flows, the EU Customs Code reform (including the Customs Data Hub) and the July 1, 2026 duty on low-value e-commerce consignments change the economics of small-parcel imports. That combination creates room for modern trade retailers with established import, compliance, and distribution capabilities to compete more effectively against parcel-based models.
Recent Industry Developments in Modern Trade Retail Market
- February 2026: Carrefour launches Carrefour 2030 strategic plan with €150 million investment partnership with Vusion for electronic shelf labels, connected rails, and cameras; AI-focused partnership with Google for agentic commerce. The move directly targets modern trade tech modernization. The capacity addition strengthens in-store automation and AI-enabled commerce capability to defend share in mature markets.
- January 2026: Costco launches first same-day delivery websites in France and Spain (sameday.costco.fr and sameday.costco.es) with Instacart. The development enhances omnichannel and fulfillment in European markets. The capacity addition strengthens Costco's ability to compete with e-commerce rivals through rapid delivery options.
- January 2026: Carrefour enters Ethiopia via franchise expansion with Queens Supermarket PLC; first stores to be rebranded by mid-2026. The expansion broadens geographic footprint into an emerging market. The franchising model diversifies regional growth and supply chain reach.
Modern Trade Retail Market Report Scope and Research Methodology
Market Definition and Coverage
For this study, the modern trade retail market is measured as consumer retail sales that flow through organized store formats and managed retail networks, including chain-led grocery and non-grocery outlets, in-store services, and linked online order fulfillment where it is tied to these networks.
Scope exclusions: We exclude informal and unorganized retail (independent mom-and-pop trade), pure wholesale cash-and-carry activity that is not consumer retail, and direct-to-consumer brand sales that bypass retail intermediaries.
Segments Covered in This Report
- By Product Type
- Food, Beverage, and Grocery
- Personal and Household Care
- Apparel, Footwear, and Accessories
- Furniture and Home Decor
- Toys, Hobby, & Household Appliances
- Others
- By Ownership
- Retail Chains
- Independent Retailers
- By Distribution Channel
- Supermarkets/Hypermarkets
- Specialty Stores
- Online
- Other Distribution Channels
- By Geography
- North America
- Canada
- United States
- Mexico
- South America
- Brazil
- Peru
- Chile
- Argentina
- Rest of South America
- Europe
- United Kingdom
- Germany
- France
- Spain
- Italy
- BENELUX
- NORDICS
- Rest of Europe
- Asia-Pacific
- India
- China
- Japan
- Australia
- South Korea
- South-East Asia
- Rest of Asia-Pacific
- Middle East and Africa
- United Arab Emirates
- Saudi Arabia
- South Africa
- Nigeria
- Rest of Middle East and Africa
- North America
Data Sources, Market Sizing, and Validation
Desk Research
Desk research was used to set the basic guardrails for demand, pricing, and channel structure, before assumptions were tested with primary inputs. We relied on public datasets and official publications such as national statistics offices, World Bank macro series, UN Comtrade trade data (as a packaged consumer goods proxy where relevant), OECD retail indicators, and labor and income series from the ILO, which help frame household spending capacity.
We also reviewed retailer annual reports, filings, investor decks, and credible press coverage to track store footprint expansion, format mix changes, and digital enablement inside modern trade networks. Where helpful, paid subscriptions were used for company financials and intelligence, news and financials, and a shipment-level import export database to sanity-check category supply signals in specific geographies. This list is illustrative only, and we also used other sources during data collection, validation, and clarification.
Primary Interviews and Surveys
Primary work focused on validating what portion of retail spending is captured by organized formats, and how quickly the shift occurs by region and category. We spoke with executives, functional leaders, and managers across retailers, distributors, brand teams, and retail real estate and supply chain roles. The coverage spanned APAC, EMEA, and the Americas so that local format economics and pricing realities could be reflected in the model.
Distribution of primary research fieldwork respondents
| Company type | Respondent position | Region |
|---|---|---|
| Top tier: 25% | CXOs: 18% | APAC: 46% |
| Mid tier: 56% | Functional/Unit leaders: 35% | EMEA: 33% |
| Smaller Players: 19% | Managers: 47% | Americas: 21% |
Market-Sizing & Forecasting
Sizing starts with a top-down rebuild of the addressable retail spend pool by country and region, using household consumption, retail sales indicators, and the estimated modern trade share in key categories. This is then translated into market value in USD. After setting the demand pool, we run selective bottom-up checks to confirm the totals, such as sampling store-count expansion, format-level sales productivity ranges, and ASP and basket size movements for common modern trade categories.
Key inputs used in the model include consumer spending growth, urbanization and middle-income expansion, store footprint additions and closures, the pace of private label penetration, online order contribution tied to organized chains, and inflation-led ticket size changes. Forecasting uses scenario analysis supported by light multivariate regression, where macro variables and channel shift rates are stress-tested with interview feedback to avoid unrealistic step-changes. In smaller markets where bottom-up evidence is incomplete, gaps are handled through proxy peers with similar income bands and retail structure, followed by re-checks against country-level retail signals.
Data Validation & Update Cycle
Outputs are checked through triangulation across independent signals, including macro consumption paths, retail sales direction, and retailer network expansion cues, before final sign-off. Any sharp variances by region or sudden jumps in modern trade share trigger deeper review, and then the assumptions are revisited. If the gap cannot be explained by known events, we conduct follow-up outreach.
A multi-step internal review is completed so that calculation logic, unit consistency, and currency conversion timing are aligned across the full dataset. The report is refreshed annually, and interim updates are made when material events change near-term retail conditions. Before delivery, the full model is re-run with a last pass on newly released public data so clients receive the latest view.
Mordor Intelligence's Modern Trade Retail Market Sizing Compared With Other Published Estimates
Published market sizes for modern trade retail do not always match because firms draw the market boundary differently, then apply different conversion and channel rules across countries. Differences also build up when one estimate relies on a single base year snapshot, while another uses a longer historical series and updates assumptions more frequently.
Store network expansion signals, consumer spending series, and retailer-reported sales trends are the evidence checks that anchor Mordor Intelligence's estimate to organized retail value rather than broader retail activity that includes informal trade. Other gaps often come from whether online sales are counted only when tied to organized chains, how hypermarkets and convenience formats are treated, and how currency conversion timing is handled during volatile inflation periods.
Benchmark comparison
| Source | Market Size | Gaps in Research Methodology |
|---|---|---|
| Mordor Intelligence | USD 5.75 T (2026) | |
| Global Consultancy A | USD 6.20 T (2026) | Expands scope by counting broader organized and semi-organized retail formats in some countries, and applies a higher assumed online contribution without separating chain-linked fulfillment from pure-play digital sales. |
| Industry Association B | USD 5.10 T (2026) | Uses a narrower definition that excludes parts of non-grocery modern trade and relies on conservative channel shift assumptions, with limited adjustments for store productivity changes and inflation-led ticket size. |
Overall, the spread is explained by how strictly organized formats are separated from informal trade, and by how online-linked sales are treated inside modern trade boundaries. By tying the model to repeatable demand signals and then cross-checking against grounded bottom-up cues, the estimate stays transparent and easier to reconcile across regions.
Key Questions Answered in the Report
How large is the modern trade retail market in 2026?
The modern trade retail market size stands at USD 5.75 trillion in 2026 and is projected to reach USD 7.01 trillion by 2031 at a 4.05% CAGR.
Which region leads modern trade retail revenue?
Asia-Pacific commands 37.10% of global revenue because of large urban populations and rapid supply-chain modernization.
What category is growing fastest through 2031?
Toys, Hobby & Appliances is set to expand at a 12.74% CAGR due to rising discretionary spending on smart-home and gaming products.
Why are private-label products important?
Private-label penetration delivers margins 20–30 percentage points higher than national brands, helping retailers offset price-war pressures.
How are supermarkets adapting to e-commerce growth?
Supermarkets increasingly operate as omnichannel hubs, offering click-and-collect and micro-fulfillment services that cut last-mile costs by up to 40%.