Market Overview
| Study Period | 2020 - 2031 |
|---|---|
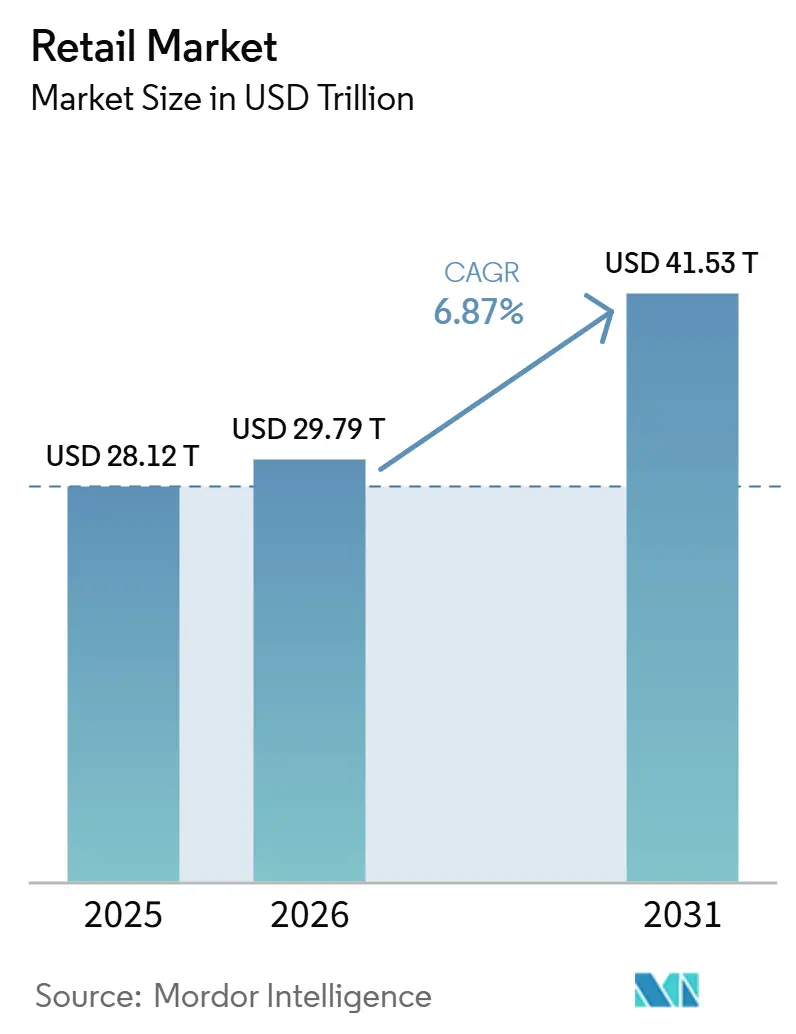
| Market Size (2026) | USD 29.79 Trillion |
| Market Size (2031) | USD 41.53 Trillion |
| Growth Rate (2026 - 2031) | 6.87% CAGR |
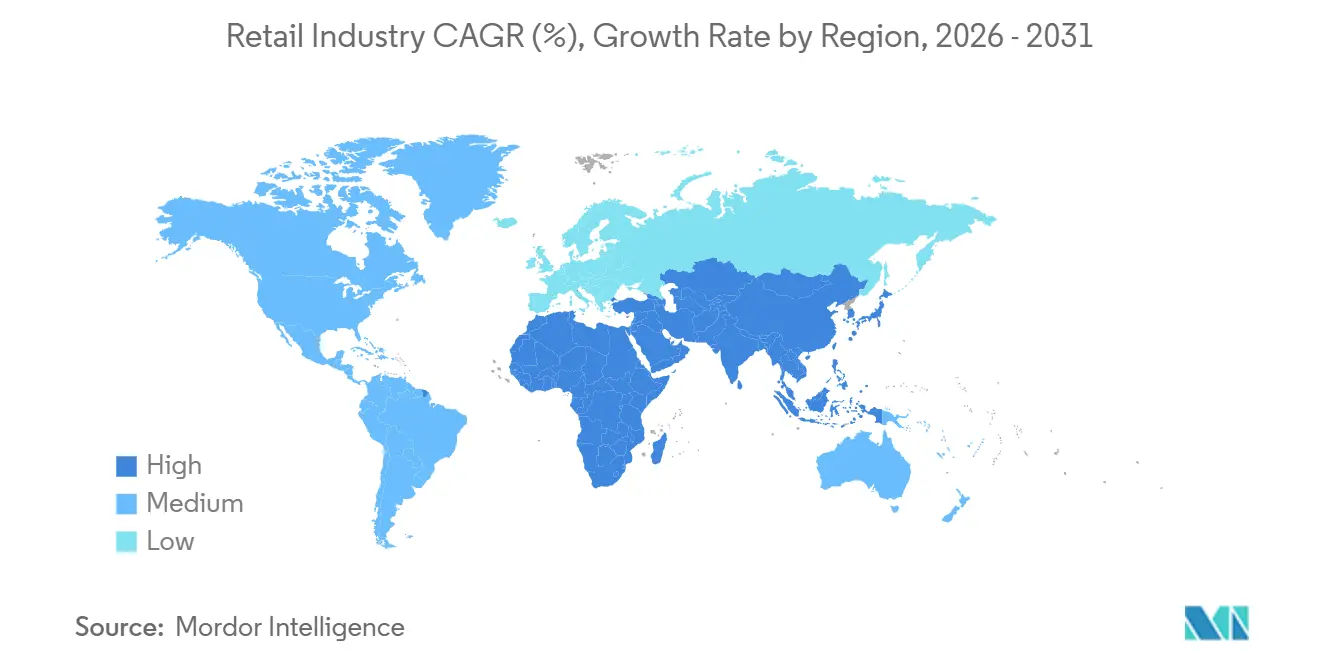
| Fastest Growing Market | Asia Pacific |
| Largest Market | North America |
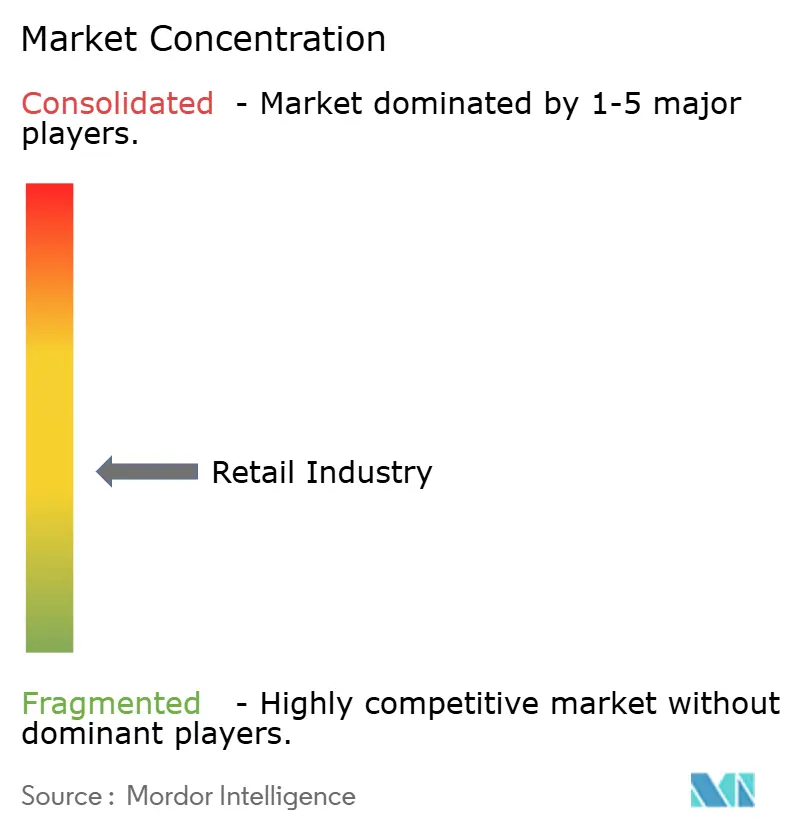
| Market Concentration | Medium |
Major Players *Disclaimer: Major Players sorted in no particular order Image © Mordor Intelligence. Reuse requires attribution under CC BY 4.0. | |
Retail Market Analysis by Mordor Intelligence
The Retail Market size is expected to grow from USD 28.12 trillion in 2025 to USD 29.79 trillion in 2026 and is forecast to reach USD 41.53 trillion by 2031 at 6.87% CAGR over 2026-2031.
Retail Market Growth is driven by rising urban middle‑class incomes, rapid e‑commerce and mobile penetration, data‑driven personalization, and AI‑enabled supply chains that improve availability, pricing, and customer experience. Sustainability, private labels, and experiential stores further accelerate sector expansion by differentiating retailers and deepening customer loyalty, even as value‑seeking behavior and cost pressures force continuous efficiency gains and innovation.
Key Report Takeaways
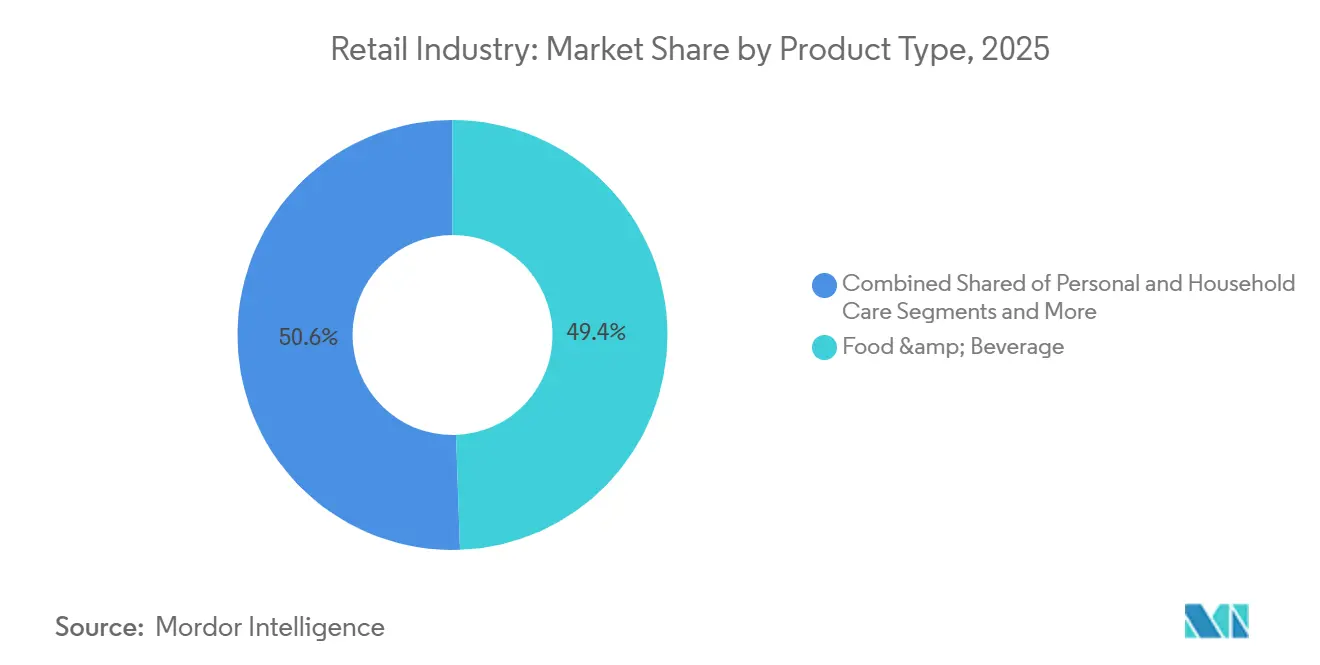
- By product type, food and beverages held 49.44% revenue share in 2025. Personal and household care recorded the highest projected growth at an 11.35% CAGR through 2031.
- By distribution channel, supermarkets and hypermarkets led with a 37.44% share in 2025. Online is forecast to expand at a 13.37% CAGR through 2031.
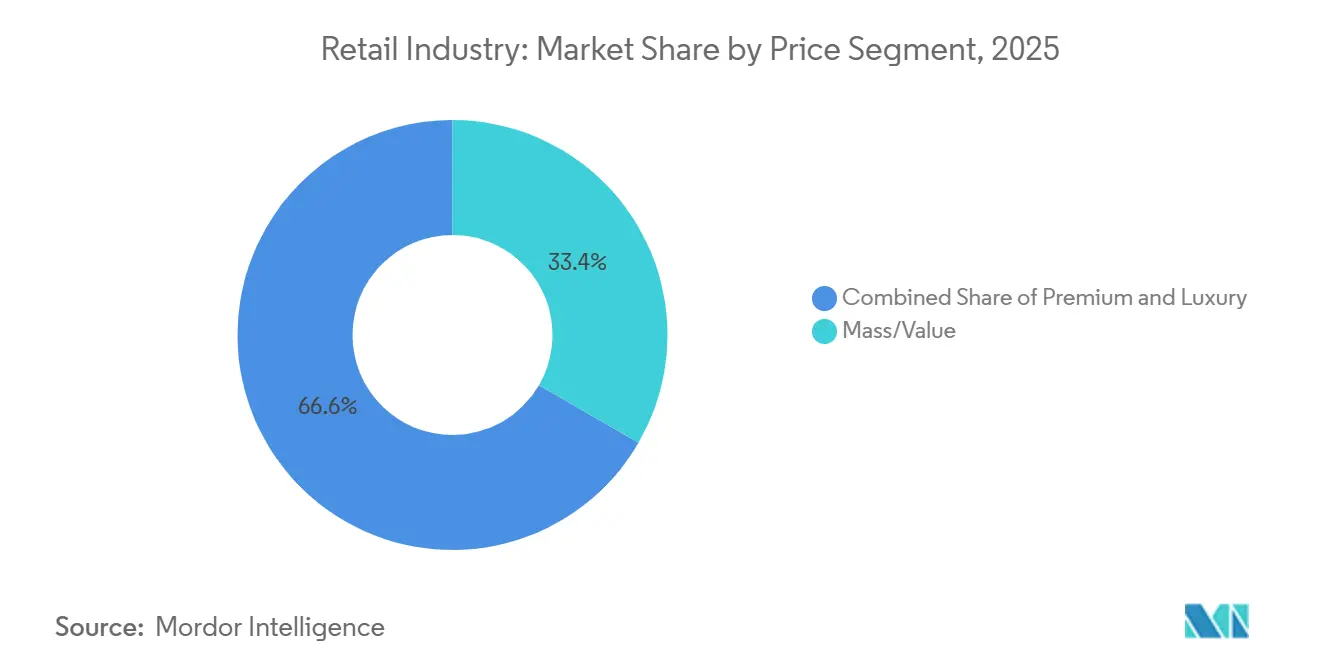
- By price segment, mass and value accounted for a 33.36% share in 2025. Premium is set to grow at a 10.47% CAGR through 2031.
- By store size, mid-format stores captured a 45.48% share in 2025. Large-format stores are projected to grow at a 9.58% CAGR through 2031.
- By geography, North America held a 34.43% share in 2025. Asia-Pacific is expected to post the fastest growth at an 11.73% CAGR through 2031.
Note: Market size and forecast figures in this report are generated using Mordor Intelligence’s proprietary estimation framework, updated with the latest available data and insights as of January 2026.
Global Retail Market Trends and Insights
Drivers Impact Analysis*
| Driver | (~) % Impact on CAGR Forecast | Geographic Relevance | Impact Timeline |
|---|---|---|---|
| Rise of e-commerce and omnichannel retailing | +2.3% | Global, with Asia-Pacific core leading at 20.2% CAGR, spill-over to North America and Europe | Medium term (2-4 years) |
| Growing urban middle class in emerging markets | +1.8% | Asia-Pacific, spill-over to Latin America and Middle East and Africa | Long term (≥ 4 years) |
| AI-powered personalization and retail analytics | +1.1% | North America and Europe are leading, expanding to Asia-Pacific | Short term (≤ 2 years) |
| Expansion of quick commerce and last-mile logistics | +0.9% | Global, concentrated in urban centers | Short term (≤ 2 years) |
| Retail-media network monetization boom | +0.7% | National, with early gains in the United States, the United Kingdom, and China | Medium term (2-4 years) |
| Gen-Z shoppertainment social commerce | +0.5% | Asia-Pacific core, expanding globally | Medium term (2-4 years) |
| Source: Mordor Intelligence | |||
Rise of E-commerce & Omnichannel Retailing
By the end of 2026, global online penetration will have increased as consumers increasingly opt for online platforms for routine purchases and favor hybrid baskets that combine delivery with in-store pickup. In 2025, online sales in the United States grew significantly, accounting for a notable share of the nation's total retail sales, highlighting the critical need for inventory visibility and swift operations. E-commerce penetration in China is high, with mobile transactions taking the lead, underscoring the pivotal roles of super-apps and embedded payments in driving basket growth. In 2025, same-day services expanded as Amazon broadened same-day delivery to more cities, and Walmart optimized its network to reach a majority of households in the United States in under three hours, enhancing conversions for time-sensitive purchases. As retailers evolve, treating stores as fulfillment hubs and streamlining back-end systems, the focus shifts from mere transactions to enriched experiences, amplifying long-term value in the global retail landscape.
Growing Urban Middle Class in Emerging Markets
Urbanization and wage gains across Asia-Pacific sustain consumption growth that supports modern trade penetration and convenience-led store formats. India’s retail sector was USD 952 billion in 2025, with a runway supported by organized retail expansion and a widening e-commerce base that is scaling logistics and payments. A growing set of global brands entered India in 2025, which raised competition across premium and luxury and improved assortment depth across malls and high streets. Household formation and urban density across Southeast Asia continue to pull forward convenience retail and social commerce, with mobile-first payments driving repeat purchase frequency. These structural gains continue to shape category mix and channel evolution in the global retail market.
AI-powered Personalization & Retail Analytics
Retailers expanded AI usage in 2025 to power discovery, dynamic merchandising, and better stock placement at the shelf and across micro-fulfillment sites. Walmart launched conversational commerce features with OpenAI and deployed generative assistants to streamline service and supply processes, while Amazon reported broad adoption of its AI shopping assistant with higher conversion and incremental sales lifts. Logistics leaders report AI-based routing efficiencies that trim delivery cost and distance, which helps fund faster service levels and drives repeat visits. Loyalty platforms use first-party data to build closed-loop measurement that links ads to receipts, which is central to retail media network performance for CPG suppliers. Retailers with AI governance and certification readiness gain trust advantages as customer-facing AI scales in the retail market.[1]Source: Walmart Corporate Newsroom Staff, “Walmart and OpenAI announce conversational commerce,” Walmart, corporate.walmart.com
Expansion of Quick Commerce & Last-Mile Logistics
Quick commerce availability increased in major metros, supported by dark stores, in-store picking, and rider density that shortens cycle time for urgent orders. In China, platforms like JD NOW execute high-velocity fulfillment from store networks across thousands of locations, which illustrates the scale benefits when retail and logistics are vertically integrated. Same-day segments in the United States expanded with diversified service tiers as retailers balance speed with cost to serve and push threshold-based promotions that fund delivery economics. Environmental and delivery-failure concerns steered more investment into micro-fulfillment and route optimization that reduces last-mile waste and improves first-attempt success. As retailers close the gap between browsing and receipt, replenishment categories generate higher purchase frequency and stickier engagement in the global retail industry. [2]Source: JD.com Investor Relations, “JD NOW and on-demand retail updates,” JD.com, ir.jd.com
Restraints Impact Analysis*
| Restraint | (~) % Impact on CAGR Forecast | Geographic Relevance | Impact Timeline |
|---|---|---|---|
| Supply-chain disruptions and freight volatility | -1.4% | Global, with acute impacts on China–United States–Europe trade corridors | Short term (≤ 2 years) |
| Margin squeeze from price wars | -0.9% | Global, intensifying in e-commerce and discount segments | Medium term (2-4 years) |
| Escalating data privacy regulation | -0.4% | Europe, United States, expanding to Asia-Pacific | Medium term (2-4 years) |
| Tech-talent shortage for automation roll-outs | -0.3% | Global, most acute in North America and Western Europe | Long term (≥ 4 years) |
| Source: Mordor Intelligence | |||
Supply-chain Disruptions & Freight Volatility
Global supply chains experienced persistent stress from geopolitical flashpoints and weather disruptions that complicated routing and inventory positioning. Red Sea disruptions extended transit times and pushed up container prices on some lanes, which led retailers to carry higher buffers and reposition safety stock to protect service. The Panama Canal faced throughput constraints due to water level issues, which required booking and scheduling adjustments by shippers. Retailers diversified build through dual sourcing, nearshoring steps, and regionalized fulfillment footprints to reduce single-point exposure. Policy changes and labor actions at ports kept risk elevated, which sustained a cautious stance on lead-time and reorder triggers in the global retail market.[3]Source: United Nations Conference on Trade and Development Editors, “Red Sea disruptions and shipping,” UNCTAD, unctad.org
Margin Squeeze from Price Wars
Frequent price matching online and rising use of comparison tools have trained shoppers to chase the lowest basket cost, which has elevated acquisition expense while depressing lifetime value. Intense discounting in e-commerce reduced per-order profitability as shipping and returns costs remained high, which hurt smaller retailers with less leverage. Food price normalization in 2025 reduced pricing power for grocers, which raised the importance of mix and private labels to support margin. Value formats gained share while mid-tier department stores lost traffic, which widened the split between premium and mass formats. The result is a strategic tilt toward higher-margin services such as retail media, paid membership, and subscriptions in the retail market.[4]Source: U.S. Census Bureau Staff, “Quarterly Retail E-Commerce Sales,” U.S. Census Bureau, census.gov
*Our forecasts treat driver/restraint impacts as directional, not additive. The impact forecasts reflect baseline growth, mix effects, and variable interactions.
Segment Analysis
By Product Type: Personal Care Propels Growth as Food Remains Foundation
Food and beverages held a 49.44% retail market share in 2025 and continue to anchor essential traffic and repeat purchase behavior across value, mid, and premium baskets. The beauty, personal, and household care cluster is the fastest-growing at an 11.35% CAGR through 2031 as consumers lean into wellness, ingredient transparency, and refill formats. U.S. food-at-home price pressures eased in 2025 after the prior spike, which stabilized trip frequency while private labels expanded their reach on perceived value. Innovation cycles in beauty and personal care accelerated with a broader range of launches, and refill packaging reduced plastic intensity in mass and premium shampoos. These shifts lift penetration and spend per buyer for nonfood essentials, and they add resilience to category mix in the retail market.
The balance of demand in apparel, footwear, and accessories reflects trading down among aspirational shoppers and steady gains in value fashion, supported by omnichannel services. Consumer electronics showed strong online momentum, while many buyers still prefer store experiences for high consideration devices due to demo and assisted selling. Furniture and home improvement categories benefited from ongoing hybrid work and home projects, while cost advantages in some Middle Eastern markets improved price competitiveness for energy-intensive goods. Retail buyers now expect superior quality controls, including ISO 22716 in personal care sourcing and consistent safety standards in food and beverage manufacturing. Growth pockets within beauty and hygiene strengthen basket mix and repeat frequency, which supports the global retail market size for higher-margin staples.


By Distribution Channel: Online Surges While Physical Stores Anchor Revenue
Supermarkets and hypermarkets captured a 37.44% retail market share in 2025 and remain critical for weekly stock-up trips, fresh categories, and mass reach across cities and towns. The online channel is the fastest-growing at a 13.37% CAGR through 2031, supported by mobile-first journeys, payment ubiquity, and faster delivery windows that match immediate needs. In the United States, e-commerce represented 16.13% of retail sales in 2025, while China continues to outpace peers with mobile transactions forming the bulk of digital orders. Store fleets have become hubs for pickup, returns, and same-day fulfillment, which strengthens conversion and reduces last-mile cost. With stores serving as experience and service centers, omnichannel models continue to shape the global retail industry.
Shopping center vacancy in the United States fell to multi-decade lows by late 2025 as well-located centers drew stronger tenant mixes and higher sales per square foot. Convenience-led formats across Southeast Asia gained share through smaller footprints and curated assortments that align with frequent top-up missions. Department stores and some specialty chains contracted as value formats captured traffic through everyday low price strategies and curated treasure-hunt assortments. Retail-as-a-service models and new checkout options add flexibility and reduce friction, which helps move baskets across digital and store endpoints. These adaptations improve operating leverage and throughput per site, which supports expansion in the retail industry.
By Price Segment: Premium Growth Masks Mass Market Struggles
Mass and value accounted for 33.36% of 2025 revenue as price-sensitive households prioritized savings and private label gains. Premium segments posted the fastest trajectory at a 10.47% CAGR through 2031 due to trade-up dynamics among higher-income cohorts and stronger brand storytelling around quality and sustainability. Value retailers and off-price leaders gained traffic share as shoppers compared prices in real time and moved across banners to save on weekly baskets. Premium beauty and luxury continued to outperform in the Gulf as tourism and household wealth supported steady demand despite broader volatility. This bifurcation added stress to mid-market banners, while premium entrants accelerated footprint and experiential formats within the global retail market.
Private labels gained share as retailers invested in packaging, ingredient quality, and better shelf presentation to bridge value and premium. Mid-tier retailers faced footprint rightsizing, and some chains announced multi-year closure plans while reinvesting in growth corridors and higher productivity locations. Certifications such as ISO 9001 and fair-trade labeling strengthened trust for premium shoppers who are willing to pay higher prices for verified standards. The spread between value-driven and premium-driven baskets remained wide, which encouraged price architecture strategies that meet needs across income tiers. These patterns continue to define merchandising and margin strategies in the retail market.
By Store Size: Mid-Format Dominates as Large Formats Consolidate
Mid-format stores, between 400 and 2,500 square meters, held a 45.48% retail market share in 2025 with a balance of breadth, local relevance, and operating efficiency. Large-format sites above 2,500 square meters are the fastest-growing at a 9.58% CAGR through 2031 as banners consolidate locations into higher volume destinations that double as fulfillment hubs. Retailers announced large-format openings in 2025 to serve higher trip missions and omnichannel flows, with expansion plans spanning several years. Pro-focused home improvement chains advanced platform strategies through acquisitions that integrated distribution networks with retail footprints. These moves protect service density and improve throughput for bulk and project categories in the global retail market.
Small and micro formats thrive in dense urban corridors due to proximity and top-up shopping, with Southeast Asia’s neighborhood chains as prominent examples. Retail real estate pipelines in India highlight a supply gap in Grade-A malls, which is attracting capital and new brand entrants to top cities. Partnerships drive traffic through store-within-store and service zones as retailers convert square footage into multipurpose spaces for pickup, returns, and events. Accessibility and occupational safety standards are becoming standard in planning for large sites, which helps footfall and customer experience. This format diversification expands missions per store and improves network economics within the global retail industry.
Geography Analysis
Asia-Pacific is the fastest-growing region at an 11.73% CAGR through 2031, led by middle-class expansion, urban density, and mobile-native commerce adoption. India’s retail sector reached a significant valuation in 2025 and is on track to scale organized retail and e-commerce while adding high-quality mall stock across major metros. India welcomed more global brands in 2025, which broadened category depth and upgraded retail experiences across luxury and premium. Platforms in China scaled quick commerce tied to brick-and-mortar networks that fulfill within minutes across counties and cities. These developments elevate service levels and choice in the region and reinforce the global retail market.
North America held a 34.43% share in 2025 with mature omnichannel capabilities and high spending power, though growth is normalizing. U.S. nonstore sales grew faster than total retail in late 2025, and holiday-level spend underscored resiliency even as inflation trends shaped discretionary budgets. Retailers adjusted footprints by closing underperforming sites and reinvesting in high conversion stores and digital fulfillment. Canada navigated trade tensions and the restructuring of legacy retailers, while Mexico recorded strong online growth supported by social commerce and marketplace adoption. This regional balance underscores the importance of productivity and service differentiation in the global retail industry.
Europe recovered at a measured pace with in-store sales gains modest relative to digital adoption and tourism-led lifts in major cities. Prime vacancy stabilized while rents in select high streets and shopping centers trended up, supported by luxury and fashion openings in core districts. Value banners outperformed as affordability remained a priority for many households, while GDPR compliance continued to influence data and marketing execution. The United Kingdom’s online market remained concentrated, while mobile sustained most digital transactions. These dynamics maintain steady but selective growth narratives for banners positioned on price, experience, or both in the retail market.

Competitive Landscape
Competitive intensity stayed high as omnichannel leaders invested in AI, delivery speed, and retail media to widen moats. Amazon’s advertising services revenue reached a sizable base by 2025, and Walmart Connect grew at a double-digit pace in 2025, which signaled the strategic value of first-party data and closed-loop measurement. Walmart partnered with OpenAI to roll out conversational commerce features, while Amazon scaled its AI assistant to lift discovery and conversion. Membership clubs leveraged fee income to support lean merchandising margins and defend cost advantages across fresh, grocery, and general merchandise. These moves shape operating models and reinforce differentiation in the global retail market.
Pro home improvement chains expanded their addressable market through acquisitions that integrated wholesale distribution with retail networks. The Home Depot’s SRS Distribution acquisition boosted its pro contractor proposition, and peer investments in B2B platforms strengthen account-level value propositions. Sporting goods consolidation and banner integrations pursued scale benefits in footprint, vendor relationships, and urban access. Store estates continue to adapt as successful retailers structure locations as experience centers and rapid fulfillment nodes for a higher mix and faster flow. Execution at the store and supply chain interface remains a key differentiator in the retail industry.
Retail media networks matured into a core profit lever across food, mass, and specialty, with strong growth in the United States and rising traction in Europe and Asia. Advertisers prioritized first-party data access and closed-loop reporting, although fragmentation and data governance remain challenges. Partnerships and white-label platforms accelerated deployment by retailers that prefer speed to market over building in-house. In fast-growing markets like India and Latin America, regional champions leveraged local infrastructure and policy knowledge to compete with global platforms. Technology-enabled vertical integration and delivery density continue to underpin the advantage in the global retail market.
Retail Industry Leaders
Walmart Inc.
Amazon Inc.
Costco Wholesale Corporation
Schwarz Group
Alibaba Group
- *Disclaimer: Major Players sorted in no particular order

Recent Industry Developments
- December 2025: Walmart announced it moved its stock listing from the NYSE to Nasdaq on December 9, 2025, aligning with its growing e-commerce and AI-driven retail transformation and signaling strategic positioning alongside tech-oriented companies rather than traditional grocers.
- December 2025: Amazon announced plans to invest more than USD 35 billion in India through 2030, focusing on expansion across business segments including infrastructure, AI-driven digitisation, and logistics, reinforcing the company’s long-term strategic commitment to India’s digital economy.
- November 2025: Following its acquisition of Foot Locker, Dick’s announced plans to close a number of underperforming Foot Locker locations as part of restructuring efforts intended to streamline operations and improve profitability heading into 2026.
- September 2025: Dick’s Sporting Goods finalized its USD 2.4 billion acquisition of Foot Locker on September 8, 2025, expanding its global retail footprint to over 3,200 stores and strengthening its position in the footwear and sports apparel market.


Research Methodology Framework and Report Scope
Market Definitions and Key Coverage
Our analysts treat the global retail industry as the total invoiced value of finished goods sold to final consumers through store-based, non-store, and omnichannel formats, covering food, beverage, apparel, consumer durables, and everyday essentials. We count sales booked in the country where the transaction takes place, net of returns and inclusive of taxes.
Scope exclusion: pure wholesale trade and strictly B2B online marketplaces are not included.
Segmentation Overview
- By Product Type
- Food & Beverage
- Personal & Household Care
- Apparel
- Footwear & Accessories
- Furniture
- Toys & Hobbies
- Electronics & Household Appliances
- Other Products
- By Distribution Channel
- Supermarkets / Hypermarkets
- Convenience Stores
- Department Stores
- Specialty Stores
- Online
- Other Channels
- By Price Segment
- Mass / Value
- Premium
- Luxury
- By Store Size
- Large-Format (Greater than 2,500 sq. m)
- Mid-Format (400-2,500 sq. m)
- Small / Micro (Less than 400 sq.m)
- By Geography
- North America
- Canada
- United States
- Mexico
- South America
- Brazil
- Peru
- Chile
- Argentina
- Rest of South America
- Asia-Pacific
- India
- China
- Japan
- Australia
- South Korea
- South-East Asia (Singapore, Malaysia, Thailand, Indonesia, Vietnam, Philippines)
- Rest of Asia-Pacific
- Europe
- United Kingdom
- Germany
- France
- Spain
- Italy
- BENELUX (Belgium, Netherlands, Luxembourg)
- NORDICS (Denmark, Finland, Iceland, Norway, Sweden)
- Rest of Europe
- Middle East & Africa
- United Arab Emirates
- Saudi Arabia
- South Africa
- Nigeria
- Rest of Middle East & Africa
- North America
Detailed Research Methodology and Data Validation
Primary Research
Senior merchandisers, real-estate heads, and digital-commerce leads across North America, Europe, Asia-Pacific, the Gulf, and Latin America were interviewed or surveyed. Their inputs refine price-point ladders, promotional intensity, and the pace at which cashless and same-day delivery options permeate each region, letting us adjust assumptions that pure desk work cannot surface.
Desk Research
We first map the demand pool using publicly available macro and trade statistics drawn from agencies such as the UN Statistics Division, the US Census Monthly Retail Trade Survey, Eurostat's retail turnover index, China's National Bureau of Statistics, and the WTO's customs data, which anchor national sales and cross-border flows. According to Mordor analysts, supplemental trend signals are pulled from OECD household-consumption tables, the National Retail Federation, and regional retail councils, giving us an up-to-date view on channel mix and shopper behavior.
Company 10-Ks, investor decks, and selected media coverage housed in Dow Jones Factiva and D&B Hoovers flesh out format economics, gross margins, and store-count additions that secondary sources often leave blank. The sources named here illustrate our wider evidence set; many other verified documents were consulted to round out the picture.
Market-Sizing & Forecasting
The model begins with a top-down reconstruction of national retail sales, converting official local-currency series to USD and aligning them with household spending and disposable-income growth. These totals are then pressure-tested through selective bottom-up checks on listed retailers' revenue, sample average-selling-price × volume math, and mall floor-space additions before the final number is locked. Key variables like e-commerce penetration, wage inflation, food price shifts, urban population share, and store-opening pipelines feed a multivariate regression, while scenario analysis captures policy or supply-chain shocks.
Where bottom-up gaps appear (for example, in markets with sparse reporting), we apply region-specific penetration ratios that have been validated during expert calls, thereby preventing over or under estimation.
Data Validation & Update Cycle
Outputs pass a three-layer review that screens for variance against historical run rates, peer ratios, and external economic indicators. Any anomaly loops back to source re-checks before sign-off. Reports refresh every twelve months, and material events, such as currency moves, tax shifts, or major M&A, trigger an interim update so clients receive the latest calibrated view.
Why Mordor's Retail Industry Size & Share Analysis Baseline Commands Reliability
Published figures often diverge because researchers choose different channel scopes, currency conversions, and refresh cadences, and because some models lean heavily on untested assumptions.
Key gap drivers include whether informal kiosks are counted, how online cross-border sales are apportioned, and if aggressive same-store-sales multipliers are applied for fast-growing regions. Mordor's study fixes exchange rates at the average of the reporting year, excludes wholesale pass-through revenue, and rolls forecasts every quarter, minimizing drift.
Benchmark comparison
| Market Size | Anonymized source | Primary gap driver |
|---|---|---|
| USD 27.26 trillion | Mordor Intelligence | - |
| USD 34.86 trillion | Regional Consultancy A | Includes business-to-business resale and applies static 2022 exchange rates |
| USD 25.00 trillion | Global Consultancy B | Omits online cross-border transactions and uses conservative e-commerce growth multipliers |
These contrasts show that, by selecting a balanced scope and refreshing inputs frequently, Mordor Intelligence delivers numbers clients can trace to transparent variables and reproduce with confidence.


Key Questions Answered in the Report
What is the global retail market size in 2026 and the projected 2031 value?
The global retail market size is USD 29.79 trillion in 2026 and is expected to reach USD 41.53 trillion by 2031 at a 6.87% CAGR.
Which product categories lead and which are growing fastest worldwide?
Food and beverages lead with a 49.44% share in 2025, while personal and household care are forecast to grow fastest at an 11.35% CAGR through 2031.
Which channels are expanding fastest, and how are stores evolving?
Online is the fastest-growing channel at a 13.37% CAGR through 2031, while stores operate as experience centers and fulfillment hubs to support omnichannel flow.
Which regions show the strongest growth outlook to 2031?
Asia-Pacific is the fastest-growing region at an 11.73% CAGR, while North America held a 34.43% share in 2025.
How are AI and retail media changing retail economics?
AI improves discovery, routing, and inventory accuracy while retail media monetizes first-party data at higher margins than merchandising, strengthening profit mix.
How is India shaping the global retail opportunity through 2031?
India is scaling organized retail and e-commerce with stronger brand entry and new mall supply across major cities, helping drive APAC’s lead in growth.
Page last updated on:


