Hypermarket Market Size and Share
Market Overview
| Study Period | 2020 - 2031 |
|---|---|
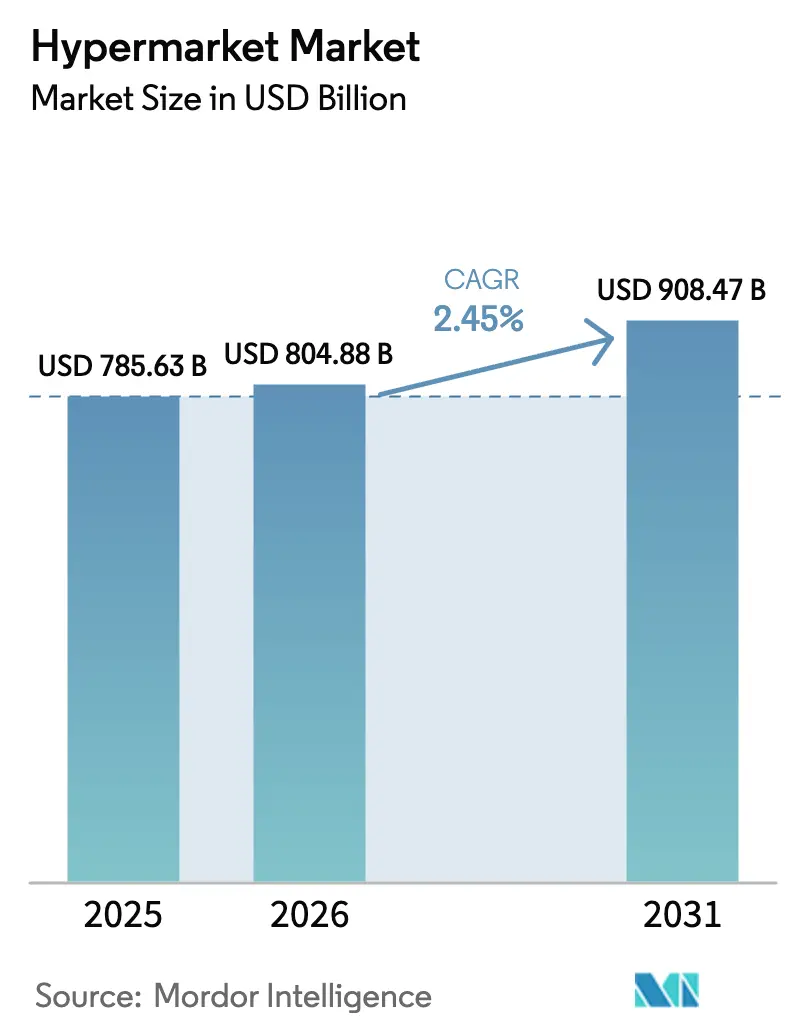
| Market Size (2026) | USD 804.88 Billion |
| Market Size (2031) | USD 908.47 Billion |
| Growth Rate (2026 - 2031) | 2.45% CAGR |
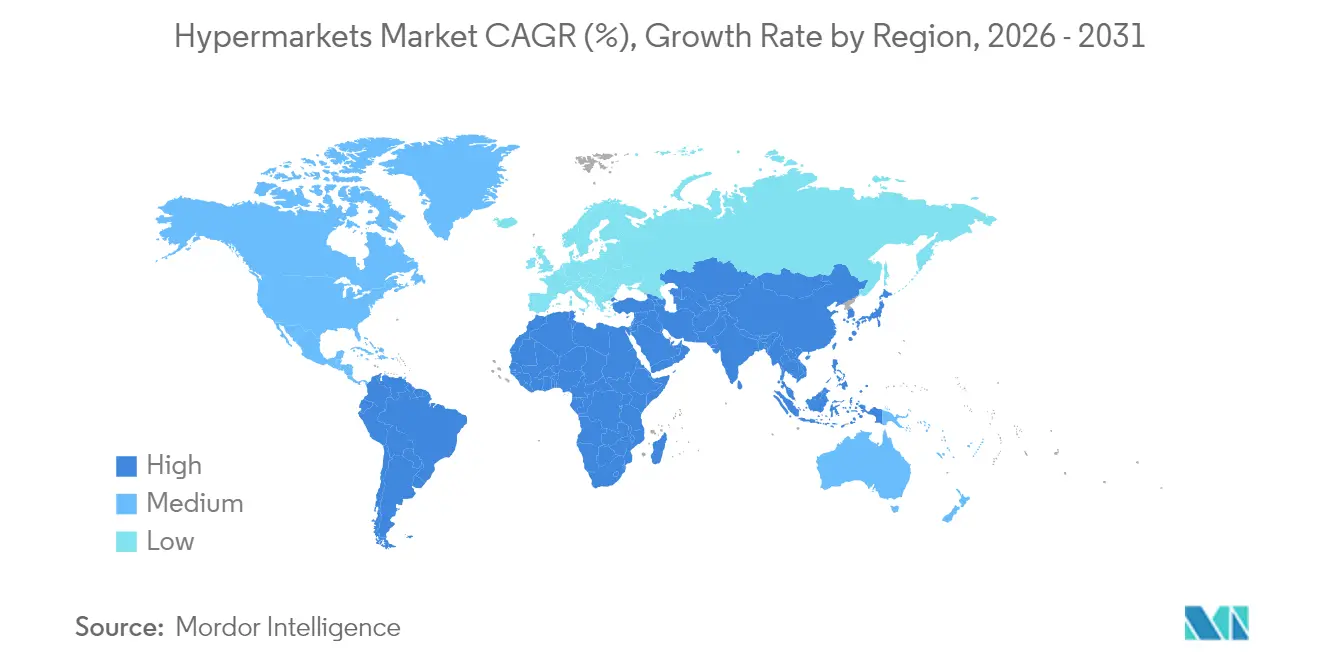
| Fastest Growing Market | Asia-Pacific |
| Largest Market | Europe |
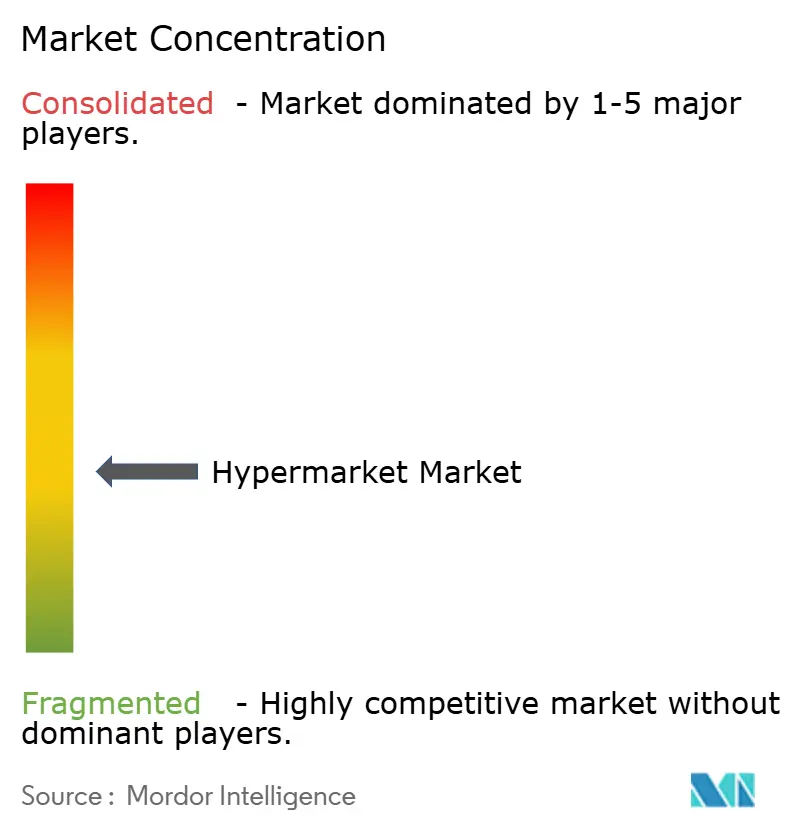
| Market Concentration | Medium |
Major Players *Disclaimer: Major Players sorted in no particular order Image © Mordor Intelligence. Reuse requires attribution under CC BY 4.0. | |
Hypermarket Market Analysis by Mordor Intelligence
hypermarket market size in 2026 is estimated at USD 804.88 billion, growing from 2025 value of USD 785.63 billion with 2031 projections showing USD 908.47 billion, growing at 2.45% CAGR over 2026-2031. Sustained demand for one-stop shopping, investments in micro-fulfilment, and format optimisation offset competitive pressure from discount banners and pure-play e-commerce. Continuous urban migration, highlighted by the United Nations identifying Asia–Pacific as the principal contributor to global city-dweller growth, underpins new store openings [1]Source: United Nations Department of Economic and Social Affairs, “World Urbanization Prospects 2024 Revision,” un.org. . Operators also align with consumer expectations for sustainable sourcing, lower prices, and seamless omnichannel journeys that blend click-and-collect with in-store experiences. Competitive intensity nonetheless heightens as discounters enlarge footprints and zoning rules raise hurdles for new large-box projects.
Key Report Takeaways
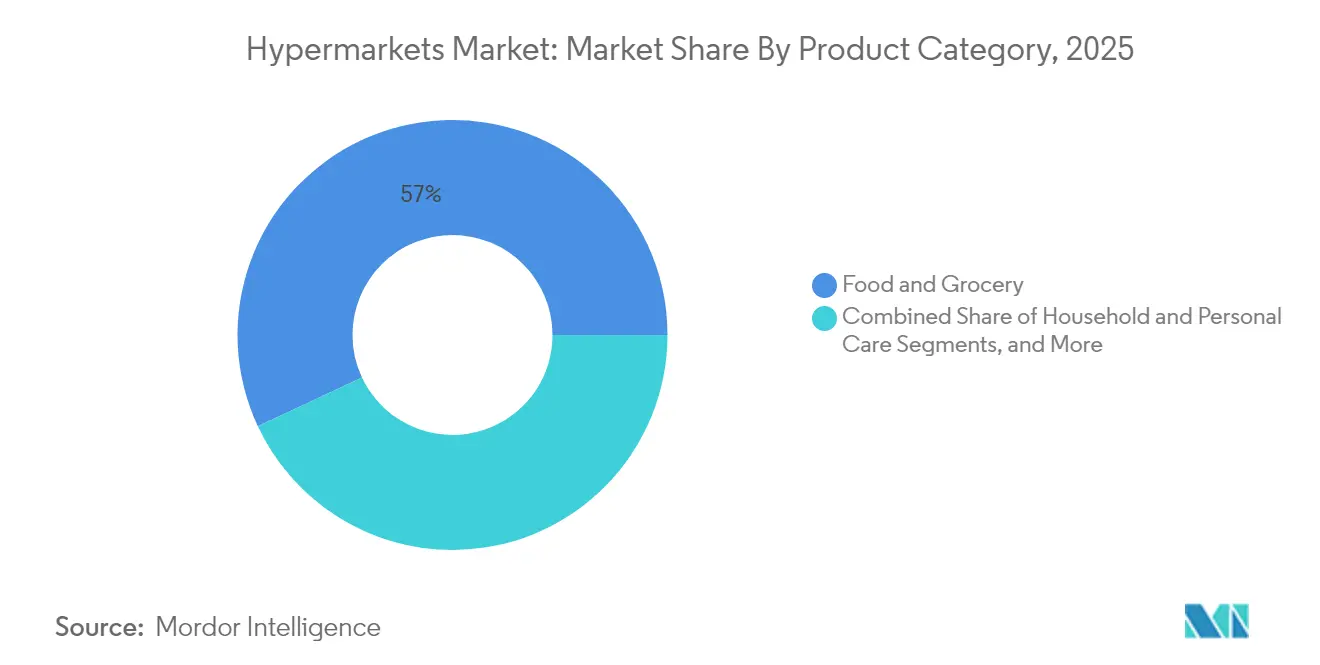
- By product category, food and grocery led with 56.98% of hypermarket market share in 2025; Consumer Electronics is projected to advance at a 6.18% CAGR through 2031.
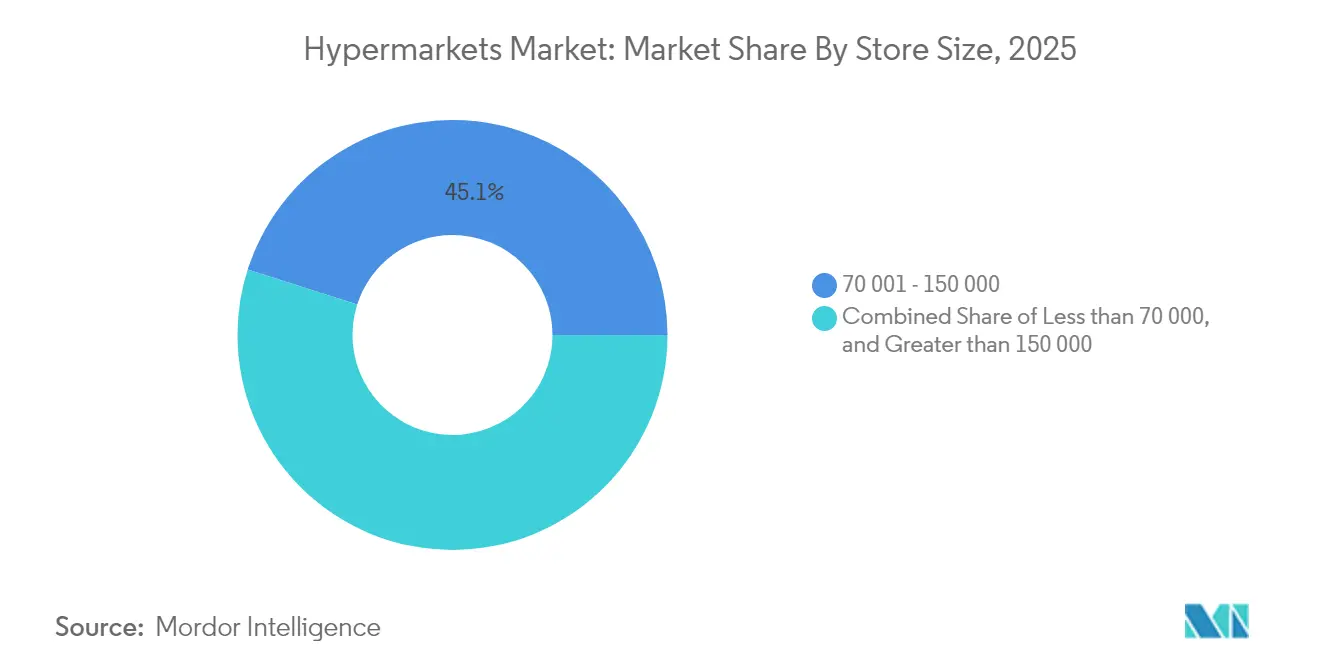
- By store size, the 70,001–150,000 sq ft format held 45.08% of the hypermarket market size in 2025, while ≤70,000 sq ft stores are poised for a 6.82% CAGR to 2031.
- By ownership model, publicly listed chains accounted for 62.56% of the hypermarket market size in 2025; franchise-operated outlets exhibit the strongest 7.34% CAGR outlook.
- By geography, Asia–Pacific captured 33.88% of the hypermarket market share in 2025, whereas the Middle East and Africa region is expected to post a 8.82% CAGR to 2031.
- Top 5 companies such as Walmart Inc., Carrefour SA, Costco Wholesale Corp., Tesco PLC, Kroger Co. hold significant market share in 2024.
Note: Market size and forecast figures in this report are generated using Mordor Intelligence’s proprietary estimation framework, updated with the latest available data and insights as of 2026.
Global Hypermarket Market Trends and Insights
Drivers Impact Analysis*
| Driver | (~) % Impact on CAGR Forecast | Geographic Relevance | Impact Timeline |
|---|---|---|---|
| Urbanization and rising disposable income | +0.8% | APAC core, spill-over to MEA | Long term (≥ 4 years) |
| Expansion of private-label FMCG ranges | +0.5% | Global, with EU leadership | Medium term (2-4 years) |
| Omnichannel and click-and-collect adoption | +0.4% | North America and EU, expanding to APAC | Short term (≤ 2 years) |
| Supply-chain digitization and automation | +0.3% | Global, led by developed markets | Medium term (2-4 years) |
| Micro-fulfilment hubs inside hypermarkets | +0.2% | Urban centers globally | Medium term (2-4 years) |
| Experiential in-store retail formats | +0.1% | Premium markets in NA, EU, APAC | Long term (≥ 4 years) |
| Source: Mordor Intelligence | |||
Expansion of Private-Label FMCG Ranges
Private label penetration reached 39.1% of European grocery sales in 2024, with projections indicating 40-42% by 2030, fundamentally altering hypermarket economics through improved margins and customer loyalty. Private labels boost gross margins and build loyalty, prompting hypermarket operators to dedicate shelf space and R&D budgets to store brands. High brand control lets retailers tailor pack sizes for value seekers and trial sustainable packaging that meets ESG mandates. Success hinges on robust auditing and supplier development programs, competencies that favor well-capitalized chains over smaller rivals.
Omnichannel and Click-and-Collect Adoption
In 2024, more than 80% of grocery transactions still occurred in physical stores, yet the majority of purchasing decisions were digitally influenced. Click-and-collect leverages existing store networks, trimming last-mile delivery expense while keeping margins healthier than pure delivery models. Carrefour’s online GMV reached EUR 5.9 billion in 2024, illustrating how the hypermarket market meshes physical assets with digital convenience. The approach also helps cushion footfall erosion as shoppers alternate between online baskets for bulky items and quick trips for fresh foods. The model also aligns with U.S. Department of Agriculture findings that consumers increasingly value time-saving collection services in food retail.[2]Source: U.S. Food and Drug Administration, “FSMA Section 204: Food Traceability Final Rule,” fda.gov
Micro-Fulfilment Hubs Inside Hypermarket
Carving out 10,000 sq ft for micro-fulfilment robots allows a 70,000 sq ft store to service a 15-minute delivery radius without new real estate. This re-purpose taps existing utilities, mitigates zoning hurdles, and increases inventory turns. Retailers simultaneously shorten pick times for click-and-collect orders, strengthening omnichannel propositions. However, dense automation demands stable power and advanced inventory orchestration that some legacy buildings need retrofits to support.
E-commerce Cannibalization of Footfall
Online grocery penetration has retreated from pandemic highs yet remains structurally higher than pre-2020, locking in lower footfall for hypermarket in electronics, apparel, and health-beauty aisles. Consumer surveys by industry association FMI show half of shoppers now rely on digital coupons, signaling an entrenched omnichannel mindset. Operators that fail to unify inventory visibility and pricing across channels risk losing share. Nevertheless, fresh categories still benefit from tactile inspection, providing a traffic anchor that digital-first rivals struggle to replicate.
Restraints Impact Analysis*
| Restraint | (~) % Impact on CAGR Forecast | Geographic Relevance | Impact Timeline |
|---|---|---|---|
| E-commerce cannibalization of footfall | -0.6% | Global, most acute in developed markets | Short term (≤ 2 years) |
| Discount and convenience format competition | -0.4% | Europe and North America primarily | Medium term (2-4 years) |
| Zoning shifts curbing large box builds | -0.3% | Urban centers globally, strongest in EU | Long term (≥ 4 years) |
| Sustainability-linked finance constraints | -0.2% | Global, led by ESG-focused markets | Medium term (2-4 years) |
| Source: Mordor Intelligence | |||
Zoning Shifts Curbing Large-Box Builds
Municipalities increasingly favour mixed-use projects over standalone big-box venues to advance urban densification goals. For example, the European Commission’s Urban Agenda encourages compact development that can constrain hypermarket blueprints [3]Source: European Commission, “Urban Agenda for the EU – Retail in Cities,” ec.europa.eu. . Securing permits for more than 150,000 sq ft footprints thus takes longer and may impose green-building mandates that lift capex. These trends nudge expansion toward mid-format or multi-level concepts integrated with residential towers. Retailers must master space-efficient planograms and vertical logistics to preserve assortment breadth within tighter shelves.
Sustainability-Linked Finance Constraints
Green bonds and sustainability-linked loans often stipulate caps on energy intensity and food-waste ratios. Operators falling short may face higher interest spreads or reduced credit access. Capital-intensive refrigeration upgrades and renewable-energy investments become prerequisites to unlock favorable terms. Chains that already embed science-based targets enjoy financing advantages, while laggards encounter a rising cost of capital that slows refurbishment cycles and network growth.
*Our forecasts treat driver/restraint impacts as directional, not additive. The impact forecasts reflect baseline growth, mix effects, and variable interactions.
Segment Analysis
By Product Category: Food Dominance Amid Electronics Growth
Food and Grocery commanded 56.98% hypermarket market share in 2025 and remains the traffic linchpin that anchors weekly shopping missions. High-turnover staples secure supplier funding for promotions and guarantee footfall, although margins stay thin. Consumer Electronics recorded the swiftest 6.18% CAGR and lifts basket value when shoppers refresh smartphones, gaming consoles, or small appliances. Household and Personal Care perform steadily, buoyed by private-label rollouts that widen choice and price points. Apparel and Accessories under-index amid fashion-forward competition, while Home Appliances benefit from urban renovations and energy-efficient upgrades.
The hypermarket market calibrates space to balance frequency and profitability. Fresh produce sections occupy the front-of-store to capture immediate needs, whereas electronics and appliances reside deeper to encourage longer journeys. Vendor partnerships finance demo areas that transform stores into discovery hubs, reducing online comparison shopping. Still, original-equipment manufacturers selling direct and specialty electronics chains compress hypermarket margins, compelling chains to bolster after-sales services and bundle offers to retain share.


By Store Size: Mid-Format Optimization Drives Efficiency
The 70,001–150,000 sq ft bracket represented 45.08% of the hypermarket market size in 2025, reflecting a sweet spot that preserves assortment while containing utilities and labor overheads. Operators retrofit legacy giants into this range by sub-leasing unused wings or inserting micro-fulfilment pods. Smaller ≤70,000 sq ft concepts, predicted to grow 6.82% annually, capture dense urban micro-markets where real-estate premiums deter expansive builds. They rely on high inventory turnover, shrinkage controls, and digital shelf labelling to maintain economics.
Hypermarket market share for super-large boxes above 150,000 sq ft is slipping as zoning hurdles rise and shoppers favor quick missions. Yet these giants still work in commuter belts with ample parking and family clientele seeking full-basket stock-ups. Chains therefore orchestrate a hub-and-spoke model where large suburban stores act as fulfilment hubs feeding smaller urban satellites, spreading logistics costs and elevating service levels.
By Ownership Model: Franchise Expansion Accelerates Growth
Publicly listed chains retained 62.56% hypermarket market size in 2025, debt market access and sophisticated supply chains. Franchise-operated outlets, projected to expand 7.34% annually, offer capital-light acceleration into new catchments and tap local market savvy. Cooperative banners remain relevant where community ownership underpins loyalty, while privately owned networks feel funding strain for IT and ESG retrofits.
Franchising lifts brand presence but risks execution variance. Leading chains mitigate this through centralized procurement, shared training academies, and real-time performance dashboards. Hypermarket market share gains accrue to franchisors that scale these systems effectively, converting local entrepreneurs into allies rather than competitors.
Geography Analysis
Asia–Pacific accounted for 33.88% hypermarket market share in 2025, underpinned by rapid urban migration and expanding middle-class wallets. Organized retail continues to replace informal wet markets, and governments channel infrastructure spending toward suburban ring roads that improve hypermarket accessibility. Retail property research shows that Chinese retail transaction volumes held firm even as other commercial sectors softened, an indicator of sector resilience. Operators must still navigate provincial regulations and fragmented supplier bases, spurring partnerships with local distributors to ensure consistent product flow.
The Middle East and Africa region is set to deliver a 8.82% CAGR by 2031, the fastest globally. Economic diversification programs in Gulf Cooperation Council states nurture modern trade, while young demographics gravitate to international grocery standards. The UAE commands a USD 40 billion grocery sector, and Saudi Arabia stands at USD 62 billion, providing scale for hypermarket entrants. Franchise structures and joint ventures ease regulatory entry, as illustrated by regional players listing domestically to fund expansions. Yet import dependency exposes margins to currency volatility and global supply disruptions, making resilient procurement strategies essential.
North America and Europe register modest growth as markets mature. Private-label penetration deepens and sustainability regulations tighten, pushing chains toward energy-saving refrigeration and food-waste analytics. Discounter presence is entrenched in Germany, the Netherlands, and increasingly the United States where Aldi surpassed 2,400 stores in 2024. Hypermarkets respond with store refurbishments, fresh-food theatre, and loyalty app upgrades to preserve share. While hypermarket market growth is slower, the regions remain profitable due to higher basket values and established supply chains.

Competitive Landscape
The hypermarket market is moderately concentrated. Walmart leads with USD 676 billion revenue and 10,692 outlets across 27 nations, wielding data-driven replenishment and a rapidly scaling marketplace for third-party sellers. Carrefour ranks among the top European players, blending hypermarkets, convenience stores, and an expanding digital ecosystem. In Asia–Pacific, Aeon, Reliance Retail, and CP-All harness local logistics to defend domestic turf.
Strategic focus gravitates to technology and sustainability. Chains plan quadruple jumps in AI spending to unlock USD 113 billion in efficiencies, covering areas from predictive ordering to dynamic staffing. Discounters Aldi and Lidl captured 38% of German grocery sales in 2024, proving that streamlined ranges and aggressive pricing resonate with value-driven shoppers. Hypermarkets counter with tiered private-label architectures, self-checkout expansion, and renewable energy rollouts that cut operating costs.
White-space growth lies in urban micro-formats paired with same-day fulfilment. Operators retrofit underused parking lots for drive-thru pick-up lanes or solar canopies that lower utility bills. Acquisitions also shape the landscape: Auchan Retail and Groupement Les Mousquetaires acquired 313 French stores from Casino Group in March 2025 for EUR 1.35 billion, cementing national scale. Competitive success therefore hinges on capital access, digital agility, and the capacity to embed ESG into day-to-day operations.
Hypermarket Industry Leaders
Walmart Inc.
Carrefour SA
Costco Wholesale Corp
Tesco PLC
Kroger Co.
- *Disclaimer: Major Players sorted in no particular order

Recent Industry Developments
- May 2025: Lidl launched its first private-label meat line “Butcher’s Specialty” across 180 East Coast stores.
- April 2025: Kroger unveiled plans for 900 new “trendy” private-label products to capture evolving consumer tastes.
- March 2025: Auchan Retail and Groupement Les Mousquetaires completed the EUR 1.35 billion purchase of 313 Casino Group stores in France.
- September 2024: Amazon introduced “Amazon Saver”, a private-label grocery range priced mostly below USD 5 and available online and in Amazon Fresh locations.


Research Methodology Framework and Report Scope
Market Definitions and Key Coverage
Mordor Intelligence defines the hypermarkets market as all large-format retail outlets that combine full-line grocery departments with broad general merchandise ranges, trading on a self-service model and usually spanning more than 70,000 square feet. Sales assessed cover only in-store turnover booked by licensed hypermarket chains and are expressed in constant 2024 US dollars.
Scope exclusion: Gas stations, convenience minimarts, and pure e-commerce revenue are excluded.
Segmentation Overview
- By Product Category
- Food and Grocery
- Household and Personal Care
- Apparel and Accessories
- Consumer Electronics
- Home Appliances
- Other General Merchandise
- By Store Size
- Less than 70 000
- 70 001 - 150 000
- Greater than 150 000
- By Ownership Model
- Publicly-Listed Chains
- Cooperative Chains
- Privately-Owned Chains
- Franchise-Operated
- Joint-Ventures
- By Geography
- North America
- Canada
- United States
- Mexico
- South America
- Brazil
- Peru
- Chile
- Argentina
- Rest of South America
- Asia-Pacific
- India
- China
- Japan
- Australia
- South Korea
- South East Asia (Singapore, Malaysia, Thailand, Indonesia, Vietnam, Philippines)
- Rest of Asia-Pacific
- Europe
- United Kingdom
- Germany
- France
- Spain
- Italy
- BENELUX (Belgium, Netherlands, Luxembourg)
- NORDICS (Denmark, Finland, Iceland, Norway, Sweden)
- Rest of Europe
- Middle East and Africa
- United Arab Emirates
- Saudi Arabia
- South Africa
- Nigeria
- Rest of Middle East and Africa
- North America
Detailed Research Methodology and Data Validation
Primary Research
Structured interviews with merchandising heads, store development managers, and supply-chain partners across North America, Europe, and Asia-Pacific validate pricing ladders, space productivity, and planned opening pipelines, filling the gaps left by secondary sources and sharpening regional weightings.
Desk Research
Our analysts begin with macro indicators from World Bank urban population files, UN Comtrade HS-level inflow data for food and household consumables, and retail census releases from the U.S. Census Bureau, Eurostat, and Japan's METI, which together sketch the potential shopper base and product throughput. Trade association bulletins such as those from the National Retail Federation and the Consumer Goods Forum add store-count trends, while company 10-Ks and investor decks clarify average ticket sizes and private-label penetration.
Supplementary insights are drawn from paid repositories including D&B Hoovers for operator financials and Dow Jones Factiva for deal and expansion news, creating a fact bed that is broadened further through press scans and academic journals; this list is illustrative, not exhaustive.
Market-Sizing & Forecasting
A top-down model aligns national retail sales, grocery share, and hypermarket channel penetration before results are cross-checked with selective bottom-up roll-ups of major chains' revenue disclosures. Key variables like average basket value, selling-space growth, urban disposable income per capita, inflation-adjusted food prices, and private-label share shifts feed a multivariate regression that projects demand through 2030. When bottom-up estimates diverge beyond five percentage points, the higher variance driver is re-benchmarked with fresh field calls.
Data Validation & Update Cycle
Outputs pass a three-layer review: automated anomaly flags, peer analyst sign-off, and a senior editor sweep. Models refresh annually, with off-cycle revisions triggered by events such as major mergers, regulatory tax changes, or supply shocks; each client download is stamped with the latest verification date.
Why Mordor's Hypermarkets Baseline commands reliability
Published estimates often differ because firms pick dissimilar channel mixes, base years, or currency conversions, and because some roll supermarkets into the same bucket.
By anchoring results to audited store revenue, using shopper-level drivers, and refreshing every twelve months, Mordor delivers a balanced midpoint that decision-makers can reuse with minimal adjustment.
Benchmark comparison
| Market Size | Anonymized source | Primary gap driver |
|---|---|---|
| USD 785.63 B (2025) | Mordor Intelligence | - |
| USD 776.56 B (2024) | Regional Consultancy A | Includes fuel retail and does not inflation-normalize |
| USD 765 B (2024) | Trade Journal B | Treats stores under 60 k sq ft, blends convenience formats |
| USD 793.63 B (2025) | Industry Blog C | Sources secondary compilations, lacks primary validation |
In short, while figures vary, our disciplined scope choices, dual-path modeling, and continuous validation make Mordor Intelligence the dependable reference point for sizing and planning in the hypermarket arena.


Key Questions Answered in the Report
What is the current size of the hypermarket market?
The hypermarket market generated USD 804.88 billion in 2026 and is forecast to rise to USD 908.47 billion by 2031.
Which region leads the hypermarket market?
Asia–Pacific holds the largest regional position with 33.88% market share, driven by urbanization and rising disposable incomes.
Which product category dominates hypermarket sales?
Food and Grocery command 56.98% of sales, acting as the primary traffic driver for weekly shopping trips.
What store format is growing the fastest?
Smaller hypermarkets of ≤70,000 sq ft are projected to expand at a 6.82% CAGR, benefiting from urban real-estate constraints and convenience demand.
How are hypermarkets responding to e-commerce competition?
Chains are integrating click-and-collect, investing in micro-fulfilment, and expanding private-label offerings to retain shoppers and protect margins.
Why is franchising gaining importance in the hypermarket market?
Franchise structures allow rapid geographic growth with lower capital outlays, translating into a 7.34% CAGR forecast for franchise-operated stores by 2031.
Page last updated on:


